April 6, 2017 at 07:21
Splunk + Check Point, an example of analyzing the logs of your firewall
- Tutorial

If you are not satisfied with standard reports and analytics from Check Point, if your Smart Event hangs and loads your server, if Smart Event reports seem somewhat uninformative to you ... Why not create your own?
Today we will tell you how to upload Check Point logs to Splunk, what reports can be, and how to filter data so that you do not load the system again and reduce the license. And yes, if your company is not very large - then you can safely do with a free license.
Uploading Logs to Splunk
- We need a server with Splunk installed on top of Linux (due to the specifics of the OPSEC protocol), we usually use CentOS. We wrote about how to install Splunk earlier here .
- On Splunk you need to install Add-on for Check Point OPSEC LEA , step-by-step instructions here . To download the add-on from SplunkBase, you can use the same account that you created to download Splunk.
- Next you need:Prepare the Check Point Management Server itself:In Smart Dashboard: File → Manage → Servers And OPSEC Applications → New → OPSEC Application
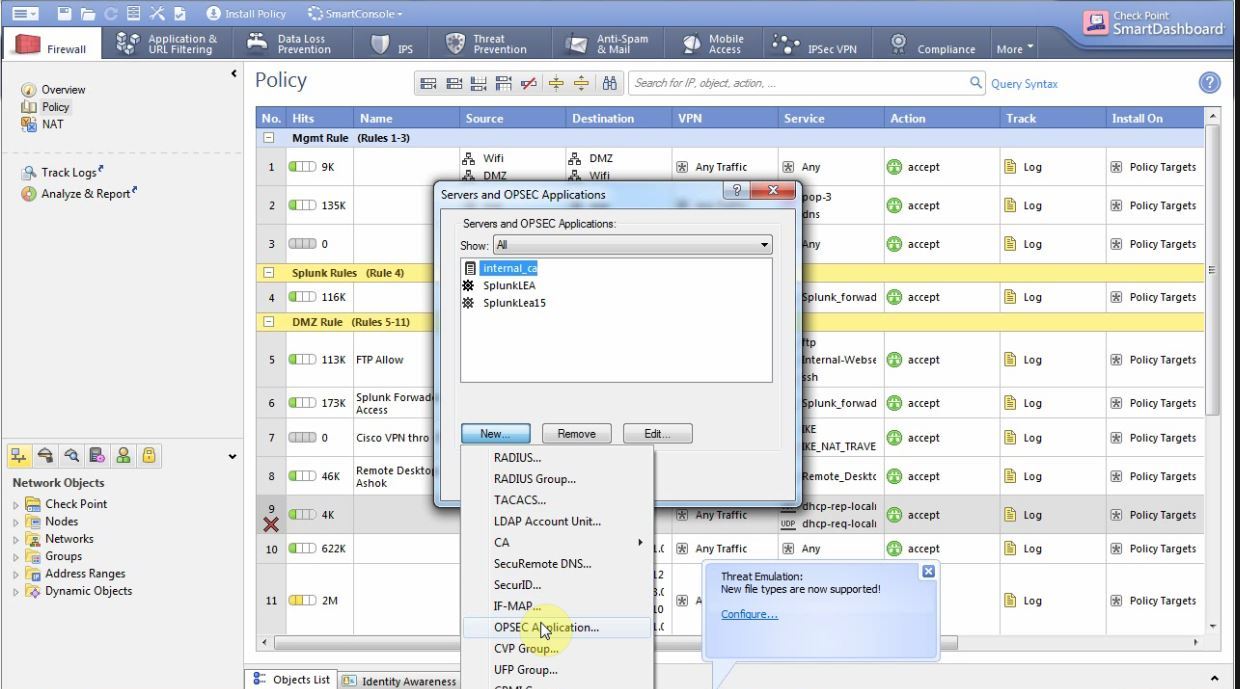
Give it any name (we will need it later), in the host field select a server with Splunk if it is already clogged in Check Point or create a new host with the Splunk server address . We go to the Permissions tab and see that there is a shuffle on Show all log fields . We return to the previous tab, check the LEA checkbox and press the Communication button.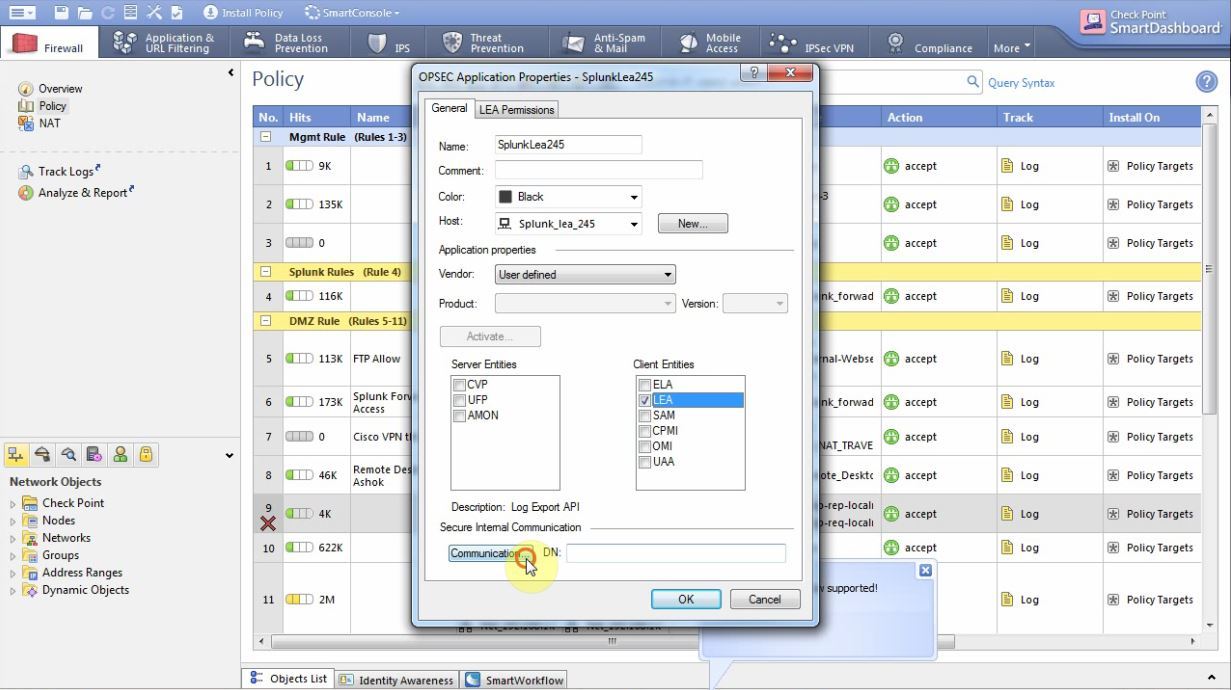
There we enter any one-time password (remember it)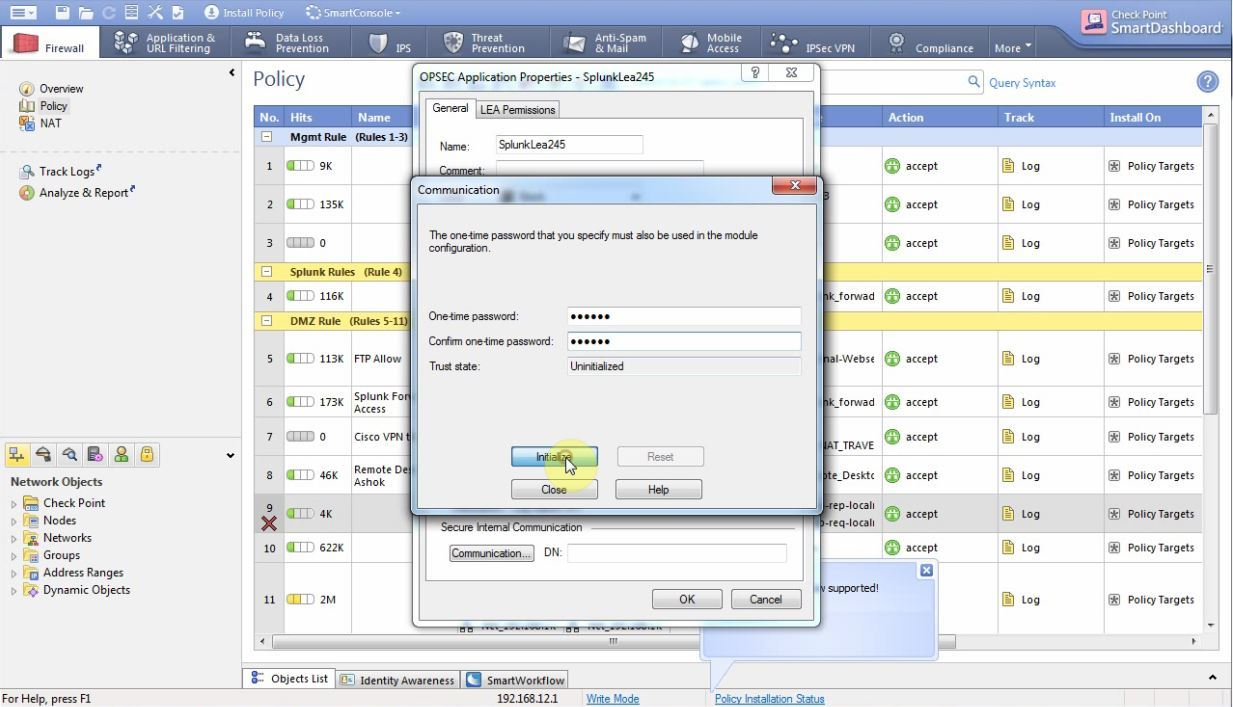
Then we install the File → Policy → Install Database databases: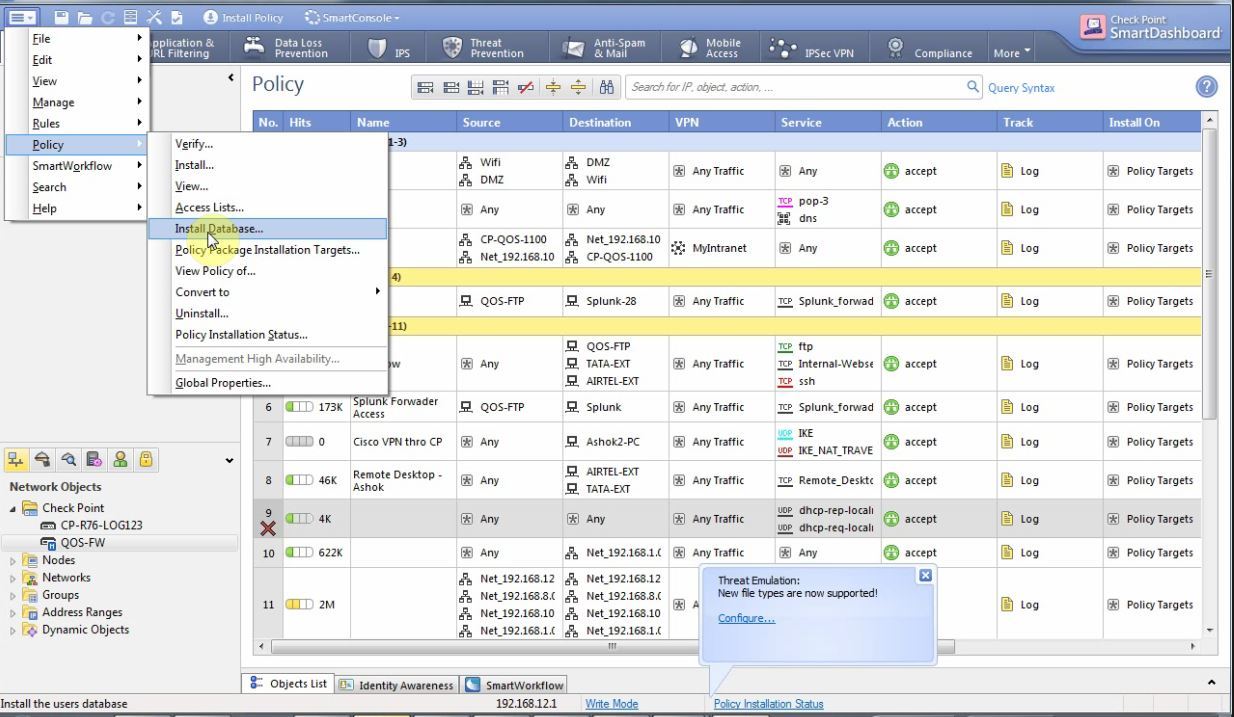
After that we need to create a rule that opens 18210 and 18184 ports for the server with Splunk and install the policies. - Install the following packages on a Linux server:
yum install glibc.i686 yum install pam.i686 - Next you need:Configure Addon on Splunk itselfAfter installing the OPSEC addon, you should see its icon.
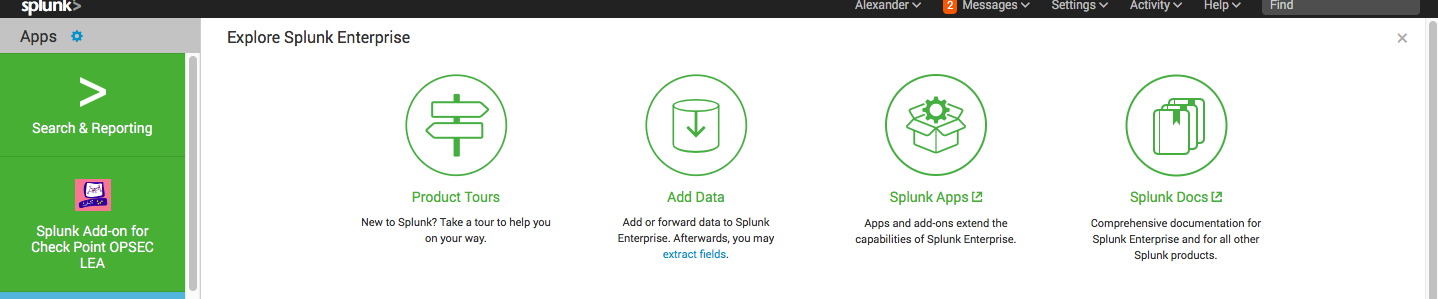
Go to it → Configuration → Add Connection and enter your data (important: the name of the application must match what you specified on the Check Point server, well, one-time password too)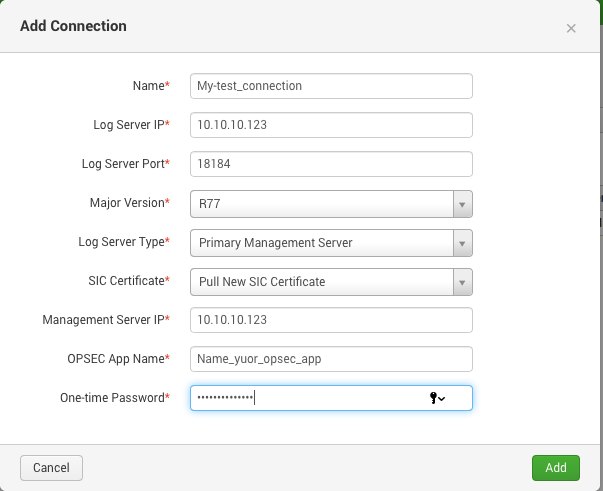
Next, go to the tab Inputs choose which logs to load (for completeness, select No Audit)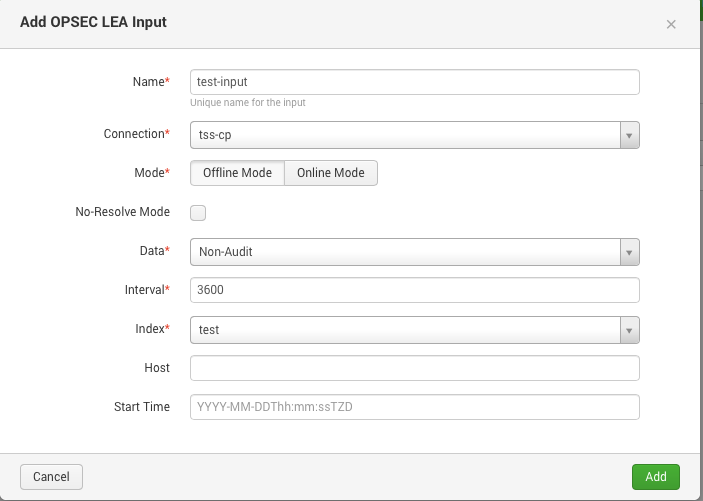
After which you need to wait a bit and the logs will begin to arrive, I’ll say right away that there will be a lot of them on the first day since Splunk will upload the logs over the past few weeks. As a result, you will receive:
index=* sourcetype=opsec*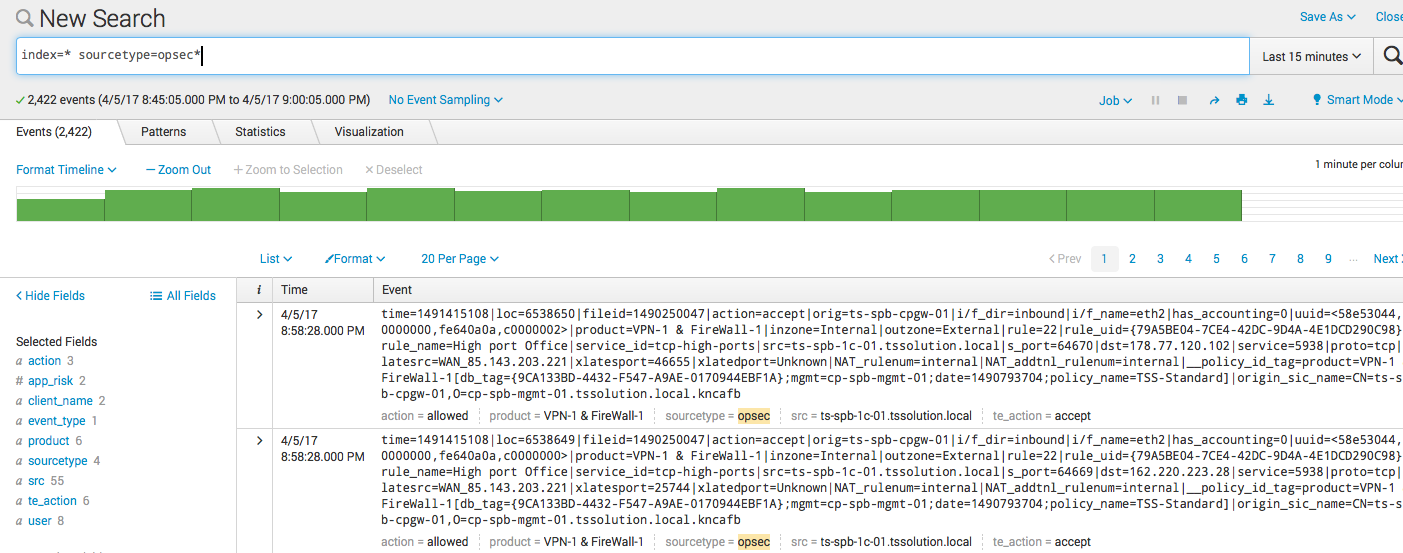
Filtration
If you have https inspection turned off and there is no sandbox, then 90% of the logs - there will be logs for working out firewall rules, they are actually of little interest. It mostly represents the logs of such blades as Application Control, URL Filter, Anti-Virus, Anti-Bot and IPS of course.
In order for Splunk not to index the firewall rule logs, you need to create two text files props.conf and transforms.conf and put them in the folder:
opt/splunk/etc/apps/Splunk_TA_checkpoint-opseclea/localContents of props.conf:
[opsec]
TRANSFORMS-security= events-filter
Contents of transforms.conf:
[events-filter]
REGEX=(.+product\=VPN\-1\s\&\sFireWall\-1)
DEST_KEY=queue
FORMAT=nullQueue
We will not describe in detail the logic of these files, as this is a rather lengthy process. A detailed description of each of them is on the documentation website ( props.conf / transforms.conf ).
Important ! For the changes to take effect, you need to reboot the server from Splunk.
Log visualization
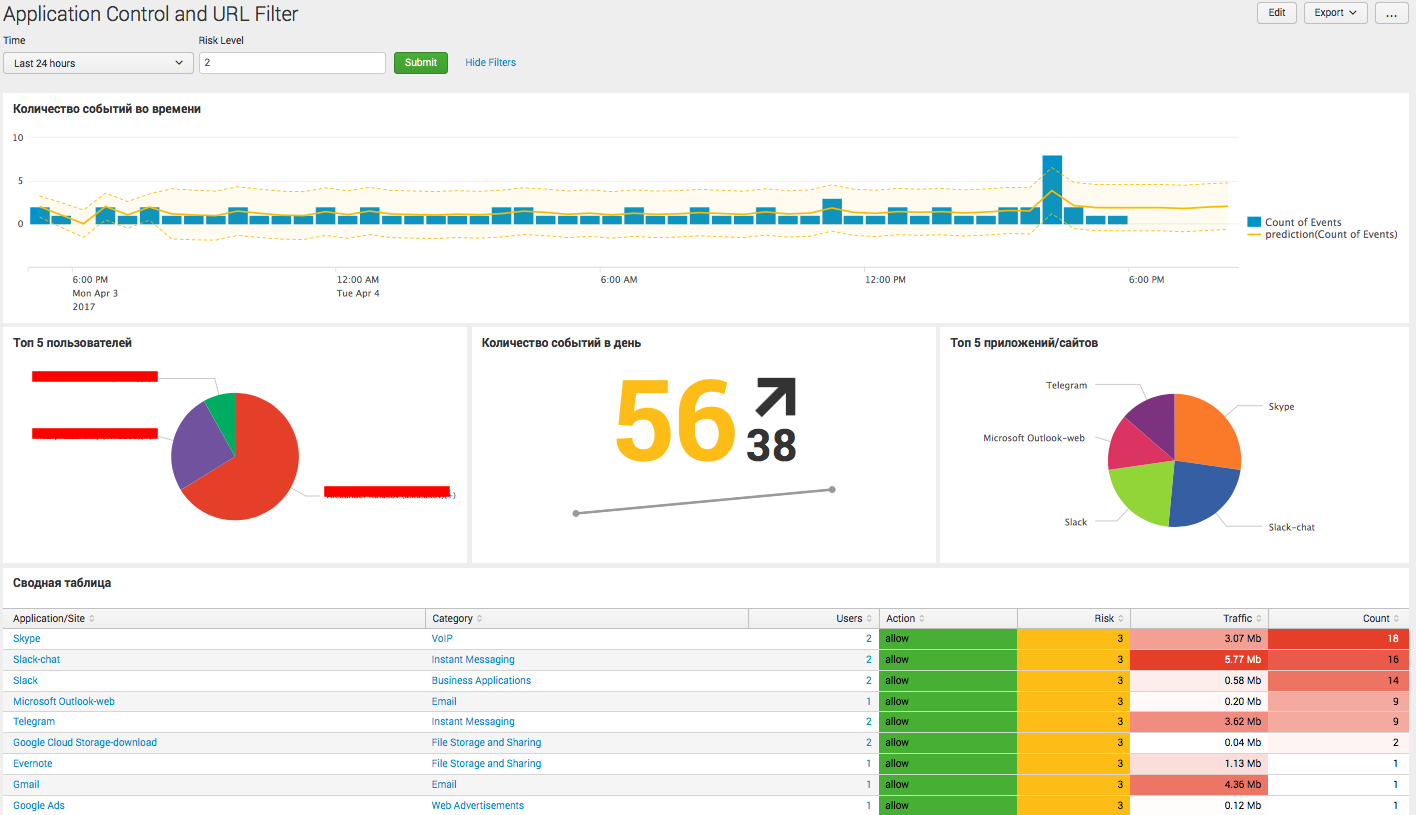
We showed one of the options for presenting Application Controll and URL Filter logs above. Below are its components along with requests.
Blade trigger events over time
index=* sourcetype=opsec*  product="Application Control" OR product="URL Filtering" action!=redirect app_risk>2 NOT bytes=* app_risk>2
| dedup _time, user, s_port, src, dst
| timechart count as "Count of Events" | predict "Count of Events"
Top 5 Users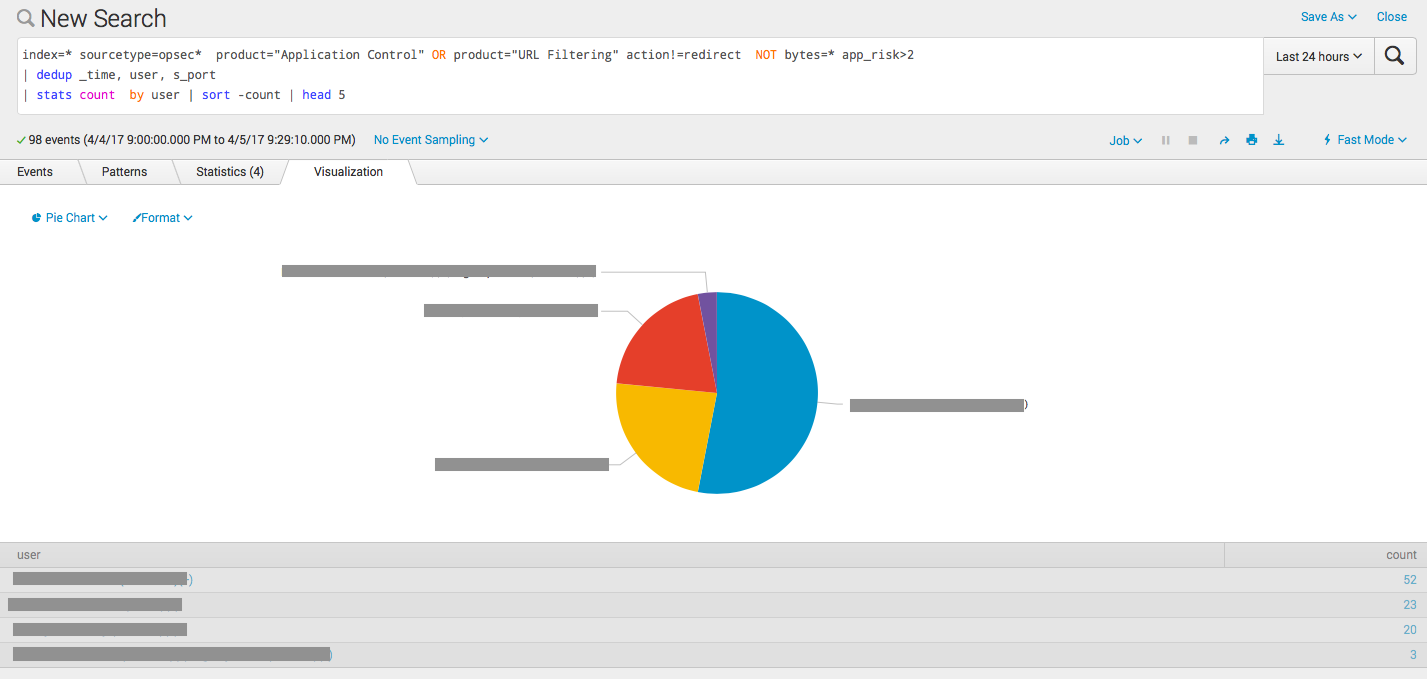
index=* sourcetype=opsec*  product="Application Control" OR product="URL Filtering" action!=redirect  NOT bytes=* app_risk>2
| dedup _time, user, s_port
| stats count  by user | sort -count | head 5
The number of events per day, taking into account the trend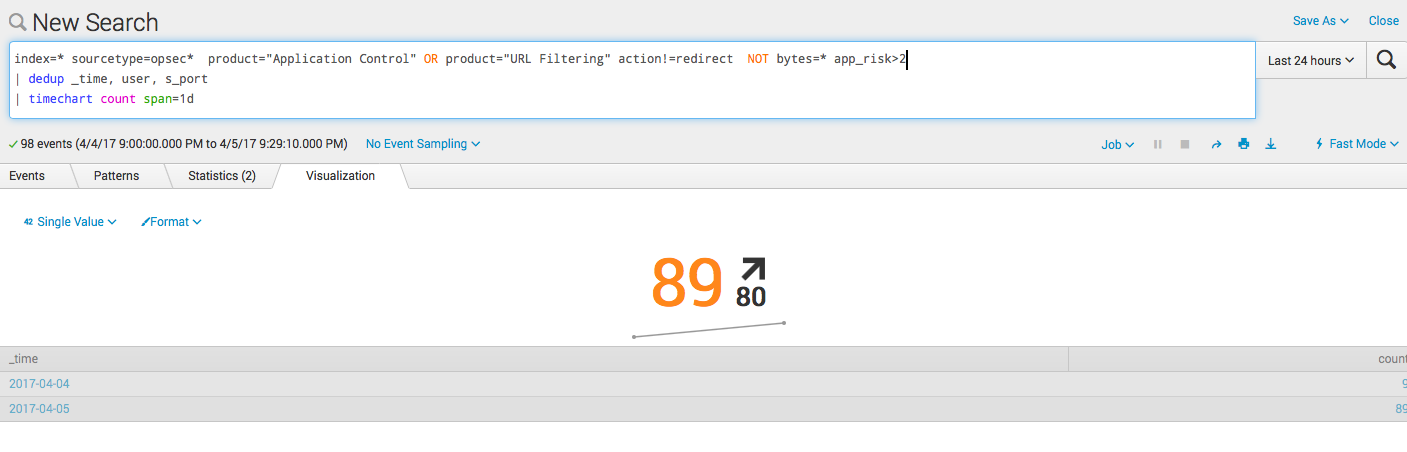
index=* sourcetype=opsec*  product="Application Control" OR product="URL Filtering" action!=redirect  NOT bytes=* app_risk>2
| dedup _time, user, s_port
| timechart count span=1d
Top 5 apps / sites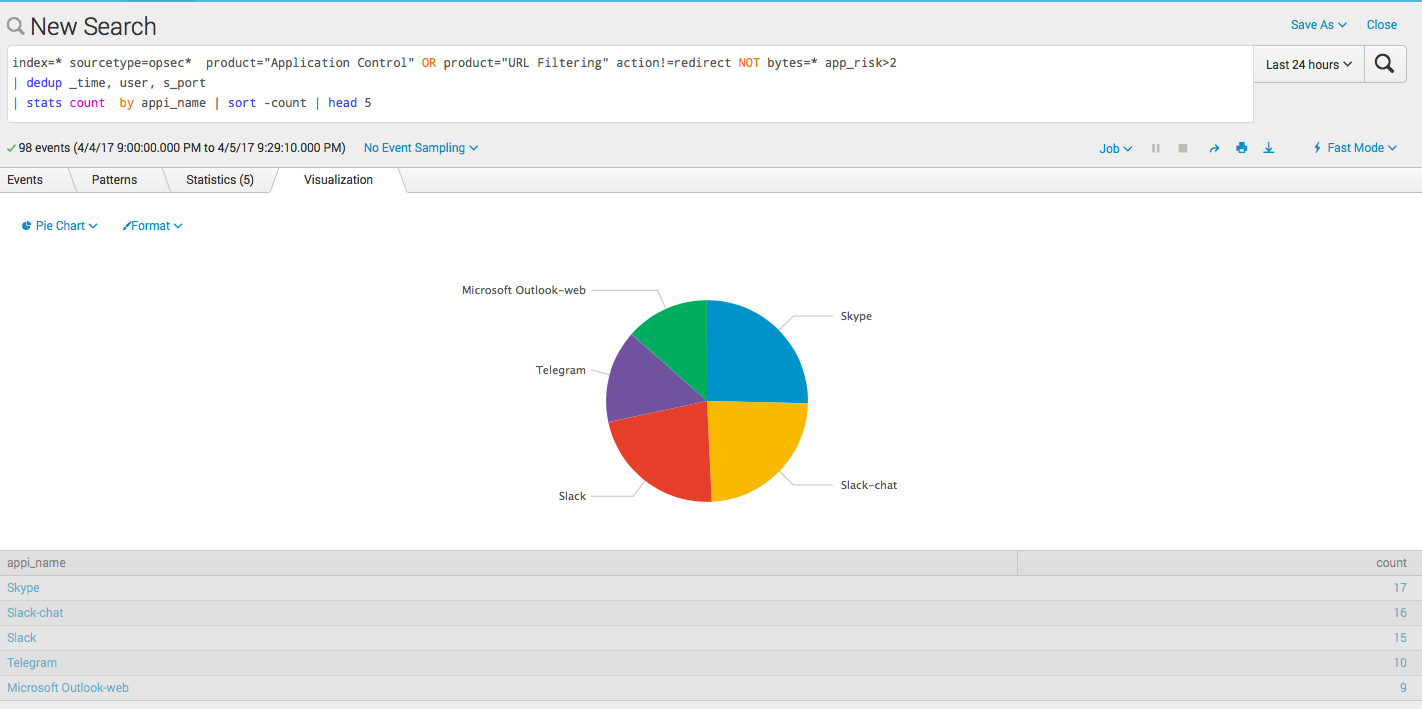
index=* sourcetype=opsec*  product="Application Control" OR product="URL Filtering" action!=redirect NOT bytes=* app_risk>2
| dedup _time, user, s_port
| stats count  by appi_name | sort -count | head 5
Summary table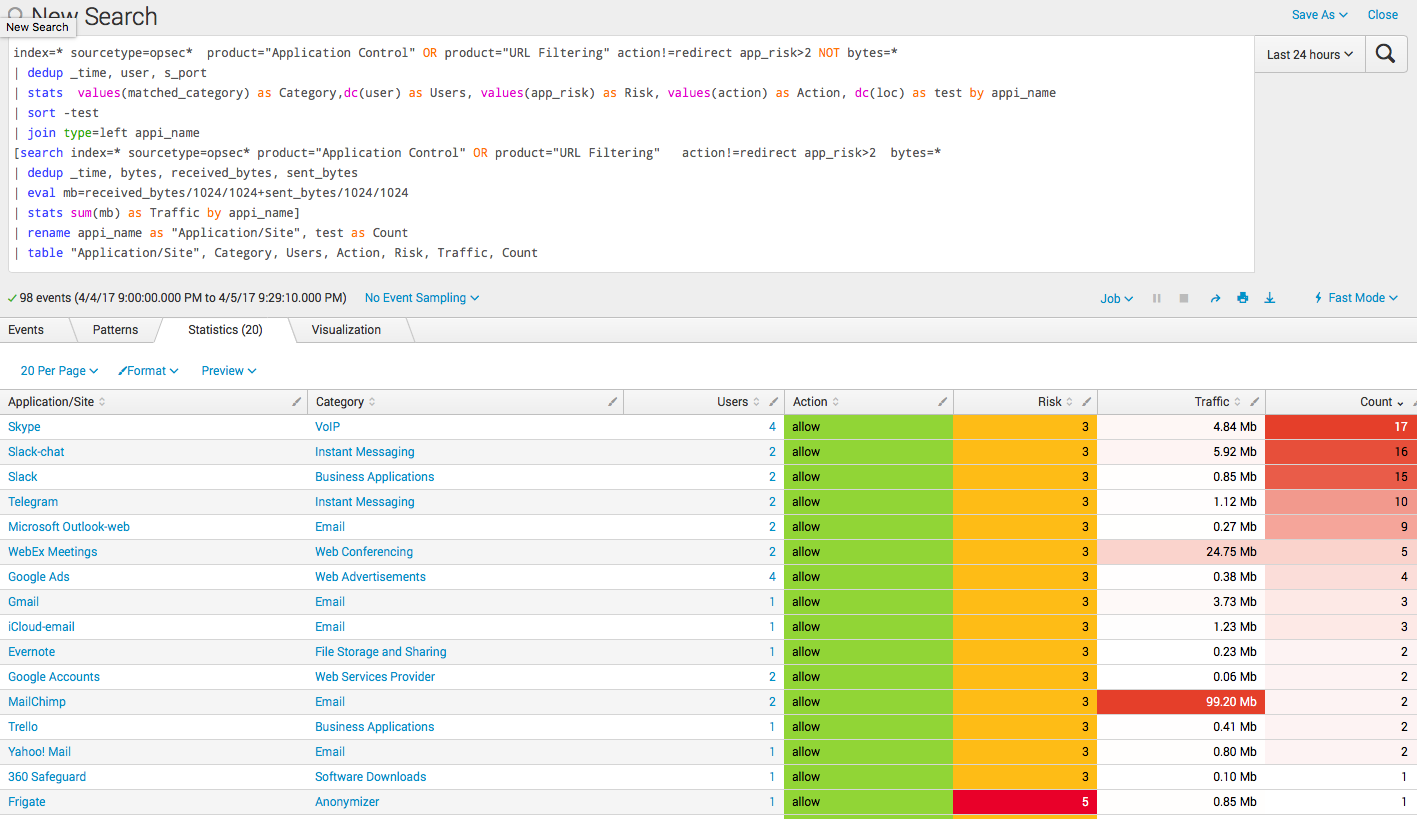
index=* sourcetype=opsec*  product="Application Control" OR product="URL Filtering" action!=redirect app_risk>2 NOT bytes=*
| dedup _time, user, s_port
| stats  values(matched_category) as Category,dc(user) as Users, values(app_risk) as Risk, values(action) as Action, dc(loc) as test by appi_name
| sort -test
| join type=left appi_name
[search index=* sourcetype=opsec* product="Application Control" OR product="URL Filtering"   action!=redirect app_risk>2  bytes=*
| dedup _time, bytes, received_bytes, sent_bytes
| eval mb=received_bytes/1024/1024+sent_bytes/1024/1024
| stats sum(mb) as Traffic by appi_name]
| rename appi_name as "Application/Site", test as Count
| table "Application/Site", Category, Users, Action, Risk, Traffic, Count
conclusions
In this example, we showed how you can use Splunk to analyze Check Point logs. This is a small example regarding only two software blades, but the capabilities of the system are clearly visible from it. We also did not touch on the topic of alerts or running scripts based on query results, but this is all naturally possible.
And yes, in addition to Check Point logs, you can download the logs of another system into the same Splunk, for example RSA Authentications and analyze their interconnections, but this is a smooth transition to the SIEM topic and a separate conversation.