PostgreSQL: PipelineDB - aggregate queries in real time
- Tutorial
Have you ever been asked to calculate the amount of something based on the data in the database for the last month, grouping the result by some values and breaking it all by day / hour?
If yes, then you already imagine that you have to write something like this, only worse
From time to time, a wide variety of such requests begin to appear, and if you can endure and help once, alas, appeals will be received in the future.
And such requests are bad because they take the system resources well for the duration of the execution, and there can be so much data that even a replica for such requests would be a pity (and one’s own time).
But what if I say that you can create a view directly in PostgreSQL that, on the fly, will take into account only new incoming data in a directly similar query, as above?
So - it can do the extension PipelineDB
Previously, PipelineDB was a separate project, but is now available as an extension for PG 10.1 and higher.
And although the opportunities provided for a long time already exist in other products specifically created for collecting metrics in real time - PipelineDB has a significant advantage: a lower threshold for entry for developers who already know how to use SQL).
Perhaps for someone it is irrelevant. Personally, I am not too lazy to try everything that seems appropriate for solving a particular task, but I also don’t immediately use one new solution for all cases. Therefore, in this note, I do not call to immediately drop everything and install PipelineDB, this is just an overview of the main functionality, since The thing seemed curious to me.
And so, in general, the documentation they have is good, but I want to share experience on how to try this practice in practice and display the results in Grafana.
In order not to litter the local machine, I deploy everything in the docker.
Used images:
On a postgres machine, perform the following steps:
Remember: insert data into the stream, and read - from the subscribed views
As soon as the 47th comes, the previous one stops updating and the current minute starts ticking.
If you pay attention to the query plan, you can see the original table with the data. I
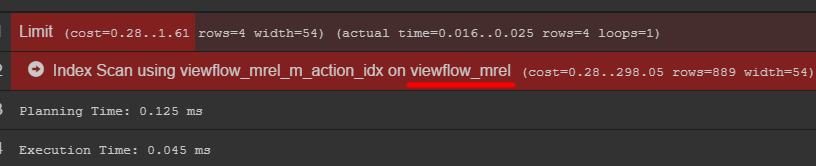
recommend to go into it and find out how your data is actually stored.
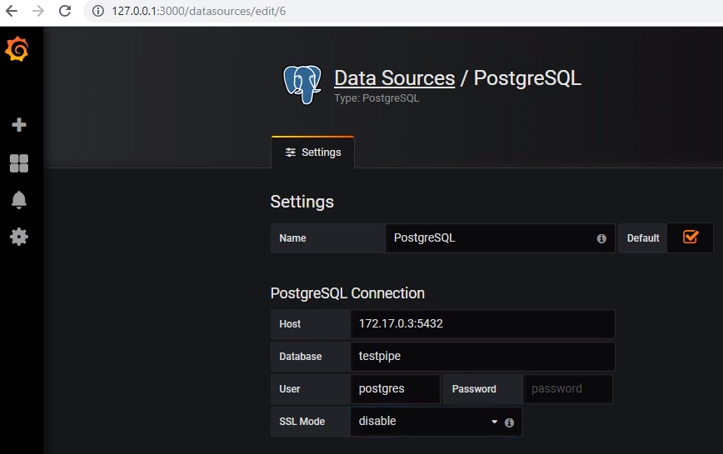
To get data from postgres, you need to add the appropriate data source:
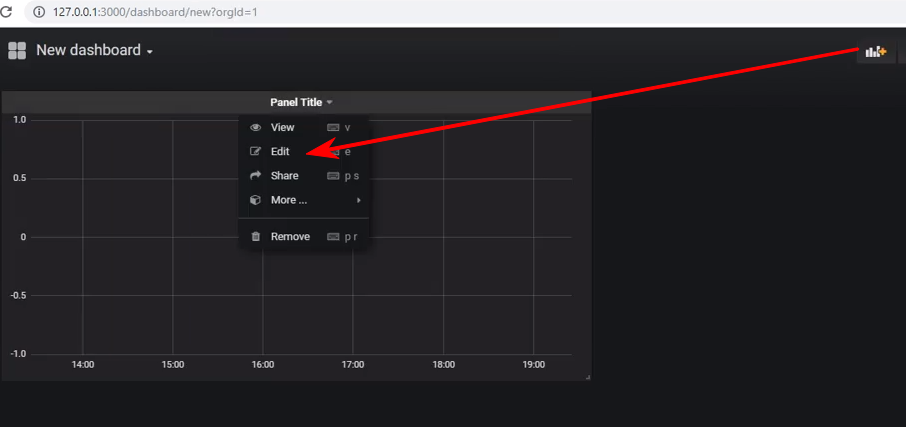
Create a new dashboard and add a Graph-type panel to it, and then go to the editing panel:
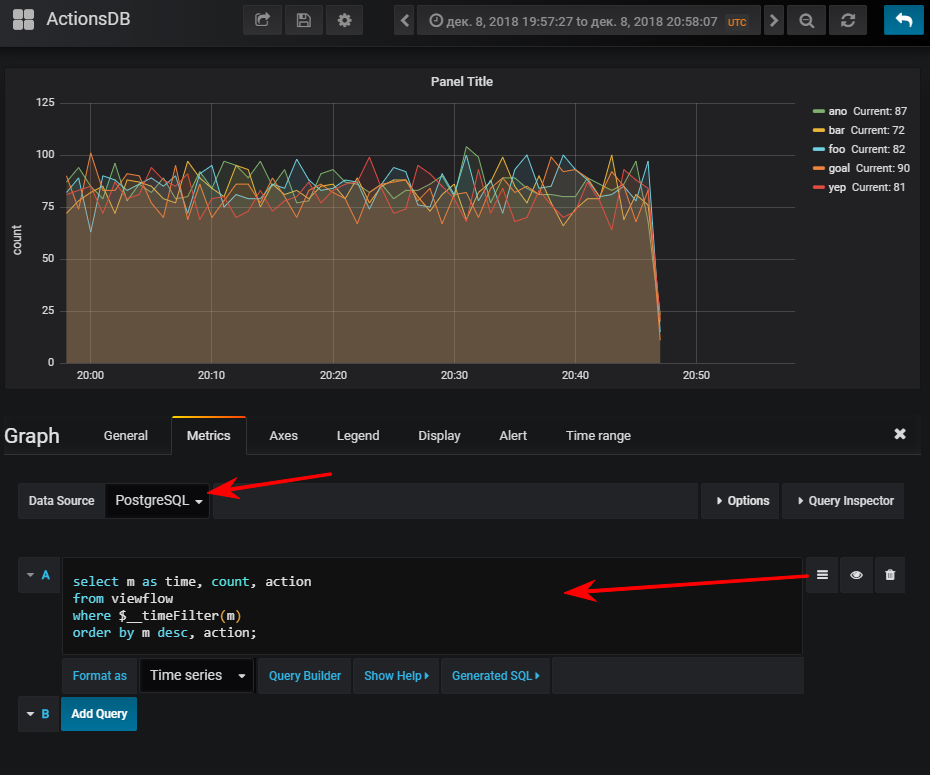
Next, select the data source, switch to the sql query writing mode and enter this:
And then we get a normal schedule, of course, if you run the
FYI event generator : the presence of an index can be very important. Although its use depends on the volume of the resulting table. If you plan to store a small number of rows for a small amount of time, it may very easily be that seq scan will be cheaper, and the index will only add extra. load when updating values
Several views can be signed for one stream.
Suppose I want to see how many api methods are performed by percentile
In general, the thing is working, behaved well, without complaints. Although under the docker, downloading their demo database in the archive (2.3 GB) turned out to be a bit long.
I want to note - I did not conduct stress tests.
Official documentation
If yes, then you already imagine that you have to write something like this, only worse
SELECThour(datetime), somename, count(*), sum(somemetric)
fromtablewhere datetime > :monthAgo
groupby1, 2orderby1desc, 2
From time to time, a wide variety of such requests begin to appear, and if you can endure and help once, alas, appeals will be received in the future.
And such requests are bad because they take the system resources well for the duration of the execution, and there can be so much data that even a replica for such requests would be a pity (and one’s own time).
But what if I say that you can create a view directly in PostgreSQL that, on the fly, will take into account only new incoming data in a directly similar query, as above?
So - it can do the extension PipelineDB
Demo from their site, how it works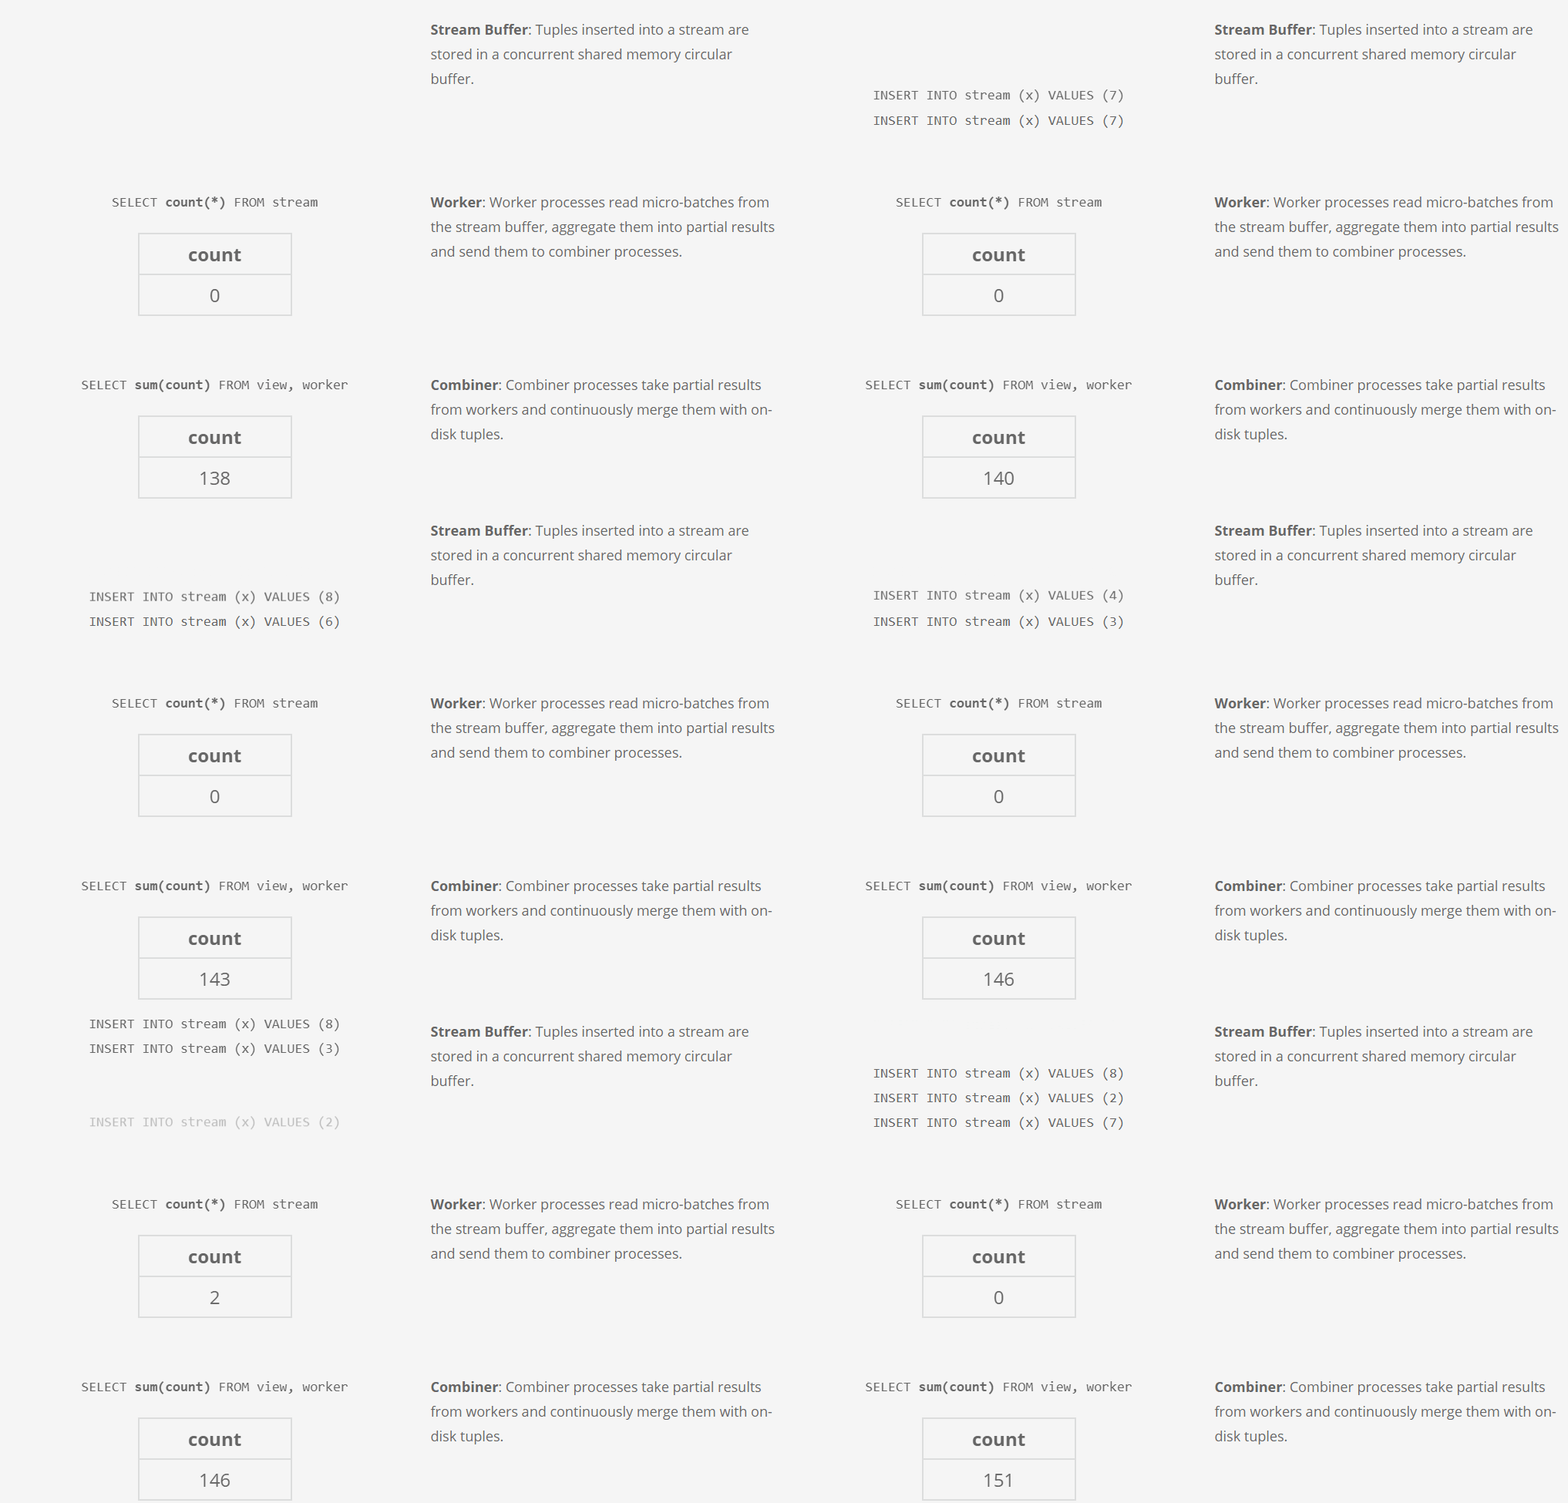
Previously, PipelineDB was a separate project, but is now available as an extension for PG 10.1 and higher.
And although the opportunities provided for a long time already exist in other products specifically created for collecting metrics in real time - PipelineDB has a significant advantage: a lower threshold for entry for developers who already know how to use SQL).
Perhaps for someone it is irrelevant. Personally, I am not too lazy to try everything that seems appropriate for solving a particular task, but I also don’t immediately use one new solution for all cases. Therefore, in this note, I do not call to immediately drop everything and install PipelineDB, this is just an overview of the main functionality, since The thing seemed curious to me.
And so, in general, the documentation they have is good, but I want to share experience on how to try this practice in practice and display the results in Grafana.
In order not to litter the local machine, I deploy everything in the docker.
Used images:
postgres:latest,grafana/grafanaInstalling PipelineDB on Postgres
On a postgres machine, perform the following steps:
apt updateapt install curlcurl -s http://download.pipelinedb.com/apt.sh | bashapt install pipelinedb-postgresql-11cd /var/lib/postgresql/data- Open in any editor file
postgresql.conf - Find the key
shared_preload_libraries, unlock and set the valuepipelinedb - Key
max_worker_processesset to 128 (docks recommendation) - Reboot server
Creating a stream and view in PipelineDB
After reboot pg - watch logs so that there is such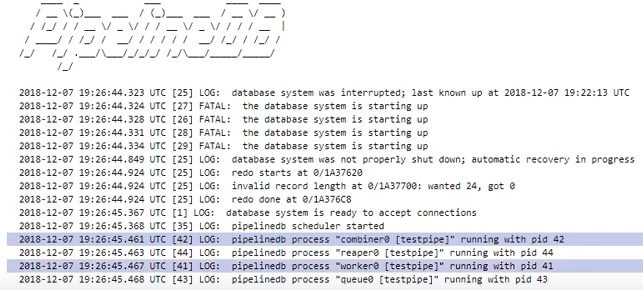
- The database in which we will work:
CREATE DATABASE testpipe; - Creating an extension:
CREATE EXTENSION pipelinedb; - Now the most interesting is the creation of a stream. It is necessary to add data to it for further processing:
CREATEFOREIGNTABLE flow_stream (
    dtmsk timestampwithouttime zone,
    actiontext,
    durationsmallint
) SERVER pipelinedb;
In fact, it’s very similar to creating an ordinary table, but youselectcannot simply get data from this stream - you need a view - actually how to create it:
CREATEVIEW viewflow WITH (ttl = '3 month', ttl_column = 'm') ASselectminute(dtmsk) m,
       action,
       count(*),
       avg(duration)::smallint,
       min(duration),
       max(duration)
from flow_stream
groupby1, 2;
They are called Continuous Views and by default materialize, i.e. with state preservation.
In the expressionWITHare passed additional parameters.
In my case, itttl = '3 month'says that you only need to store data for the last 3 months, and take the date / time from the columnM. The background processreaperlooks for obsolete data and deletes it.
For those who do not know - the functionminutereturns the date / time without seconds. Thus, all events that occurred in one minute will have the same time as a result of aggregation. - Such a view is practically a table, because an index by date for sampling would be useful if there is a lot of data to be stored.
createindexon viewflow (m desc, action);
Using PipelineDB
Remember: insert data into the stream, and read - from the subscribed views
insertinto flow_stream VALUES (now(), 'act1', 21);
insertinto flow_stream VALUES (now(), 'act2', 33);
select * from viewflow orderby m desc, actionlimit4;
selectnow()
I execute the query manually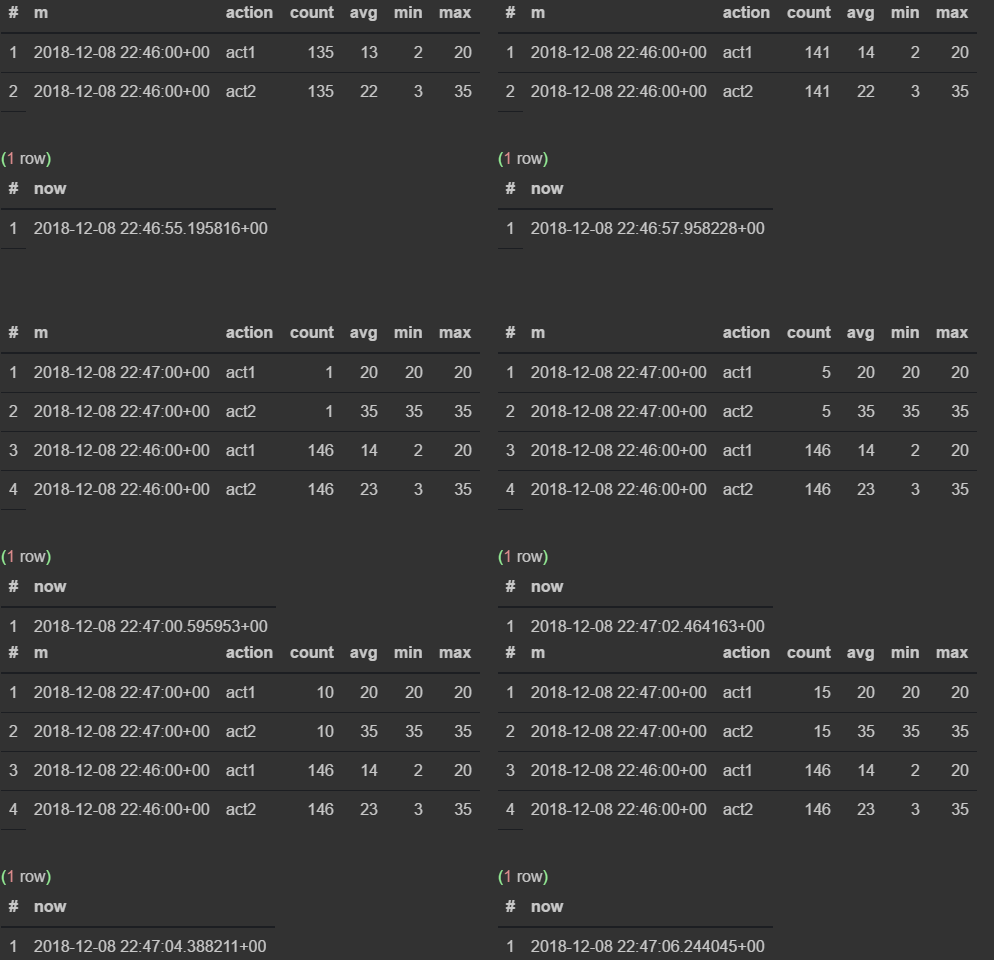
First, I observe how the data changes in the 46th minute. As soon as the 47th comes, the previous one stops updating and the current minute starts ticking.
If you pay attention to the query plan, you can see the original table with the data. I
recommend to go into it and find out how your data is actually stored.
C # event generator
using Npgsql;
using System;
using System.Threading;
namespacePipelineDbLogGenerator
{
    classProgram
    {
        privatestatic Random _rnd = new Random();
        privatestaticstring[] _actions = newstring[] { "foo", "bar", "yep", "goal", "ano" };
        staticvoidMain(string[] args)
        {
            var connString = "Host=localhost;port=5432;Username=postgres;Database=testpipe";
            using (var conn = new NpgsqlConnection(connString))
            {
                conn.Open();
                while (true)
                {
                    var dt = DateTime.UtcNow;
                    using (var cmd = new NpgsqlCommand())
                    {
                        var act = GetAction();
                        cmd.Connection = conn;
                        cmd.CommandText = "INSERT INTO flow_stream VALUES (@dtmsk, @action, @duration)";
                        cmd.Parameters.AddWithValue("dtmsk", dt);
                        cmd.Parameters.AddWithValue("action", act);
                        cmd.Parameters.AddWithValue("duration", GetDuration(act));
                        var res = cmd.ExecuteNonQuery();
                        Console.WriteLine($"{res}{dt}");
                    }
                    Thread.Sleep(_rnd.Next(50, 230));
                }
            }
        }
        privatestaticintGetDuration(string act)
        {
            var c = 0;
            for (int i = 0; i < act.Length; i++)
            {
                c += act[i];
            }
            return _rnd.Next(c);
        }
        privatestaticstringGetAction()
        {
            return _actions[_rnd.Next(_actions.Length)];
        }
    }
}
Conclusion in Grafana
To get data from postgres, you need to add the appropriate data source:
Create a new dashboard and add a Graph-type panel to it, and then go to the editing panel:
Next, select the data source, switch to the sql query writing mode and enter this:
select
  m astime, -- Grafana требует колонку timecount, actionfrom viewflow
where $__timeFilter(m) -- макрос графаны, принимает на вход имя колонки, на выходе col between :startdate and :enddateorderby m desc, action;
And then we get a normal schedule, of course, if you run the
FYI event generator : the presence of an index can be very important. Although its use depends on the volume of the resulting table. If you plan to store a small number of rows for a small amount of time, it may very easily be that seq scan will be cheaper, and the index will only add extra. load when updating values
Several views can be signed for one stream.
Suppose I want to see how many api methods are performed by percentile
CREATEVIEW viewflow_per WITH (ttl = '3 d', ttl_column = 'm') ASselectminute(dtmsk) m,
      action,
      percentile_cont(0.50) WITHINGROUP (ORDERBYduration)::smallint p50,
      percentile_cont(0.95) WITHINGROUP (ORDERBYduration)::smallint p95,
      percentile_cont(0.99) WITHINGROUP (ORDERBYduration)::smallint p99
from flow_stream
groupby1, 2;
createindexon viewflow_per (m desc);
I do the same trick with grafana and get: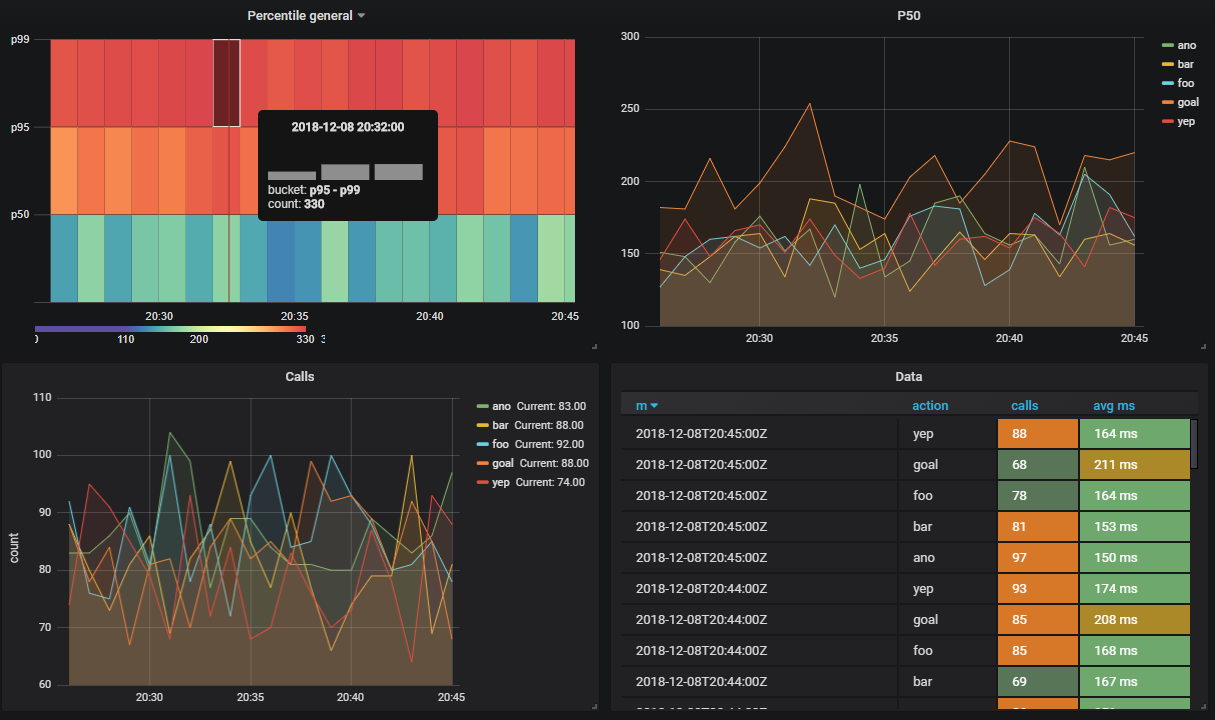
Total
In general, the thing is working, behaved well, without complaints. Although under the docker, downloading their demo database in the archive (2.3 GB) turned out to be a bit long.
I want to note - I did not conduct stress tests.
Official documentation
Can be interesting
- Support for loading data from Apache Kafka to streams
- Similar to Amazon Kinesis
- You can create views only for data transformation (without storage)
- PipelineDB Cluster - commercial version available. In it it is possible to distribute views on shards. More on the cluster solution dock.