Statistics on the value of real estate - visualization on the map
Introduction
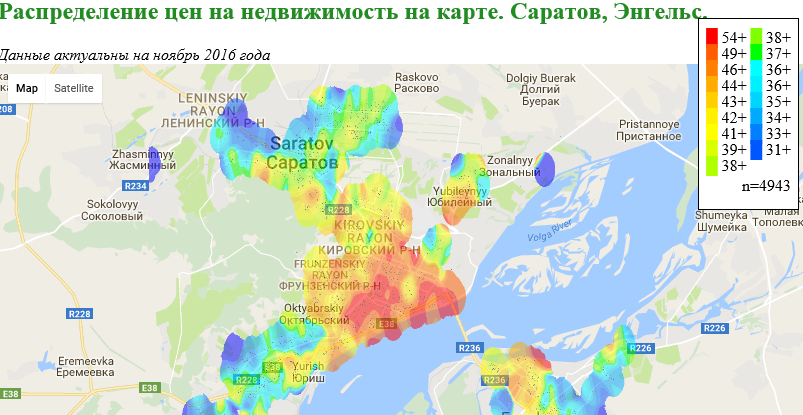
I'll start from the end. This is a screenshot from a web map that displays the average cost of real estate in the secondary market of Saratov and Engels:
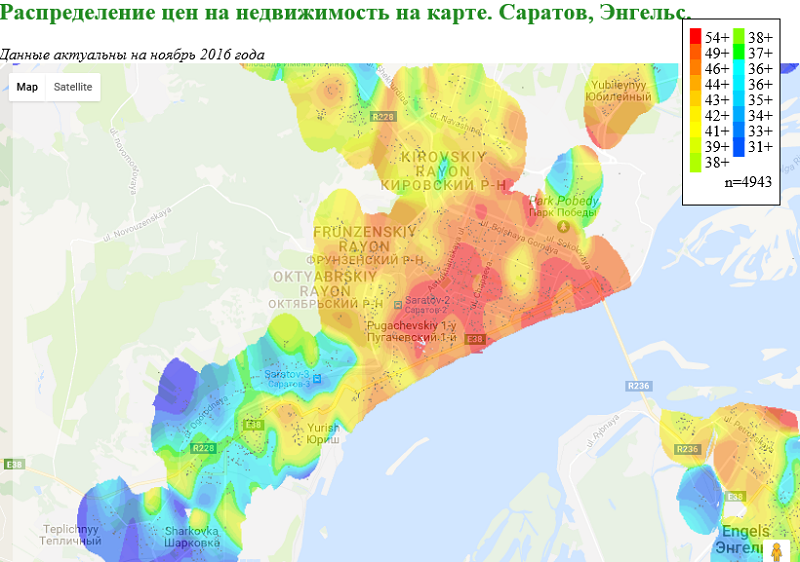
Colors on the map can be correlated with colors on the “legend”, color on the “legend” corresponds to the average cost per square meter of the total area in thousands of rubles.
A point on the map corresponds to one offer for the sale (on the secondary market) of an apartment with Avito. In total, such points, as can be seen on the "legend", were used to build the graph 4943. The
map is interactively available on GitHub .
And now a little background ..
A long time ago…
... when I was writing a paper on statistical processing of data on real estate prices as a student in mehmat, I accidentally found a useful document - gradation of districts on real estate prices, something like “Price zones of Saratov”. I don’t know who composed it, but it was plausible, the analysis showed that (if other factors are taken into account), the difference between the average cost per square meter of apartments from neighboring price zones was approximately 10%. Since then, to act as an appraiser of real estate (at the household level), like most adults, more than once.
The idea to approach this issue again more “scientifically” came to mind when I saw the publication of Jeff Kaufman Boston Apartment Price Maps .
Comrade did the following:
- A Python script that parses data on the cost of rental property from the PadMapper website .
- Another script, which using the Spatial interpolation methods, renders this data in the form of a raster image.
- Overlaid this image on a page with Google Maps
As a result, he got such an interactive map of the distribution of rental costs on a Boston map :
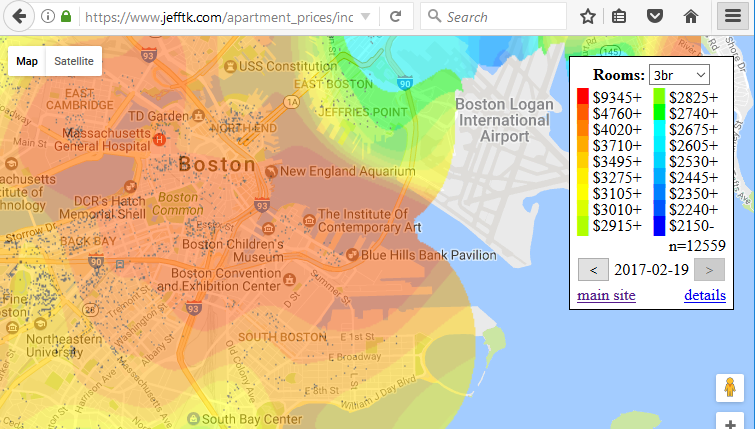
After the first “Wow, it's cool,” the next thought is “What if you try to do the same, but for Russia, just don’t at the cost of rent, and at prices per square real estate. ”
I’ll say right away that, by my current occupation, I’m rather a database developer, and I’m not a specialist in GIS data, nor in front-end development, nor in statistics, nor in Python, so be kind to ... I don’t know what, but I hope this will not be very much and you will write about it for me to correct.
And here comes the first major task
Web Scraping with Avito.
Since with Python at that time I was completely on “you”, after studying the HTML code of Avito pages, I decided to write my own bike as a library in C #, using AngleSharp for parsing .
I will not go deep into implementation features now, I’ll just notice:
- I put all the Avito parsing metadata into a separate configuration class, so that in the future, when changing the markup structure on Avito, you could just change the line in the configuration file.
- in order to avoid the ban from Avito, I had to add artificial delays of 10 seconds after processing each ad. (I agree, this is not the smartest way, but I could not find a suitable pool of proxy IPs offhand).
In the end, by running the parcel for the night, I got the necessary data recorded on the tablet in the database.
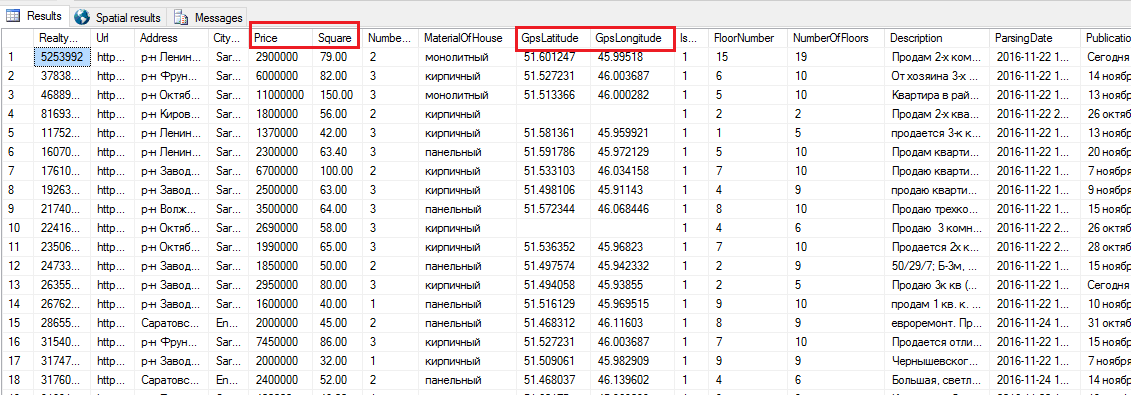
Having cleared the data from the “Old Fund”, “Elite”, and any obviously inadequate offers, I got a sample of five thousand points - selling apartments on the secondary market Saratov and Engels. And this made it possible to proceed to the next step:
GIS data processing.
The general statement of the problem:
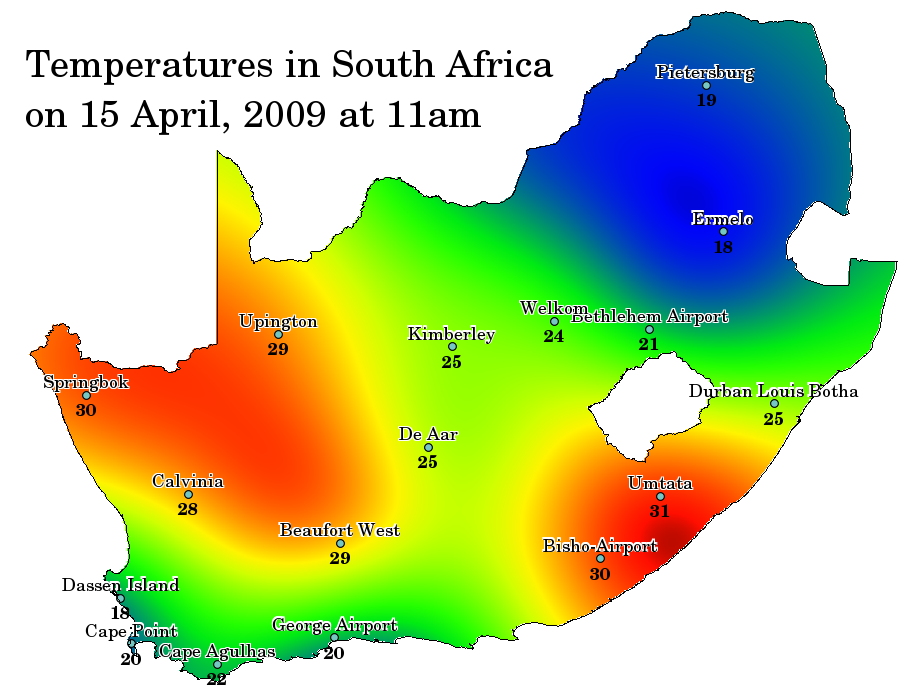
- there is a discrete set of values for a certain metric (temperature, height, substance concentration, etc.), with reference to the coordinates on the plane (X, Y or latitude, longitude),
- you must be able to predict the value of this metric in an arbitrary point of this plane,
- the result is visualized as a color scheme on the plane. For the color scheme, for convenience, colors can be sampled.
An example is to take readings from temperature sensors at different points in different places, process them, get the following picture:
In fact, tasks of this kind require immersion in the subject of “ Spatial interpolation ”. It has its own mathematical apparatus, for example:
- Inverse Distance Weighting (IDW) Interpolation
- Kriging
and has its own tools as a part of the popular GIS packages such as
- Interpolation point data qgis
- Geostatistical Analyst extension the ArcGIS
- the Use of of SAGA GIS for the spatial interpolation (Kriging)
- Kriging in the R .
I tried IDW as part of qGIS (see the first of the links) - the result did not satisfy me.

Therefore, in order not to get stuck in the development of new tools for a long time, I preferred to use the ready-made Python script from Jeff Kraufman . To calculate distances and to translate GPS coordinates in X, Y coordinates on the raster, a simplified linear formula is used here, without usingused in Google MapsWeb Mercator projection .
As I understand it, the script uses a variation on the theme of Inverse Distance Weighting (IDW), the main (and the heaviest in terms of calculation) part of this script is here in this code.
Python spatial interpolation code
gaussian_variance = IGNORE_DIST/2
    gaussian_a = 1 / (gaussian_variance * math.sqrt(2 * math.pi))
    gaussian_negative_inverse_twice_variance_squared = -1 / (2 * gaussian_variance * gaussian_variance)
    defgaussian(prices, lat, lon, ignore=None):
    num = 0
    dnm = 0
    c = 0for price, plat, plon, _ in prices:
    if ignore:
    ilat, ilon = ignore
    if distance_squared(plat, plon, ilat, ilon) < 0.0001:
    continue
    weight = gaussian_a * math.exp(distance_squared(lat,lon,plat,plon) *
    gaussian_negative_inverse_twice_variance_squared)
    num += price * weight
    dnm += weight
    if weight > 2:
    c += 1# don't display any averages that don't take into account at least five data points with significant weightif c < 5:
    returnNonereturn num/dnm
    defdistance_squared(x1,y1,x2,y2):return (x1-x2)*(x1-x2) + (y1-y2)*(y1-y2)
I adjusted my data array to the required format, removed the part from the script that does the correlation calculation relative to bedroom_category (number of rooms), played with the input parameters, and started the calculation. On my computer (Intel® Core (TM) i7-6700 CPU, 16GB RAM), it took about half an hour to calculate with 5 thousand points at the input and the image resolution at the output 1000 * 1000.
It remains to work a little with the Front-End. We look at HTML source maps of Boston from Jeff Kraufman. We modify it a little according to our data, and we get just such a "picture of oil".
To check for explicit “jambs” in Georeferencing, load the same set of points in qGIS, load Google Maps, compare images.
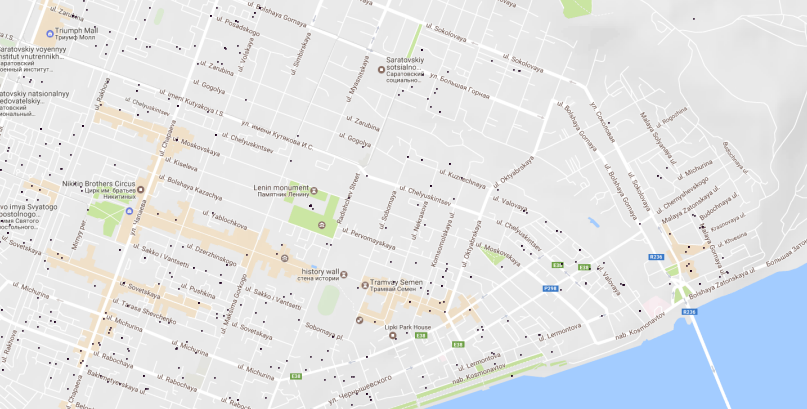
Having made sure that the points on the drawn map are in their places, and the colors on it plausibly reflect the prices of apartments in our village, we can exhale - “Yes! Works!".
But it’s a little upsetting that the picture we climbed into the Volga. Naturally, the calculation algorithm does not know anything about the Volga.
So the task arises:
Crop image on a coastline map
An attempt to find geo-data on the administrative boundaries of cities taking into account the coastline was unsuccessful. There are Saratov, there is Engels, and the border between them passes in the middle of the Volga. Okay, we will go the other way.
Download a shape file with data on coastlines from open sources , load it as a vector layer in qGIS, select the necessary polygons, sort out the file structure, pull out the polygons that belong to the Volga near Saratov, fill the data into the database.
A bit of magic like:
DECLARE @Volga geography;
        select @Volga= PlacePolygon.MakeValid() from PlacesPolygons where PlacesPolygonID =1003DECLARE @Saratov geography;
        select @Saratov= PlacePolygon.MakeValid() from PlacesPolygons where PlacesPolygonID =2select @Saratov.STDifference(@Volga)
And we get the right training ground - the boundaries of the city, taking into account the coastline.
It remains to load this into qGIS, load the image generated by the script there as a raster layer, conduct Georeferencing for this image, and crop it along the polygon with city borders, all using standard qGIS tools. Everything would be great if ... I managed to do it. But alas ... I didn’t have a relationship with Georeferencing in qGIS , and after several attempts I decided that using spatial functions from Microsoft.SqlServer.Types, it’s easier to quickly make another bike in the form of a utility on the sharpe.
C # code for cropping a pattern on a GEO polygon
string GPSPolygonVolga = "    POLYGON ((46.2324447632 51…. ))";
    privatevoidCropByGPS()
    {
    Bitmap bmp = new Bitmap(inputFilePath);
    int w = bmp.Width;
    int h = bmp.Height;
    var GpsSizeOfPyxelX = (MAX_LON - MIN_LON) / w;
    var GpsSizeOfPyxelY = (MAX_LAT - MIN_LAT) / h;
    var VolgaPolygon = SqlGeography.STPolyFromText(new System.Data.SqlTypes.SqlChars(GPSPolygonVolga), SRID);
    for (int y = 0; y < h; y++)
    {
    for (int x = 0; x < w; x++)
    {
    Color c = bmp.GetPixel(x, y);
    var GPS = SqlGeography.Point(MAX_LAT - GpsSizeOfPyxelY * y, MIN_LON + GpsSizeOfPyxelX * x, SRID);
  if (VolgaPolygon.STContains(GPS)) //попадает ли точка в "водяной" полигон
    bmp.SetPixel(x, y, Color.Transparent);
    }
    }
    bmp.Save(outputFilePath, System.Drawing.Imaging.ImageFormat.Png);
    }
We downloaded the source file with the raster, received the same file in the output, but in a bit “bitten” form. We put it on Google Maps in the browser, we look - nothing climbs on the Volga, excellent! We look a little more closely and see ... that it seems that in some places they bit off the excess. Cant in the data or cant in the procedure? Again, look at the loaded layers in qGIS.
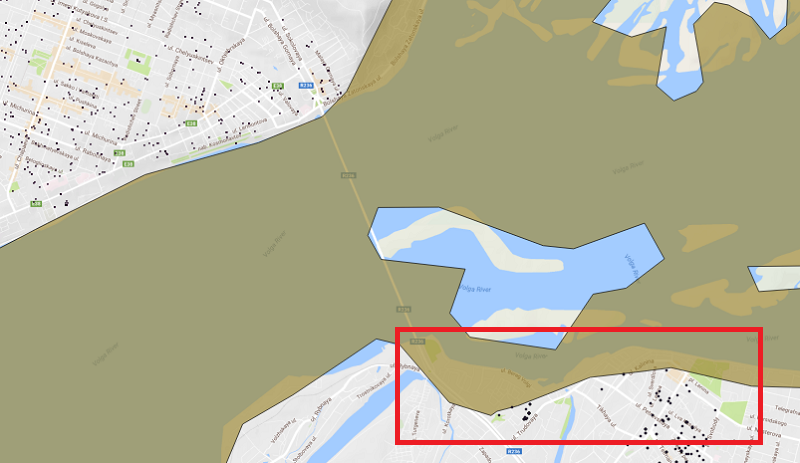
Yes ... indeed, sometimes here and there ... landfills from the reservoir layer clearly climb into the city. It’s not Engels who is direct, but some kind of Venice ... Well, there is no desire for perfection, we will go the other way.
Since vector data is out of trust, we will work with raster data. We need to superimpose two pictures, and cut out from the first those points that correspond to “blue” in the second.
For example, the Google Maps static API can give us a picture with a map .
We get API_KEY, find out that:
- maximum resolution for free use = 640 * 640
- parameterization by BoundingBox -, unlike BING static maps, Google does not support API , and you will have to additionally correlate two images in the coordinate plane.
Okay, try it. We get from the Google Statics Map API a certain picture with a map covering the area of interest to us, we write the following code:
C # cropping in the picture
privatestaticvoidCropByMapImage()
    {
    Bitmap bmp = new Bitmap(inputFilePath);
    Bitmap bmpMap = new Bitmap(mapToCompareFilePath);
    int w = bmp.Width;
    int h = bmp.Height;
    var GpsSizeOfPyxelX = (MAX_LON - MIN_LON) / w;
    var GpsSizeOfPyxelY = (MAX_LAT - MIN_LAT) / h;
    int wm = bmpMap.Width;
    int hm = bmpMap.Height;
    var cntAll = w * h;
    var cntRiver = 0;
    for (int y = 0; y < h; y++)
    {
    for (int x = 0; x < w; x++)
    {
    var currentLatitude = MAX_LAT - GpsSizeOfPyxelY * y;
    var currentLongitude = MIN_LON + GpsSizeOfPyxelX * x;
    if (currentLongitude < MIN_LON_M || currentLongitude > MAX_LON_M || currentLatitude < MIN_LAT_M || currentLatitude > MAX_LAT_M) continue; //todo - something with this ugly codevar CorrespondentX = (int)((currentLongitude - MIN_LON_M) / (MAX_LON_M - MIN_LON_M) * wm);
    var CorrespondentY = (int)((MAX_LAT_M-currentLatitude) / (MAX_LAT_M - MIN_LAT_M) * hm);
    Color cp = bmp.GetPixel(x, y); //color of current pixel
    Color mp = bmpMap.GetPixel(CorrespondentX, CorrespondentY); //color of correspondent Map pixelif  (Math.Max(Math.Max( Math.Abs(mp.R - WaterMapColor.R) , Math.Abs(mp.G - WaterMapColor.G)) , Math.Abs(mp.B -WaterMapColor.B))< colorDiff /* && cp.A != Color.Transparent.A */)// blue water is not always the same blue
    {
    bmp.SetPixel(x, y, Color.Transparent);
    cntRiver++;
    }
    }
    }
    bmp.Save(outputFilePath, System.Drawing.Imaging.ImageFormat.Png);
    }
We process our file with a resolution of 1000 * 1000 using a file with a resolution of 640 * 640, we get ... such a result (here, for clarity, the points that should be Transparent are made yellow):
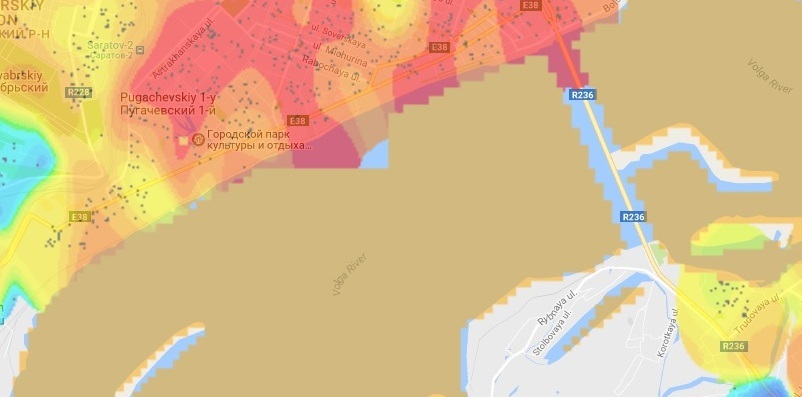
The result is sad, including also because Google scaled discretely, and therefore with a large margin overlaps our generated raster. That is, either you need to take a lot of cards with a suitable scale to “crop” or ... somehow you still need to find one, but with a good resolution.
I - went the second way, that is, I just took a screenshot of the desired projection of a regular Google map from a browser. GPS coordinates of the corners (mapping bound), I found out by adding this to the JavaScript code:
google.maps.event.addListener(map, 'bounds_changed', function () {
        console.log(map.getBounds());
I processed our raster using a new map from the saved screenshot, uploaded it to the browser and ... the result was more likely to please me. Quite correctly (within the accuracy of GPS positioning) even a small pond in a local city park “cleaned up”.
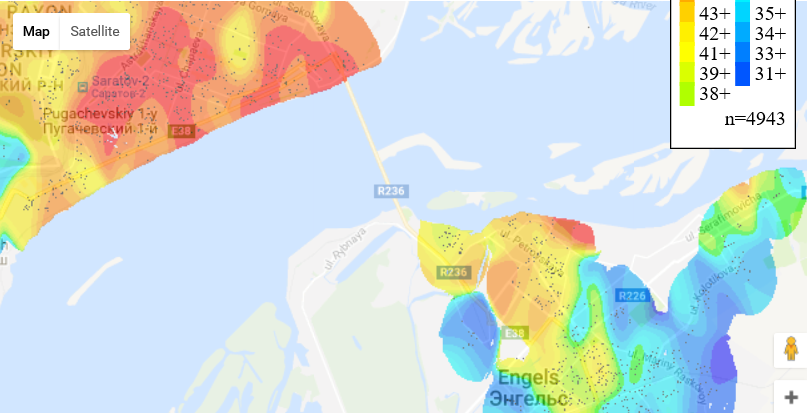
That's it, we will consider the first stage of the quest completed, fill the results on GitHub with a folder shared for hosting, and we can brag to the IT community.
So, what is next?
And then a lot of questions arise, for which I do not yet know a clear answer:
- How correctly does the calculation algorithm work here compared to other spatial interpolations methods
- What other factors, in addition to the location of the property, it makes sense to consider when calculating and how to enter into the calculation model
- Is it possible to make a constant update of the data in the database and build on this some sort of real estate appraisal system. (If representatives of Avito read me on this site, I would like to hear comments)
Well ... thanks to everyone who read to this place. I was interested in solving a practical problem, which turned out to be “rather challenging for me,” I hope you were interested in reading about my experience.