March 19, 2017 at 11:27
Again about Monty Hall or statistics as a collective intuition
Using the Monty Hall paradox as an example, let us see what is common between statistics and intuition, and how data visualization can help make the right decision based on a statistical assessment.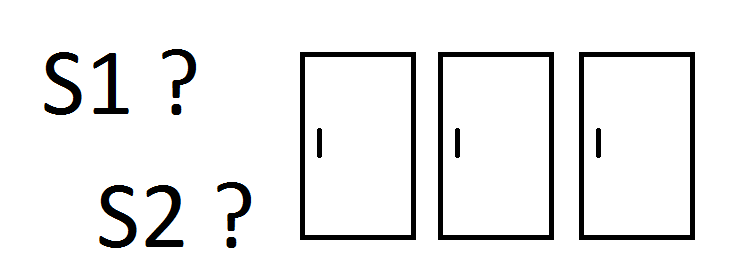
Monty Hall's paradox complexity
The Monty Hall Paradox got its name from the host of the television show "Let's Make a Deal". Game situation:
The player has three doors, one of which has a prize. The player selects one of them without opening. After this, the presenter opens one of the two remaining doors. The host knows which prize is behind the door, and always opens the door for which there is no prize. Next, the player is invited to change the originally selected door to another, which remains closed. Question: Does the player’s chances increase when changing the selected door?
The paradox is that intuitively it seems that changing the door gives nothing. The prize is either behind one door or behind another. The situation is symmetrical, and the probabilities are the same. However, probability theory shows that changing the door doubles the odds of winning.
To arrive at a statistically correct decision, a player must:
- Mentally switch from choosing one of the two doors to choosing one of two strategies: "stay" (leave the originally selected door) and "switch" (change the door to another).
- Build a statistical model of the game situation and evaluate both strategies.
- Based on statistical estimates, abandon the originally selected door.
The first step is key. If you stay at the door selection level, then nothing will work, because the prize, one way or another, is behind one of the two doors. But they look the same - the situation is as if symmetrical. You can not change the door and win, you can change the door and lose. Perhaps changing the door increases the chances of success, but does not guarantee it. In taking the first step, the player should not confuse “increased chances” and “guaranteed winnings”.
The second step is even more difficult: to build and apply a statistical model of the problem. The chain of reasoning may be this.
First, the player makes a choice of one of three doors. According to the condition, the prize is placed for any of them with the same probability. In the first step, the probability of choosing a prize is 1/3. The figure below shows the decision tree after the initial player selection. The door behind which the prize is painted over:

Next, the leader opens one of the doors not selected by the player. It seems to the player that the facilitator chooses the door to open. However, this is not always the case. The behavior of the host is determined by the player’s first choice:
- If the player immediately chose the door with a prize, then the leader can choose either of two closed ones. There is no prize for any of them.
- If a player chooses a door without a prize, the leader always opens one door. The door behind which the prize, the presenter can not open according to the conditions of the game.
The probability that the prize behind the door that the presenter left closed is calculated using the conditional probability formula. And these probabilities differ for different outcomes, as the decision tree shows. Closed doors, behind which the prize is painted over:

The player summarizes the probabilities for each strategy and gets their statistical score. The figure shows that the probability of winning when changing the door (strategy "switch") is two times higher:

After the strategies are evaluated, the player must abandon the initial choice. This is difficult in itself. The player will be keen to keep the original choice, as it is easier. For example, a potential buyer is much more likely to not turn off the included service by default, rather than turn it on. In the general case, this leads to a systematic deviation of player behavior from rational one.
Difficulties in applying statistical thinking
The problems associated with the application of statistical thinking and rational thinking are generally considered in David Kahneman's book Think slowly, solve fast. Studies by Kahneman and his colleagues showed that a person is prone to make mistakes in situations where even simple mathematical calculations need to be carried out, not to mention probability estimates.
Kahnemann introduces the concept of two systems. System 1 is fast, intuitive, heuristic thinking. A person uses it, for example, to determine mood by facial expression or when assessing a traffic situation when a car is driving. System 1 is an automatic, almost instantaneous reaction, and works in most everyday situations.
System 2 - "slow", rational, mathematical and statistical thinking. This system is connected with effort. A person must realize that the automatic solution is wrong, think and carry out calculations.
The key problem is that in a situation where you need to think, a person relies on the automatic solution offered by system 1. And this system draws conclusions, primarily on the basis of the similarity of options. In the Monty Hall paradox, after the presenter opened one of the doors, the two remaining look the same, and the presenter’s conditional behavior is carefully masked. The situation seems symmetrical, and the probabilities are the same. System 1 has nothing to catch on to notice probabilistic asymmetry. And system 2 has no time to connect. Moreover, the leader in various ways tries to confuse the player.
System 1 trains on repeated repetition of situations, bringing the choice to automatism (face recognition, car driving). A person sees a similar situation, something that is familiar to him, and makes a choice that was previously successful in similar situations.
System 2 implies that a person begins to analyze the situation in order to make a decision. In the case of statistical problems, the correct answer is not obvious. To come to it, a person must analyze the data, make calculations and choose the highest values of statistical indicators.
Common between intuition and statistics
The main idea of David Kahneman is that system 1 (intuitive) and system 2 (rational) are different. In the general case, it is, however, with respect to statistics, there is a similarity between them.
Suppose all the participants in the Monty Hall show come together to discuss the results of participating in the show. The participants were divided into two groups: those who remained with the originally selected door and those who changed the door. According to statistics, counting participants and their results will show that those participants who changed the door won more often . If there are a lot of participants in both groups, then the share of winners in the group who changed the door will be about two times higher than in the other.
A sufficient number of participants, at which a statistical regularity will be visible, is determined by the law of large numbers. The more players take part in the meeting, the more the results of calculating their successes and failures will correspond to theoretical ones. In other words, statistics begin to work when the game has been repeated by different participants many times. If such a community of players existed, then in time they would come to the right strategy.
Thus, in statistical calculations, system 2 is based on the law of large numbers - a sufficiently large (ideally infinite) number of tests. But system 1 also has a large number of tests that make the right decisions. Repeated repetition brings a person’s ability to automatism.
Rules for two systems:
- System 1: it was right for me many times in similar cases, so it will be true now.
- System 2: this was correct for many other people in similar cases, so it will be true now.
We can say that the calculation of probability reflects the collective experience of all real and possible participants in the Monty Hall game. For situations of individual choice of strategies, statistics act as collective intuition. It remains to make the statistics visual with a suitable visualization.
Chart for visualization of theoretical and frequency probability
Using the Monty Hall paradox as an example, we modeled a person’s choice of the right strategy using statistical calculations. In general:
- There can be more than two strategies.
- Theoretical calculations of probability may be absent or require verification. Then you have to test all the strategies and determine the frequency probability for each.
- Outwardly, the various options may not differ in any way (the doors in the Monty Hall game look the same - visual symmetry).
If you set the task to help the player win, and not confuse him, like on a show, then in the data visualization or user interface you can supplement the “doors” between which the “player” chooses with diagrams and scales. In such a diagram, the scale sets the gradation of the change in value, and a column of the actual value is superimposed on the scale by analogy with a thermometer.
On the chart, it is convenient to combine the theoretical, expected number of wins (highlighted in gray) and the actual after all previous games (narrow black bar). The actual value changes after each decision made by choosing one of two strategies and is maintained throughout the series of games:
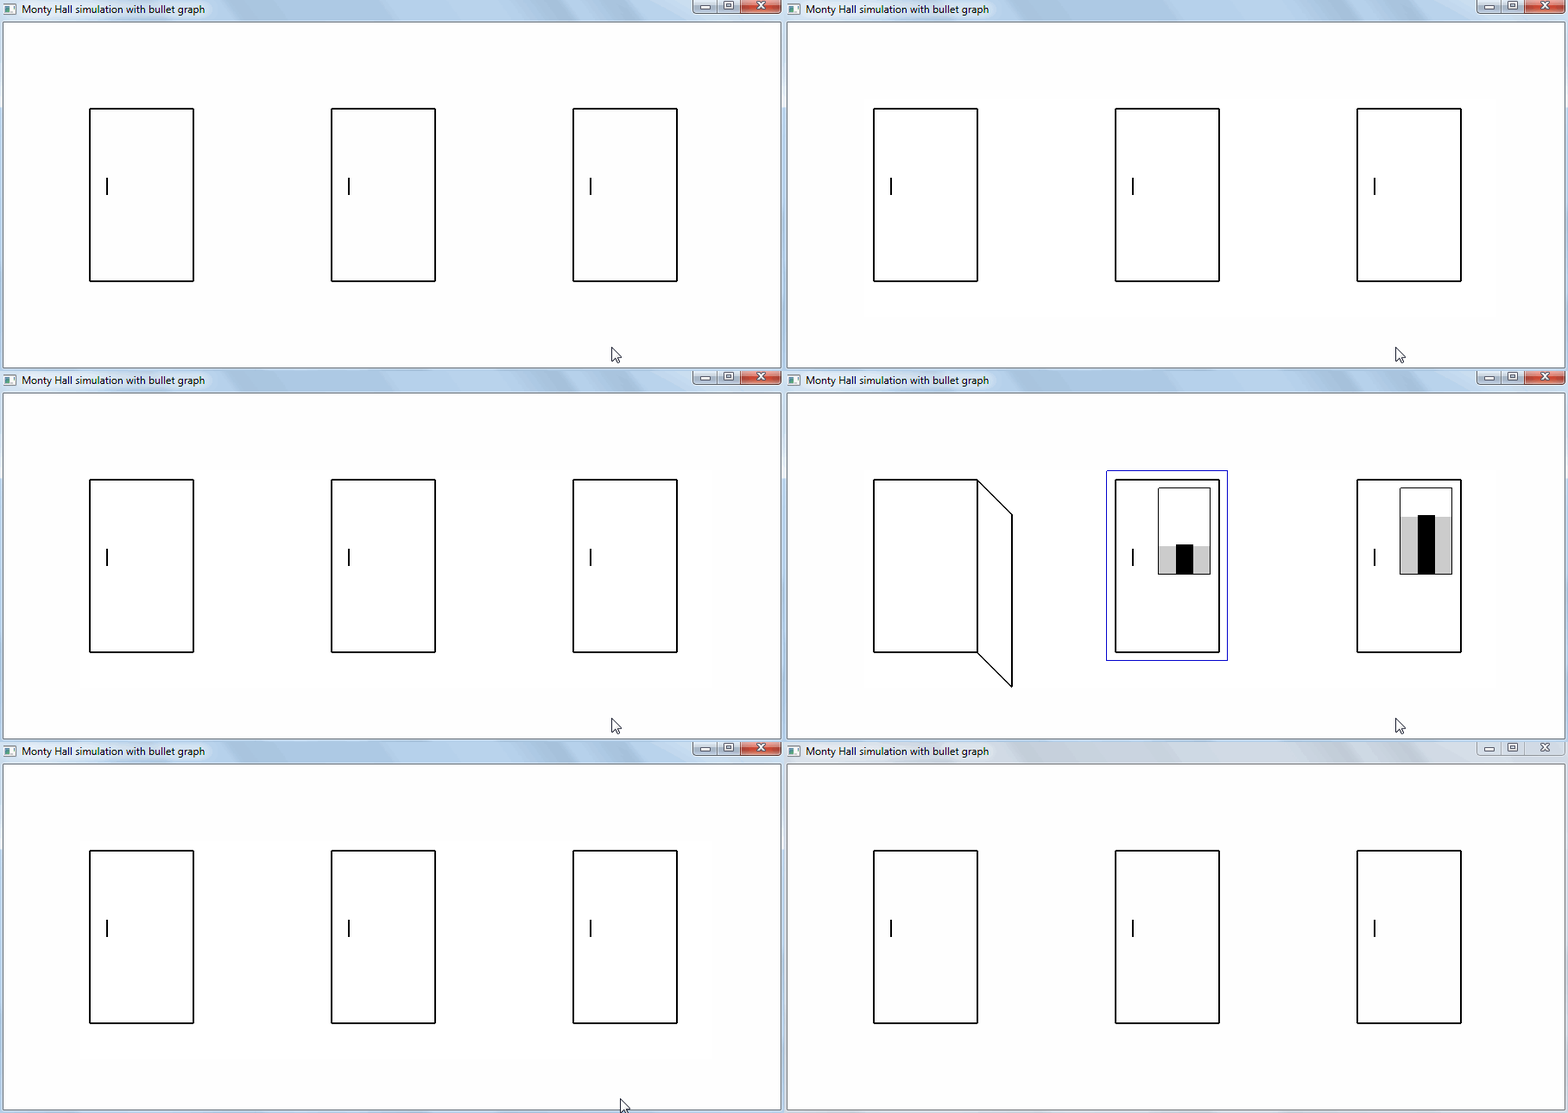
Thus, a suitable visualization of statistics helps a person choose the right strategy. For example, in an interface similar to a prototype, an interface element corresponding to a strategy can be marked with a statistical widget similar to a scale chart. Displaying evidence is useful if the user chooses between approximately equally successful strategies. It allows him to quickly conclude:
More likely to succeed
conclusions
- A person is inclined to ignore or incorrectly use probability calculations and statistics when choosing a strategy.
- Statistics can be seen as collective intuition - multiple successful outcomes of other people's trials.
- If the statistics are correctly visualized, then this will increase the efficiency of human choice of strategy.