February 2, 2017 at 10:49
A fast, convenient and cross-platform profiler of C ++ code
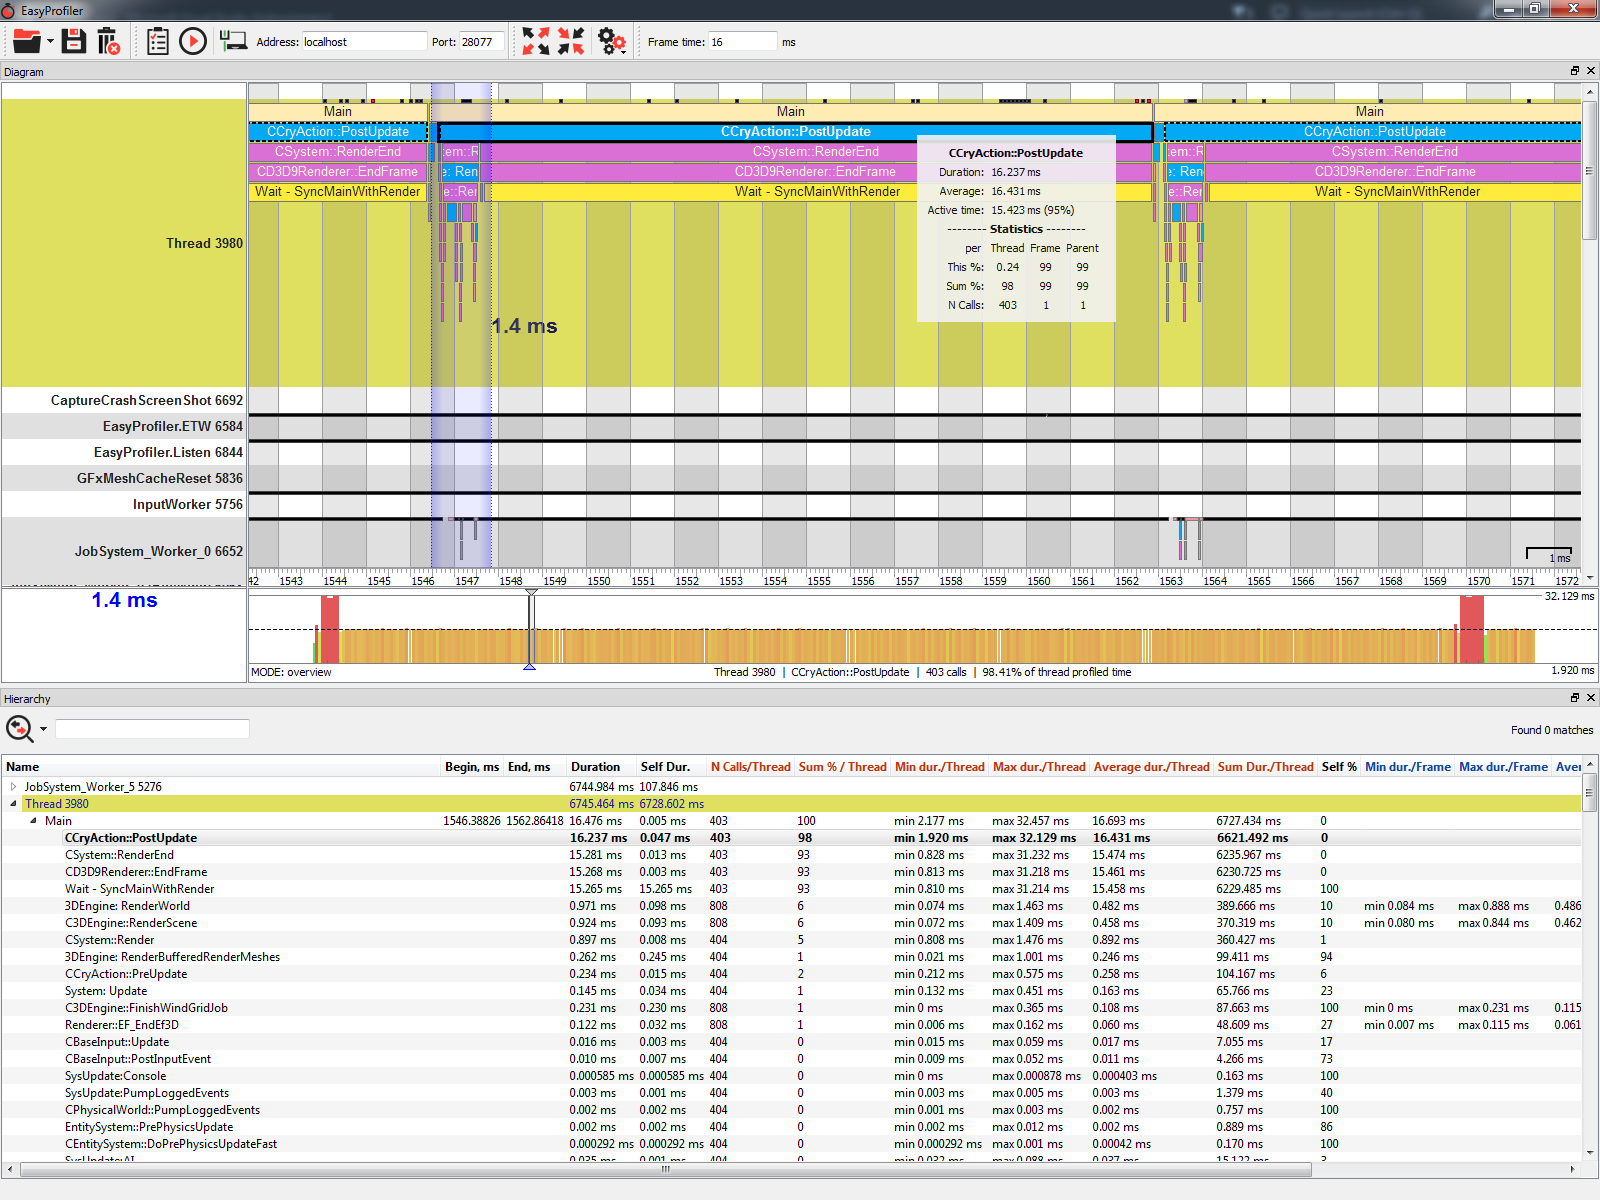
Hello. A few months ago, together with victorzs, we decided to make a simple and convenient profiler of c ++ code (it means profiling the execution time of code sections, functions). Screenshot of profiling an example from the CryEngine SDK
Existing solutions did not suit us for a number of reasons. We needed a quality profiler that could do the following:
As a result of careful study, a profiler was born who can do all of the above, and even more!
If you want to know how long your code works, and have objective evidence at the same time, I ask for a cut, where I will show you how to use the profiler.
Added blocks in the statistics collection mode take as little time as possible (as we have achieved this in further articles on technical implementation). On a machine with a Core i7-5930K 3.5GHz processor, 16 Gb RAM, Win7 Pro in an application with 12 threads, the average “cost” of one block is about 10-15 nanoseconds! A similar result was achieved on Fedora 22 . Here is a graph of measurements (along the x-axis - the number of blocks, along y - nanoseconds per block):
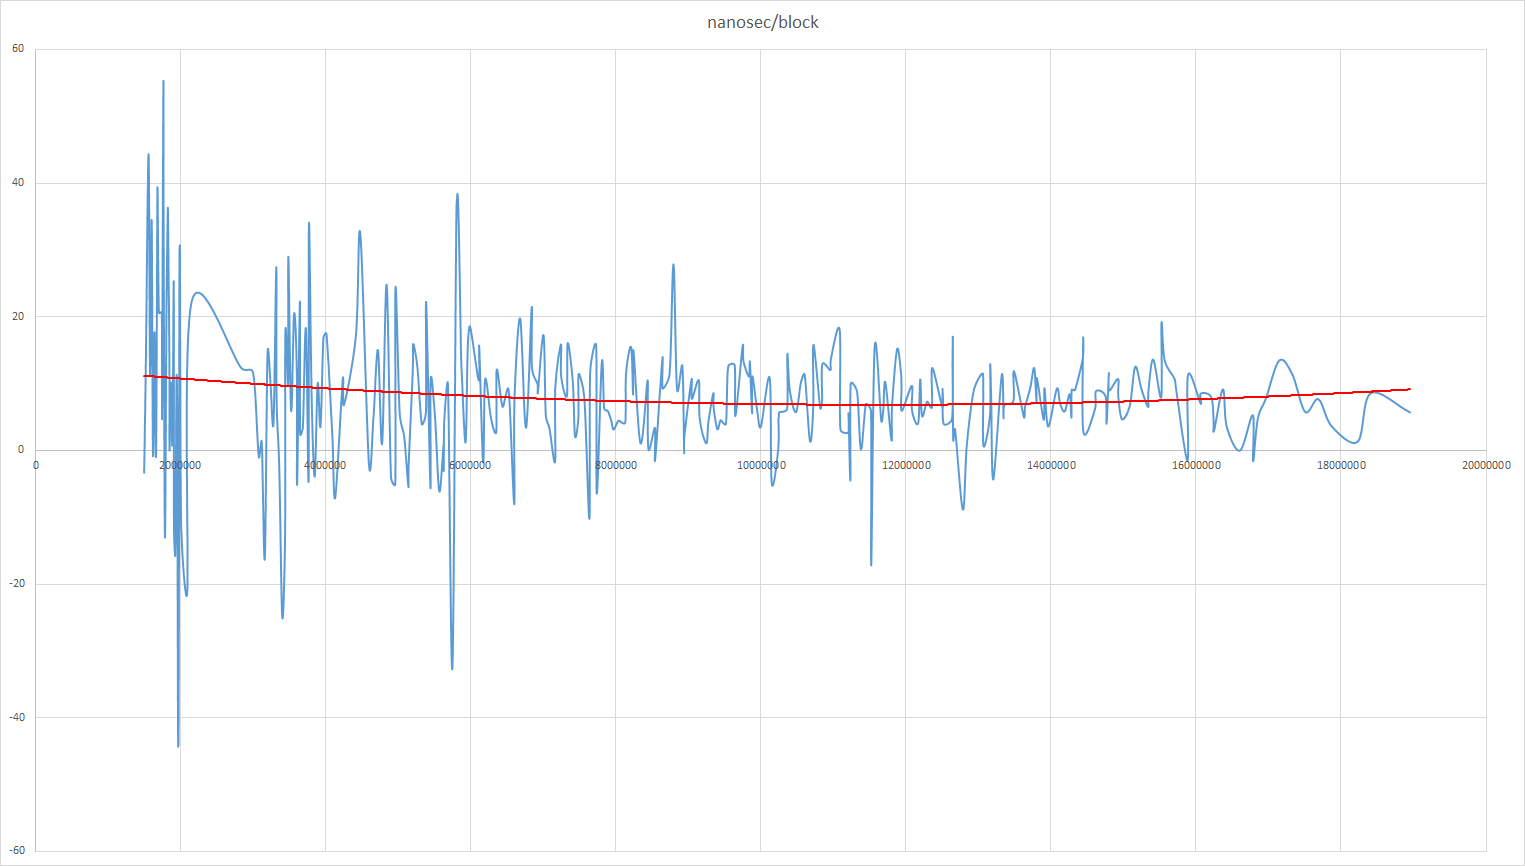
In addition, it is clear that the dependence is linear - the number of blocks does not affect the time response.
Obtaining and analysis of the results takes place in a program with the uncomplicated name profiler_gui (in the bin directory ). The profiler can be initialized in two ways:
To get information about context switching in Windows, you need to run a profiled application with administrator rights. In linux, the situation is a bit more complicated: you need to run a script in the directory
Where
To demonstrate the capabilities of the results analyzer, we will profile a simple example from CryEngine. There are several profilers in CryEngine itself, and there are macros for organizing them, into which it is easy to embed any profiler.
After compilation, run a test example, run the profiler_gui program , connect to the application (icon:, next to it, you can enter the ip address or host name on which the profile application is running). After a successful connection (the icon turns a little green:),
  you can start the profiling session. After clicking on the button
  , statistics will be collected in the profiled application. To end the profiling session, close the window that appears.
The screenshot shows a general view of the program with the result
In the upper part of the window running flows and saved blocks are presented, the duration of which can be estimated on a horizontal scale. Vertically within each block its hierarchy is shown.
In the central part, a time diagram of either a stream or a selected block is presented. Here, the execution time of the block is estimated vertically, horizontally - the execution time of the programs, i.e. you can watch bursts of duration of blocks and, if necessary, evaluate the problem in more detail.
At the bottom there is a block execution tree for the selected site with detailed statistics. Here you can sort by duration, search for the longest blocks, estimate the number of calls of a block. The selection of the site is carried out at the top of the screen by holding the right mouse button and selecting the necessary piece.
Brief statistics on the block can be viewed at the top of the screen. After hovering over the block, a pop-up window appears with a brief summary:

In this summary, information on the total duration of the total of all blocks of this type and how much this sum is percent of the frame (the highest parent for this block), the total time of the stream and its parent. In many cases, this is comprehensive information.
Another very convenient feature is the dynamic on / off blocks. To do this, open the dialog (icon ) and enable or disable the desired blocks in the window that appears. The next profiling session will take these settings into account.
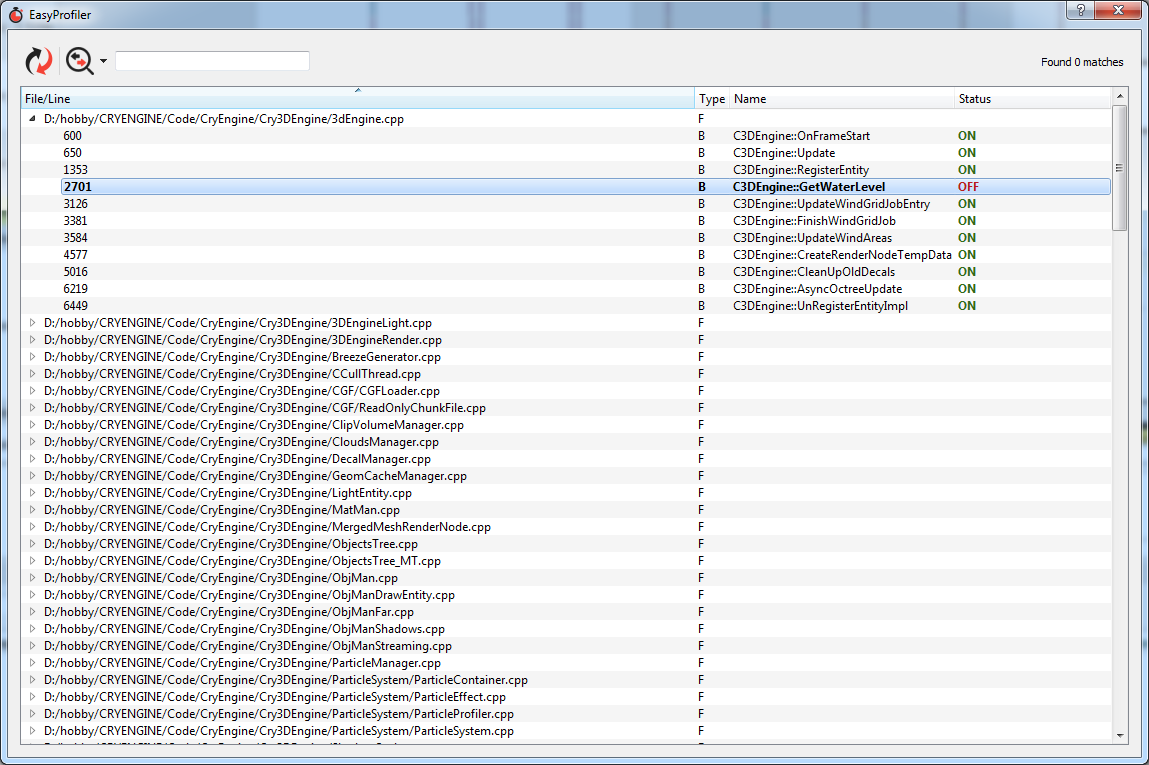
We turn off the collection of information for the function.
So, the advantages of the profiler:
- Speed of operation
- Minimum memory costs
- Cross
- platform - Convenient and functional graphical representation
The only limitation of use is the need to build a profiled application by a compiler that supports the c ++ 11 standard .
This profiler will be useful both for developers of game engines (both AI and 3D), and for those who use ready-made engines, and for everyone who cares about the performance of their application. We use this profiler as part of the development of a visualization system for aviation and tactical simulators.
The license is either Apache 2.0 or GPL v.3 - for both the libin and gui. Use any of these licenses.
Thanks for attention! We are looking forward to feedback (questions, suggestions,bugs, stars on github, pull requests). During the development process, some non-standard tasks were solved, which I would like to write separate articles about.
- Profile selected code sections
- Work on multiple platforms
- Consider context switching
- Require minimal additional memory overhead during profiling
- Do not impose additional time limits during application execution. Agree, if the profiler will work longer than the profiled piece of code, you can draw incorrect conclusions.
As a result of careful study, a profiler was born who can do all of the above, and even more!
If you want to know how long your code works, and have objective evidence at the same time, I ask for a cut, where I will show you how to use the profiler.
Code Integration
- Download and unpack the latest release from here: https://github.com/yse/easy_profiler/releases
- If you use
CMaketo build, then- Define a variable
CMAKE_PREFIX_PATHthat points to the directory/cmake/easy_profiler - Use
find_package(easy_profiler REQUIRED)andtarget_link_libraries(... easy_profiler)
Otherwise:- We write to the compiler a directory for searching header files:
/include - We set the linker to the linker to search for libraries:
/bin
- Define a variable
- Add definition to the compiler:
BUILD_WITH_EASY_PROFILER - We add blocks to those places in the code that we want to measure. For instance:
#includevoid foo() { EASY_FUNCTION(profiler::colors::Magenta);// Начать блок с именем, совпадающим с именем функции EASY_BLOCK("Calculating sum");// Блок с цветом по умолчанию int sum = 0; for (int i = 0; i < 10; ++i) { EASY_BLOCK("Addition", profiler::colors::Red);// Блок будет закончен при выходе из области видимости sum += i; } EASY_END_BLOCK; // Закончить блок (в данном случае блок с именем "Calculating sum" EASY_BLOCK("Calculating multiplication", profiler::colors::Blue500); int mul = 1; for (int i = 1; i < 11; ++i) mul *= i; //на выходе из функции автоматически будут закрыты все открытые и незавершённые в этой функции блоки. В данном примере, автоматически закроются блоки с именами "Calculating multiplication" и "foo" } - Do not forget to put the easy_profiler library ( * .dll or * .so ) next to the assembled application . Or we prescribe in the system variable
PATH(in Linux enough toLD_LIBRARY_PATH) the directory/bin
Added blocks in the statistics collection mode take as little time as possible (as we have achieved this in further articles on technical implementation). On a machine with a Core i7-5930K 3.5GHz processor, 16 Gb RAM, Win7 Pro in an application with 12 threads, the average “cost” of one block is about 10-15 nanoseconds! A similar result was achieved on Fedora 22 . Here is a graph of measurements (along the x-axis - the number of blocks, along y - nanoseconds per block):
In addition, it is clear that the dependence is linear - the number of blocks does not affect the time response.
Profiling
Obtaining and analysis of the results takes place in a program with the uncomplicated name profiler_gui (in the bin directory ). The profiler can be initialized in two ways:
- A socket connection by the profiler_gui application . To do this, you must initialize listening on the socket in the profiled application. This is done simply:
profiler::startListen();
This function starts a thread that listens on the port28077(the port can be changed by a parameter in the functionprofiler::startListen(portNumber)) of the control command. You can stop listening by calling the function (although this is not necessary at all):profiler::stopListen();
The collection of blocks begins after connecting profiler_gui to the profiled application and clicking on the “Capture” button on the tool bar. After profiling is stopped (click on “Stop” ), the collected information is transferred via a socket from the profiled application to profiler_gui and is immediately saved to disk in the easy_profiler.cache file . You can also save all the information in a separate file (it just moves the easy_profiler.cache file ). - Saving the result to a file. To do this, you must first initialize the profiler, and then save the file at the right time. This is done as follows:
int main()
{
    EASY_PROFILER_ENABLE;
    /* do work*/
    profiler::dumpBlocksToFile("test_profile.prof");
}
After that, saved files can be opened in profiler_gui
To get information about context switching in Windows, you need to run a profiled application with administrator rights. In linux, the situation is a bit more complicated: you need to run a script in the directory
scripts/context_switch_logger.stpwith parameters with superuser privileges . This script is interpreted by systemtap . In Fedora, you need to run the command:#stap -o /tmp/cs_profiling_info.log scripts/context_switch_logger.stp name APPLICATION_NAME
Where
APPLICATION_NAMEis the name of the application being profiled, /tmp/cs_profiling_info.logis the file where information about context switching is recorded. Superuser privileges are necessary because context switching information can only be obtained in kernel space.Results Analysis
To demonstrate the capabilities of the results analyzer, we will profile a simple example from CryEngine. There are several profilers in CryEngine itself, and there are macros for organizing them, into which it is easy to embed any profiler.
After compilation, run a test example, run the profiler_gui program , connect to the application (icon:,
next to it, you can enter the ip address or host name on which the profile application is running). After a successful connection (the icon turns a little green:), you can start the profiling session. After clicking on the button , statistics will be collected in the profiled application. To end the profiling session, close the window that appears. The screenshot shows a general view of the program with the result
In the upper part of the window running flows and saved blocks are presented, the duration of which can be estimated on a horizontal scale. Vertically within each block its hierarchy is shown.
In the central part, a time diagram of either a stream or a selected block is presented. Here, the execution time of the block is estimated vertically, horizontally - the execution time of the programs, i.e. you can watch bursts of duration of blocks and, if necessary, evaluate the problem in more detail.
At the bottom there is a block execution tree for the selected site with detailed statistics. Here you can sort by duration, search for the longest blocks, estimate the number of calls of a block. The selection of the site is carried out at the top of the screen by holding the right mouse button and selecting the necessary piece.
Brief statistics on the block can be viewed at the top of the screen. After hovering over the block, a pop-up window appears with a brief summary:
In this summary, information on the total duration of the total of all blocks of this type and how much this sum is percent of the frame (the highest parent for this block), the total time of the stream and its parent. In many cases, this is comprehensive information.
Another very convenient feature is the dynamic on / off blocks. To do this, open the dialog (icon
) and enable or disable the desired blocks in the window that appears. The next profiling session will take these settings into account. We turn off the collection of information for the function.
C3DEngine::GetWaterLevelSo, the advantages of the profiler:
- Speed of operation
- Minimum memory costs
- Cross
- platform - Convenient and functional graphical representation
The only limitation of use is the need to build a profiled application by a compiler that supports the c ++ 11 standard .
This profiler will be useful both for developers of game engines (both AI and 3D), and for those who use ready-made engines, and for everyone who cares about the performance of their application. We use this profiler as part of the development of a visualization system for aviation and tactical simulators.
The license is either Apache 2.0 or GPL v.3 - for both the libin and gui. Use any of these licenses.
Thanks for attention! We are looking forward to feedback (questions, suggestions,