Twelve Useful Chrome DevTools Tips
- Transfer
In this article, we’ll cover some of the features of the Chrome Developer Tools. Specifically, I use Chrome Canary and I advise you. And not because it is a reference to the little cute birds who sacrificed their lives so that we can get fresh coal.
Some of the features of DevTools you may not have known. I will be very happy if at least one of them you find useful to yourself.
(The article below contains animated GIFs that begin to annoy after the first cycle. Therefore, I recommend opening the dev tools and removing the DOM nodes that are responsible for the images.)
So, let's go:
I learned about this feature from the comments, and I find it useful enough to be described at the beginning. Sometimes you need to copy the contents of a variable to the clipboard. For example html code or json object. To do this, you can use the copy function.
Now the text representation of the variable is copied to the clipboard.
The animations are beautiful. They delight users, and more importantly, they delight me. The animation menu in DevTools will allow you to slow down all the animations on the page by 25% or 10% (see the world through the eyes of a rabbit), or move a specific animation.
When you are in device emulation mode, you can enable the device frame and when you click on capture screenshot you will get a screenshot along with the device frame.
The resulting image will look something like this:

By typing $ 0 in the console, you will get a link to the current node selected in the DOM element panel.
This is a real element reference, and as an example, you can do $ 0.classList.add ('touch-of') or $ 0.getBoundingClientRect () to find out the size, or if you use jQuery on the page, you can print something like this $ ($ 0) .data () to get the item data.
By default, Chrome will simply show you the object as a DOM element. If you want to see the element as a JavaScript object, you can print console.dir ($ 0)
Here is the difference:
If you are cool enough and using React and React dev tools, then $ r will show you a link to the react component. To see the proprs of a component, simply enter $ r.props .

Bonus: you can enter the item ID in the console and also get a link to the item, although it is not a real global variable.
This is not exactly DevTools Tip, but I'm sure you will love them. With the advent of arrow functions, it has become convenient to use them on the same line. For example, the expression performance.getEntries (). Filter (entry => entry.name.includes ('static')) will output some information about my queries from domains containing “static” in the name.
Of course, if you need to write more than one line, you can press shift + enter to go to a new line without executing the code.
The search field in the toolbar searches not only for text (this is a turn, what else is it looking for ?!), but also matching selectors. This can be especially convenient for non-web developers who need to select selectors, for example, for autotests.
Here I am looking for matches on .section-inner p: nth-of-type (2)
When you experiment with colors, you can use the eyedropper to select any item on the page or select from a palette of colors that are already in use on the page. Or choose one of the material design colors.
Sometimes it’s very difficult to say which font was actually rendered. At the bottom of the Computed toolbar tab, you can see which font is being used, even if its name is not in the font-family list.
If you have a fixed-width menu and want to know how long the text will fit there and see word wraps. Switch the document to design mode! (document.designMode = 'on')
After that, you can edit all elements with text content.
If you are the person who decided to use on / off instead of true / false , I would like to talk to you in my office.
A very good performance tuning tool is the filmstrip mode on the Network tab. It will allow you to focus on the visual component and not on obscure events like domContentLoaded.
Or you can just ironically see how fonts load on the Adobe page.
I look at it every time I feel sad. My favorite part is when all the text disappears.
Whatever performance work you do, you need to know what comes to your browser. If you advertise on a site, then a lot of things come. To shorten the list, you can filter resources by type (hold cmd / ctrl for multi-selection) and also by domain.
Because a dark topic.
You can enable it at the beginning of the settings page
I love snippets. (it’s a pity that they do not synchronize between browsers with my other Chrome settings).
Cool that they are executed in the context of the page. Regarding access to the DOM, relative links, cookies, and other things, your snippets will have the same behavior as regular code.
...
You can learn more information about the features of the developer panel by visiting the documentation . Take a little time to study it in order to increase the efficiency of your work. You can share your useful finds in the comments.
...
And one more thing. When installing Chrome Canary, log in and sync your Google account, but uncheck “Extensions” in the advanced sync settings. So you get your story, bookmarks and all other things, except for extensions that clog your workspace with your code.

Some of the features of DevTools you may not have known. I will be very happy if at least one of them you find useful to yourself.
(The article below contains animated GIFs that begin to annoy after the first cycle. Therefore, I recommend opening the dev tools and removing the DOM nodes that are responsible for the images.)
So, let's go:
Copy the variable to the clipboard.
I learned about this feature from the comments, and I find it useful enough to be described at the beginning. Sometimes you need to copy the contents of a variable to the clipboard. For example html code or json object. To do this, you can use the copy function.
copy (someVariable)Now the text representation of the variable is copied to the clipboard.
1. Inspect the animation
The animations are beautiful. They delight users, and more importantly, they delight me. The animation menu in DevTools will allow you to slow down all the animations on the page by 25% or 10% (see the world through the eyes of a rabbit), or move a specific animation.
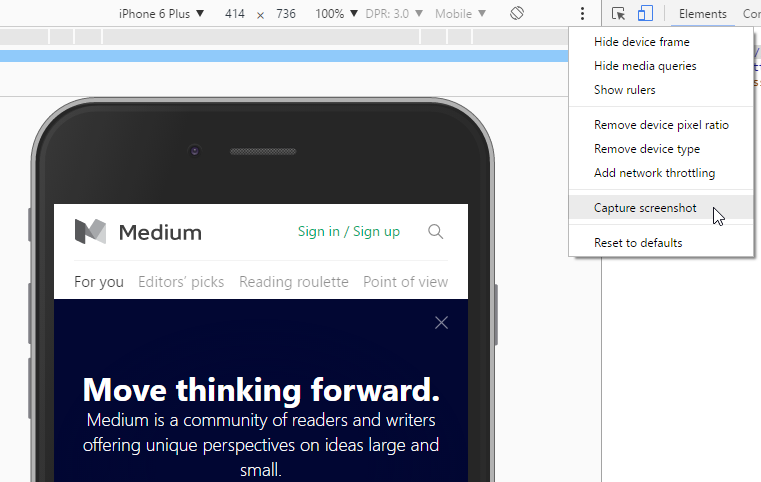
2. Convenient screenshots
When you are in device emulation mode, you can enable the device frame and when you click on capture screenshot you will get a screenshot along with the device frame.
The resulting image will look something like this:
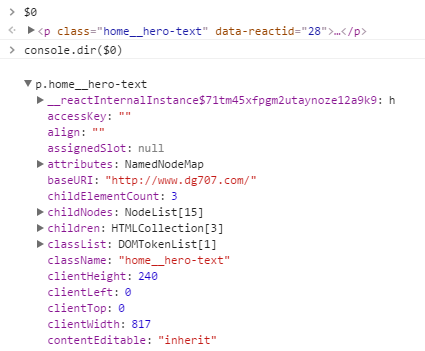
3. $ 0 in the console
By typing $ 0 in the console, you will get a link to the current node selected in the DOM element panel.
This is a real element reference, and as an example, you can do $ 0.classList.add ('touch-of') or $ 0.getBoundingClientRect () to find out the size, or if you use jQuery on the page, you can print something like this $ ($ 0) .data () to get the item data.
By default, Chrome will simply show you the object as a DOM element. If you want to see the element as a JavaScript object, you can print console.dir ($ 0)
Here is the difference:
If you are cool enough and using React and React dev tools, then $ r will show you a link to the react component. To see the proprs of a component, simply enter $ r.props .
Bonus: you can enter the item ID in the console and also get a link to the item, although it is not a real global variable.
4. Arrow functions in the console
This is not exactly DevTools Tip, but I'm sure you will love them. With the advent of arrow functions, it has become convenient to use them on the same line. For example, the expression performance.getEntries (). Filter (entry => entry.name.includes ('static')) will output some information about my queries from domains containing “static” in the name.
Of course, if you need to write more than one line, you can press shift + enter to go to a new line without executing the code.
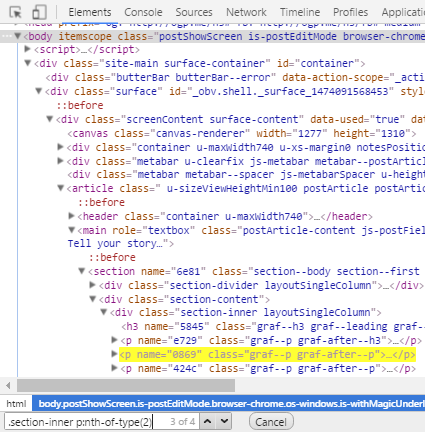
5. Search by selector
The search field in the toolbar searches not only for text (this is a turn, what else is it looking for ?!), but also matching selectors. This can be especially convenient for non-web developers who need to select selectors, for example, for autotests.
Here I am looking for matches on .section-inner p: nth-of-type (2)
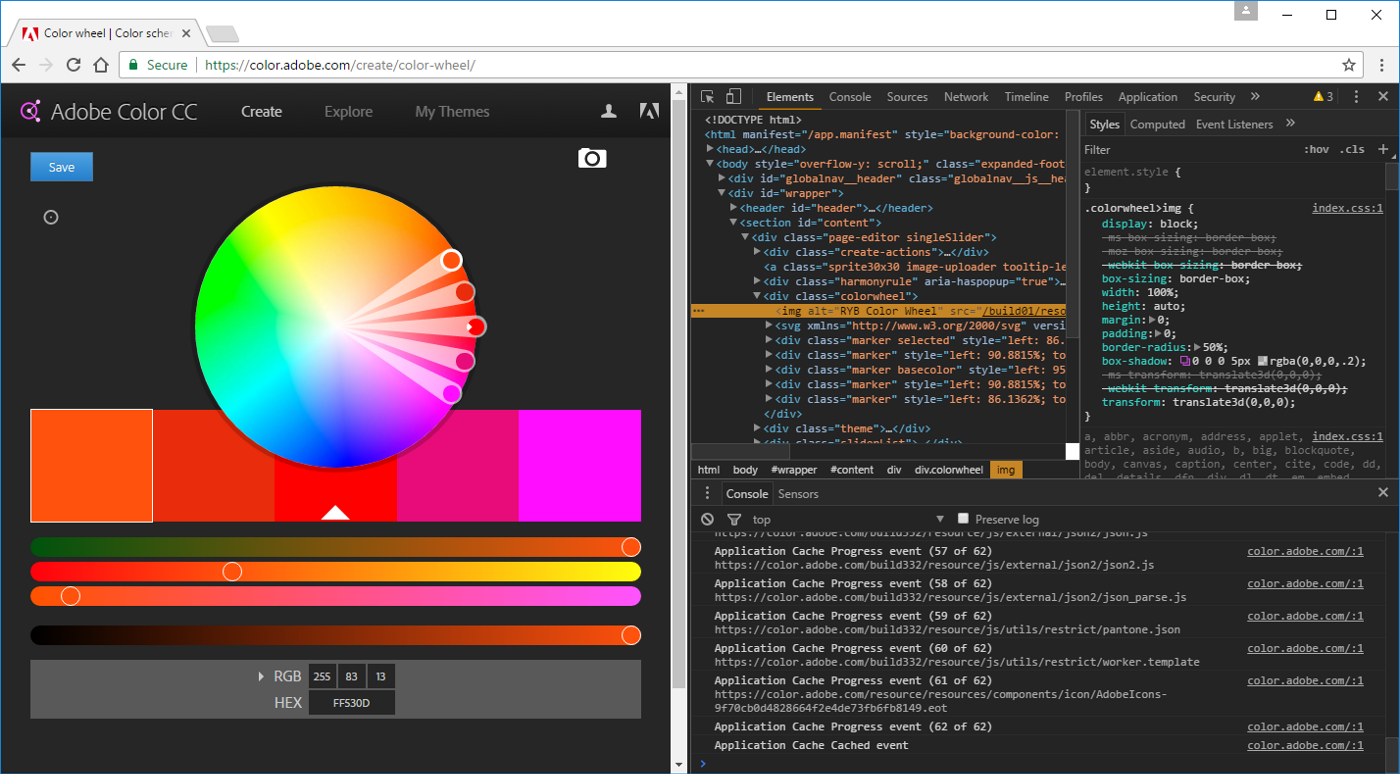
6. Experimenting with colors
When you experiment with colors, you can use the eyedropper to select any item on the page or select from a palette of colors that are already in use on the page. Or choose one of the material design colors.
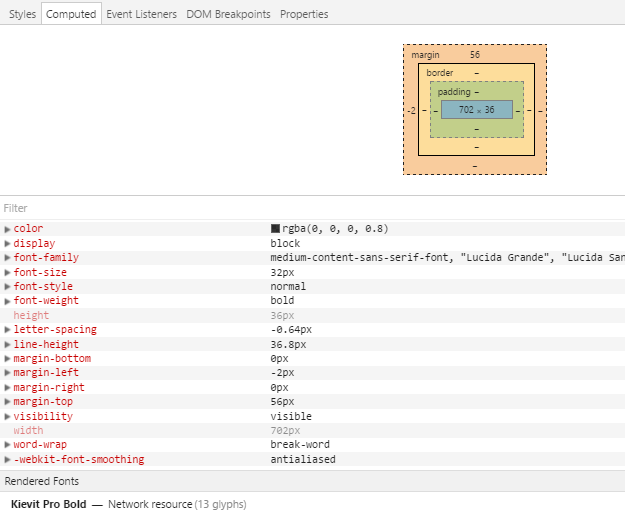
7. View rendered fonts
Sometimes it’s very difficult to say which font was actually rendered. At the bottom of the Computed toolbar tab, you can see which font is being used, even if its name is not in the font-family list.
8. We edit any text on the page
If you have a fixed-width menu and want to know how long the text will fit there and see word wraps. Switch the document to design mode! (document.designMode = 'on')
After that, you can edit all elements with text content.
If you are the person who decided to use on / off instead of true / false , I would like to talk to you in my office.
9. Filmstrip
A very good performance tuning tool is the filmstrip mode on the Network tab. It will allow you to focus on the visual component and not on obscure events like domContentLoaded.
Or you can just ironically see how fonts load on the Adobe page.
I look at it every time I feel sad. My favorite part is when all the text disappears.
10. Filters on the Network tab
Whatever performance work you do, you need to know what comes to your browser. If you advertise on a site, then a lot of things come. To shorten the list, you can filter resources by type (hold cmd / ctrl for multi-selection) and also by domain.
11. Dark theme
Because a dark topic.
You can enable it at the beginning of the settings page
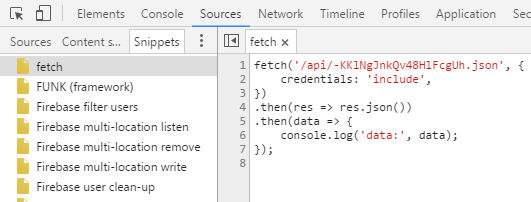
12. Chrome snippets
I love snippets. (it’s a pity that they do not synchronize between browsers with my other Chrome settings).
Cool that they are executed in the context of the page. Regarding access to the DOM, relative links, cookies, and other things, your snippets will have the same behavior as regular code.
...
the end
You can learn more information about the features of the developer panel by visiting the documentation . Take a little time to study it in order to increase the efficiency of your work. You can share your useful finds in the comments.
...
And one more thing. When installing Chrome Canary, log in and sync your Google account, but uncheck “Extensions” in the advanced sync settings. So you get your story, bookmarks and all other things, except for extensions that clog your workspace with your code.