August 29, 2016 at 14:46
Visual monitoring of server infrastructure based on Nagios + Grafana
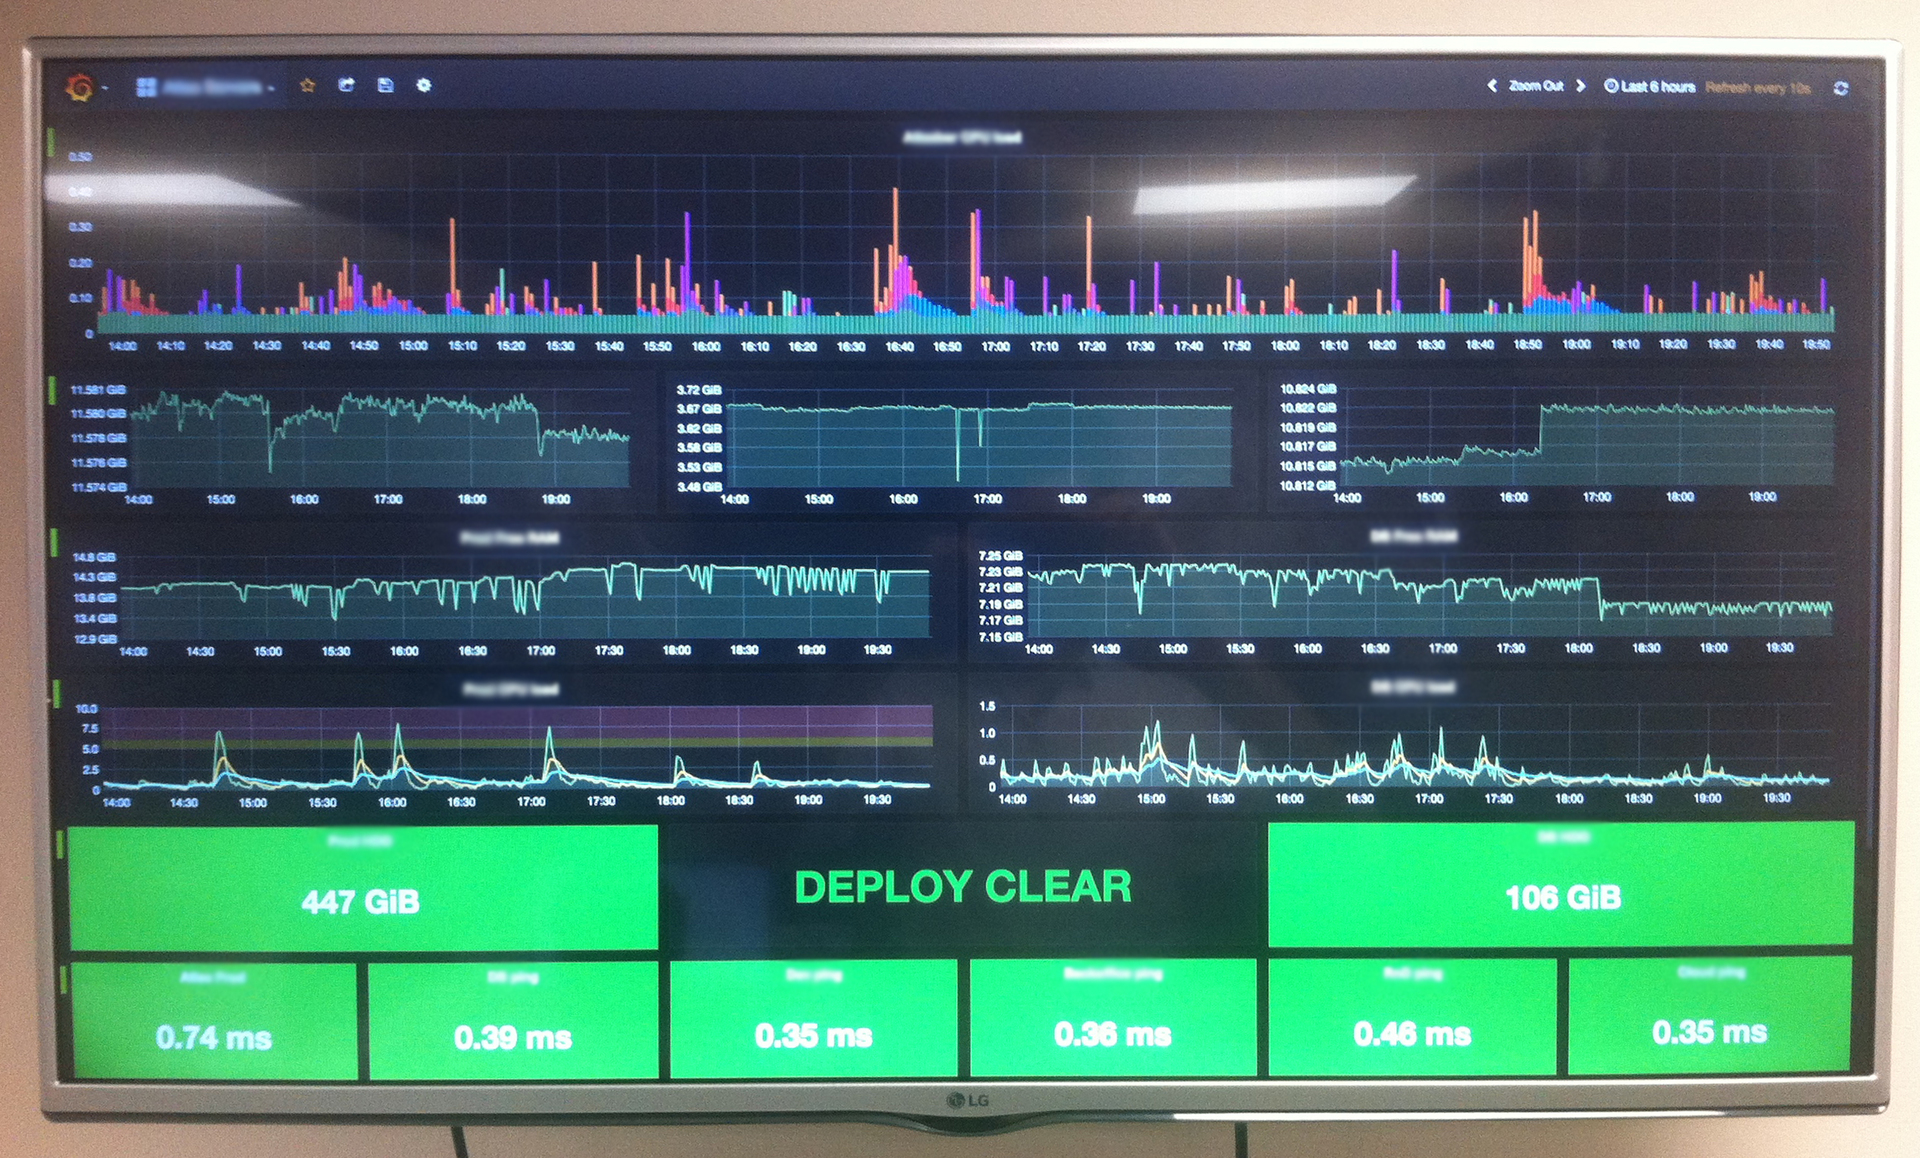
We in Atlas love when everything is under control. This also applies to the entire server infrastructure, which, over the years, has turned into a living organism from numerous virtual machines, services, and services. There was a need to observe the vital aspects of the IT component of our activities: monitor the battle server, track changes in system resources on database virtual machines, monitor the progress of business processes, etc. The question arose - how to achieve this and most importantly with what tools? They began to look for some ready-made solutions. We tried a bunch of paid / free services that supposedly would provide us with the "most valuable" information about the state of our system. But, in the end, it all came down to some strange charts, diagrams and numbers, which, in fact, were of no value to us.
So we came to understand that we need to collect something ourselves. We decided to take as the basis the most flexible and advanced system that you can configure to monitor anything and whatever - Nagios. Set up, set, works - cool! It’s a pity that the interface of this miracle was stuck somewhere in the mid-90s, but we wanted the visual component to be at the same level.
A short search showed that the leader among the solutions for creating beautiful dashboards is Grafana. So we decided to display all our monitoring from Nagios on monitors in the form of beautiful graphs in Grafana. The only question remained was how to make friends with each other.
common goal
Monitor the entire infrastructure through Nagios , configure alerts about system problems through Slack , connect the output of system performance data to the Grafana graphical shell for real-time monitoring.
Technology stack
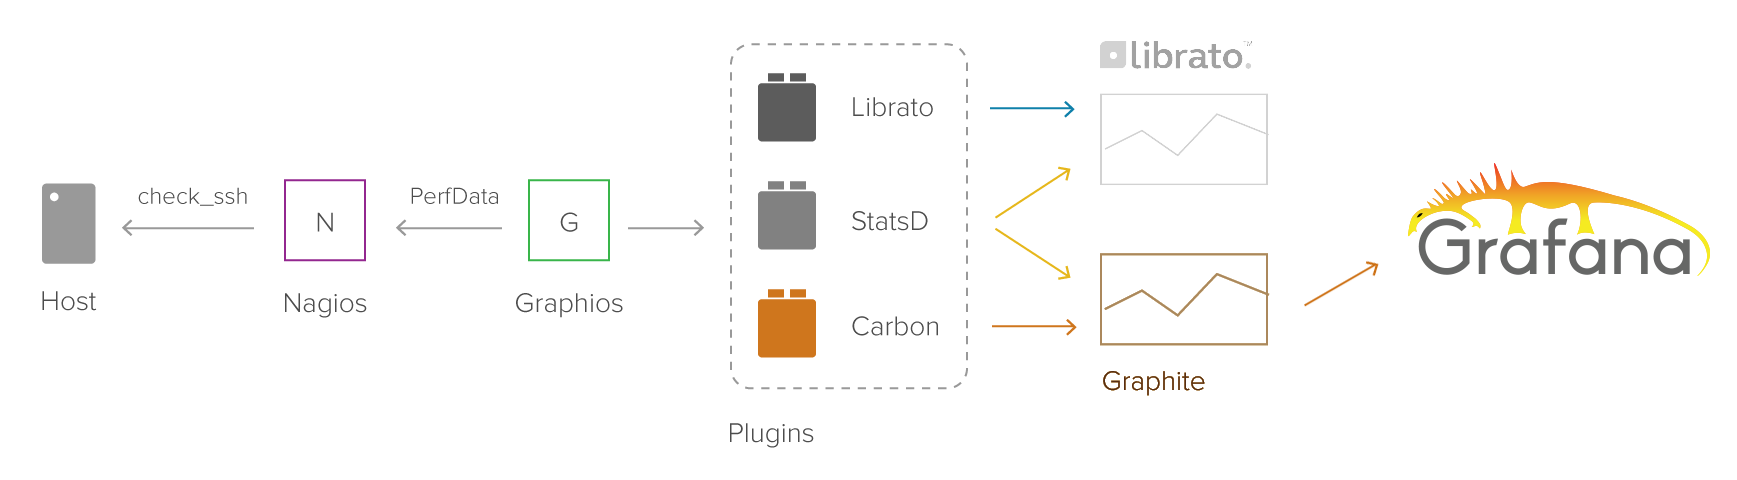
- Nagios - Central System Monitoring Node
- NRPE - a set of plugins that transmit Nagios host / service information
- Graphios - Nagios plugin for collecting system performance data needed for charting
- Carbon - back-end layer for storing system performance data in the database
- Graphite - stat processing module. data and graphing
- Grafana - a graphical shell working with data from Graphite to build beautiful dashboards with real-time graphs
- Slack Nagios App - module for triggering Nagios alerts through Slack
Short description
Nagios collects statistics from all kinds of virtual machines throughout the system. We need to save this data to the database in a certain format and at a certain interval so that Grafana can output it. Grafana works with several formats, but the most convenient for us is Graphite . Graphite is essentially the same graphical shell, but its interface was apparently made by the same people as the Nagios interface. Under the hood, he has a database that stores the stat. data is Whisper and the layer for processing this data is Carbon . Directly Nagios does not know how to communicate with Graphite, so smart people have created extra. a plugin that takes current readings from Nagios and passes them to Carbon - this plugin is called Graphios. Thus, our task is to link together 6 different technologies. Go!
Immediately a small disclaimer:
- The current configuration was built under Debian , but the general assembly logic is the same for the whole family.
- In this article I will not talk about installing and configuring Nagios itself, since the network is full of manuals (I will write separately about how to properly configure Nagios). It will be a question of a bundle of a series of technologies among themselves - no lyrics, pure cardcore.
Carbon
We set and configure Carbon:
apt-get install graphite-carbon
sudo nano /etc/default/graphite-carbon
We put the parameter value in true:
CARBON_CACHE_ENABLED=trueSave, exit.
Editing a schema file
sudo nano /etc/carbon/storage-schemas.confThis file contains directives that specify stat storage options. data: how often it is stored and how long it is stored. For ourselves, we use approximately the following directive:
[atlas]
pattern = .*
retentions = 60s:1y
This means that the data will be received in the database every minute and stored throughout the year. Correct the values to fit your needs.
Also, it is important to understand that the frequency of data storage in the database should not exceed the frequency of data output by Nagios himself - otherwise we will add duplicate values to the database. Out of the box, Nagios listens to all services and hosts every 10 minutes, so if you want to achieve the maximum real-time, you also need to change the processing intervals on the Nagios side.
We connect the last config and start Carbon:
sudo cp /usr/share/doc/graphite-carbon/examples/storage-aggregation.conf.example /etc/carbon/storage-aggregation.conf
sudo service carbon-cache start
Database
We prepare the base for all further programs. We prefer PostgreSQL, but Graphite supports different databases.
apt-get install postgresql libpq-dev python-psycopg2
sudo -u postgres psql
Set up a new user and database:
CREATE USER graphite WITH PASSWORD 'password';
CREATE DATABASE graphite WITH OWNER graphite;
\q
The password from the database needs to be saved - it will still be useful to us.
Graphios
Install Python , Django and then graphios itself :
apt-get install -y python2.6 python-pip python-cairo python-django python-django-tagging
pip install graphios
Editing the file /etc/graphios/graphios.cfg :
debug = False
enable_carbon = True
Create a folder for storing statistical uploads:
mkdir /var/spool/nagios/graphios/
chown -R nagios:nagios /var/spool/nagios
Testing:
Add a test line to the Nagios service definition:
define service {
        use                             generic-service
        host_name                       DB
        service_description             PING
        check_command                   check_ping!100.0,20%!500.0,60%
        _graphiteprefix                 monitoring.nagios01.pingto
}
Call Graphios in test mode:
/usr/local/bin/graphios.py --spool-directory /var/spool/nagios/graphios --log-file /tmp/graphios.log --backend carbon --server 127.0.0.1:2004 --testThe output should appear records like:
monitoring.nagios01.pingto.DB.rta 0.248000 1461427743
monitoring.nagios01.pingto.DB.pl 0 1461427743
If everything is normal, run the graphios daemon :
service graphios startGraphite
Graphite must be installed strictly after installing Carbon, otherwise Nagios / Graphios will not be able to send data correctly
Install the main dependencies
apt-get install -y libapache2-mod-wsgi python-twisted python-memcache python-pysqlite2 python-simplejson
pip install whisper
pip install carbon
pip install graphite-web
pip install pytz
pip install pyparsing
wget https://raw.github.com/tmm1/graphite/master/examples/example-graphite-vhost.conf -O /etc/apache2/sites-available/graphite
Next, you need to slightly correct the new Apache2 config:
nano /etc/apache2/sites-available/graphiteChange "WSGISocketPrefix / etc / httpd / wsgi /" to:
WSGISocketPrefix /var/run/apache2/wsgiAdd another alias after the line "Alias / content / / opt / graphite / webapp / content /":
Alias /static/ "/opt/graphite/static/"Save, exit.
Настраиваем local_settings.py
cd /opt/graphite/webapp/graphite
cp local_settings.py.example local_settings.py
nano local_settings.py
В открывшемся файле включаем строки и проставляем значения:
SECRET_KEY нужно придумать, а значения для директивы DATABASE берем из ранее созданной базы.
Значение WHISPER_DIR можно найти через команду "locate whisper".
Значения директивы CARBONLINK_HOSTS нужно проставить в соответствии с выводом команды "lsof -i -P | grep carbon".
SECRET_KEY = 'some_secret_key'
TIME_ZONE = 'Europe/Moscow'
WHISPER_DIR = '/var/lib/graphite/whisper'
USE_REMOTE_USER_AUTHENTICATION = True
DATABASES = {
    'default': {
        'NAME': 'graphite',
        'ENGINE': 'django.db.backends.postgresql_psycopg2',
        'USER': 'graphite',
        'PASSWORD': 'password',
        'HOST': '127.0.0.1',
        'PORT': ''
    }
}
CARBONLINK_HOSTS = ["127.0.0.1:2003","127.0.0.1:2004","127.0.0.1:7002"]
Настраиваем Graphite
В процессе конфигурации, система попросит завести супер-пользователя. Нужно проставить новые значения и запомнить их.
cd /opt/graphite/conf/
cp graphite.wsgi.example graphite.wsgi
cd /opt/graphite/webapp/graphite
python manage.py syncdb
chown -R www-data:www-data /opt/graphite/storage/
a2enmod wsgi
a2ensite graphite
python manage.py collectstatic --pythonpath=/opt/graphite/webapp
chown -R www-data:www-data /opt/graphite/static
/etc/init.d/apache2 restart
Grafana
Самая простая часть — если Graphite/Carbon настроены правильно — достаточно будет подключить новый ресурс типа Graphite и настроить дашборд для вывода данных — Grafana сама сделает все остальное!
wget https://grafanarel.s3.amazonaws.com/builds/grafana_3.0.0-beta51460725904_amd64.deb
sudo apt-get install -y adduser libfontconfig
sudo dpkg -i grafana_3.0.0-beta51460725904_amd64.deb
sudo service grafana-server start
sudo update-rc.d grafana-server defaults 95 10
Интерфейс будет доступен на 3000 порту. Дефолтные логин/пароль — admin.
Бонус: Slack Nagios App
Как альтернатива прямой визуализации и пассивным письмам — подключим также вывод оповещений из Nagios в Slack.
1) Создаем новый канал в Slack, например #alerts
2) Идем на страницу приложений Slack-а

3) Находим приложение Nagios

4) Следуем инструкциям по загрузке конфига
wget https://raw.github.com/tinyspeck/services-examples/master/nagios.pl
cp nagios.pl /usr/local/bin/slack_nagios.pl
chmod 755 /usr/local/bin/slack_nagios.pl
5) Копируем токен и домен Slack и вставляем их в новый конфиг /usr/local/bin/slack_nagios.pl

6) Copy the Nagios directives and paste them into the appropriate places (commands and a new contact)
define contactgroup {
  contactgroup_name admins
  alias             Nagios Administrators
  members           root,slack
}
define contact {
      contact_name                             slack
      alias                                    Slack
      service_notification_period              24x7
      host_notification_period                 24x7
      service_notification_options             w,u,c,r
      host_notification_options                d,r
      service_notification_commands            notify-service-by-slack
      host_notification_commands               notify-host-by-slack
}
define command {
    command_name notify-service-by-slack
    command_line /usr/local/bin/slack_nagios.pl -field slack_channel=#alerts -field HOSTALIAS="$HOSTADDRESS$" -field SERVICEDESC="$SERVICEDESC$" -field SERVICESTATE="$SERVICESTATE$" -field SERVICEOUTPUT="$SERVICEOUTPUT$ ($LONGDATETIME$)" -field NOTIFICATIONTYPE="$NOTIFICATIONTYPE$"
}
define command {
    command_name notify-host-by-slack
    command_line /usr/local/bin/slack_nagios.pl -field slack_channel=#alerts -field HOSTALIAS="$HOSTADDRESS$" -field HOSTSTATE="$HOSTSTATE$" -field HOSTOUTPUT="$HOSTOUTPUT$ ($LONGDATETIME$)" -field NOTIFICATIONTYPE="$NOTIFICATIONTYPE$"
}
7) We save, we overload Nagios, we check.
Useful materials:
» How To Install StatsD to Collect Arbitrary Stats for Graphite on Ubuntu 14.04
» How To Install and Use Graphite on an Ubuntu 14.04 Server
» https://github.com/shawn-sterling/graphios
» http://grafana.org/features / # graphite