August 15, 2016 at 10:29
How trading on the exchange is actually arranged, and how it can be improved: A simple algorithm (part 4)
- Transfer
We continue the series of articles by the former HFT trader Marco Stukkio, in which he explains on the fingers how high-frequency trading on the exchange works ( first part , second part , third part ). The time has come to whitewash the HFT from liability for short-term disruptions to the financial markets.
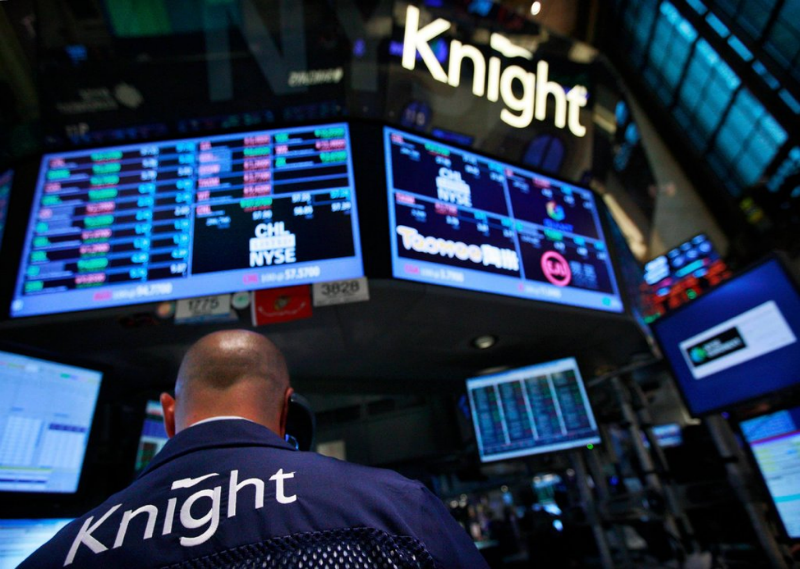
In 2012, they wrote a lot about the failure of Knight Capital (KCG), a Wall Street trading company. The firm began practicing high-frequency trading and suffered a crushing failure, losing $ 440 million and undermining investor confidence in HFT. You can read more about this here , here and here.
. Journalists usually have no time to delve into the technical details of such stories. But, according to the author of the HFT blog, there was no reason to panic. Trader systems are reliable if built wisely.
There are two basic rules for building a robust and reliable HFT system. They only contradict each other at first glance. The first is called the Transportation Security Agency method. Its essence is to create a pair of ideal systems, “X-ray scanners”, through which not even a mouse will slip. Then, based on them, already do the rest of the design. If your protection device is made correctly, and you can trust it, then everything else should work as it should. The motto of this method: any error is excluded.
The second approach can be called the Netflix method. It is based on the idea that any system will ever start to fail. Netflix network has a program called "monkey chaos." When one of the developers starts working with the company's software (and we are talking about tens of thousands of individual servers), the program starts and starts to disconnect randomly some of the servers. If the system cannot handle it, it is discarded as unreliable. Netflix’s motto is “shit happens,” be prepared for it.
In the stock market, the principle of the second approach can be well illustrated. Shit happens here all the time. But the joint actions of the market and regulators ensure that all sorts of technical disturbances (for example, surges in the activity of HFT-traders) do not cause much harm. The chart shows the positions of the S&P 500 index in time, one point per day.

This is the type of chart that attracts people who trade more slowly than any daily trader. Like Warren Buffett, George Soros and the like. It demonstrates the impact on the market for Flash Crash (a crash on the New York Stock Exchange in 2010).
If you do not register detailed values on the X axis, it is impossible to understand from where and when the market collapsed. The author tells the story of a friend-trader who, just at the time of the collapse, went to the restroom. Within 20 minutes while he was there, the market managed to sit down and recover. Yes, there were things that needed to be cleaned. But overall, the recovery did not take much time.
Here is another chart that illustrates the story of Knight Capital in 2012:
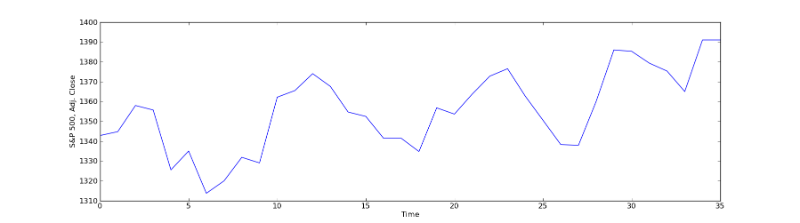
There are two options, the author says: either the failure from this diagram is not really visible, or he simply does not know how to handle Matplotlib to display the data correctly.
The time has come for the next grand revelation. The only line that indicates troubles from Knight Capital's activity is the stock price of the company itself.

To summarize, what happened when Knight Capital burst? We can notice some irregularities in the bidding process at the time of trouble with the company, while everyone else was trying to find out what happened. In fact, only the Knight Capital computer program, which began to buy high and sell low, just went into pieces. As a result, it enriched some other traders by $ 400 million. The market itself dipped a little on Tuesday, but by Friday fully recovered.
It seems that Knight Capital was the only victim of this “collapse”. That is, the financial market acted according to the Netflix principle: if someone dipped, throw him overboard, and the market will quickly come to its senses.
. Journalists usually have no time to delve into the technical details of such stories. But, according to the author of the HFT blog, there was no reason to panic. Trader systems are reliable if built wisely.
There are two basic rules for building a robust and reliable HFT system. They only contradict each other at first glance. The first is called the Transportation Security Agency method. Its essence is to create a pair of ideal systems, “X-ray scanners”, through which not even a mouse will slip. Then, based on them, already do the rest of the design. If your protection device is made correctly, and you can trust it, then everything else should work as it should. The motto of this method: any error is excluded.
The second approach can be called the Netflix method. It is based on the idea that any system will ever start to fail. Netflix network has a program called "monkey chaos." When one of the developers starts working with the company's software (and we are talking about tens of thousands of individual servers), the program starts and starts to disconnect randomly some of the servers. If the system cannot handle it, it is discarded as unreliable. Netflix’s motto is “shit happens,” be prepared for it.
In the stock market, the principle of the second approach can be well illustrated. Shit happens here all the time. But the joint actions of the market and regulators ensure that all sorts of technical disturbances (for example, surges in the activity of HFT-traders) do not cause much harm. The chart shows the positions of the S&P 500 index in time, one point per day.
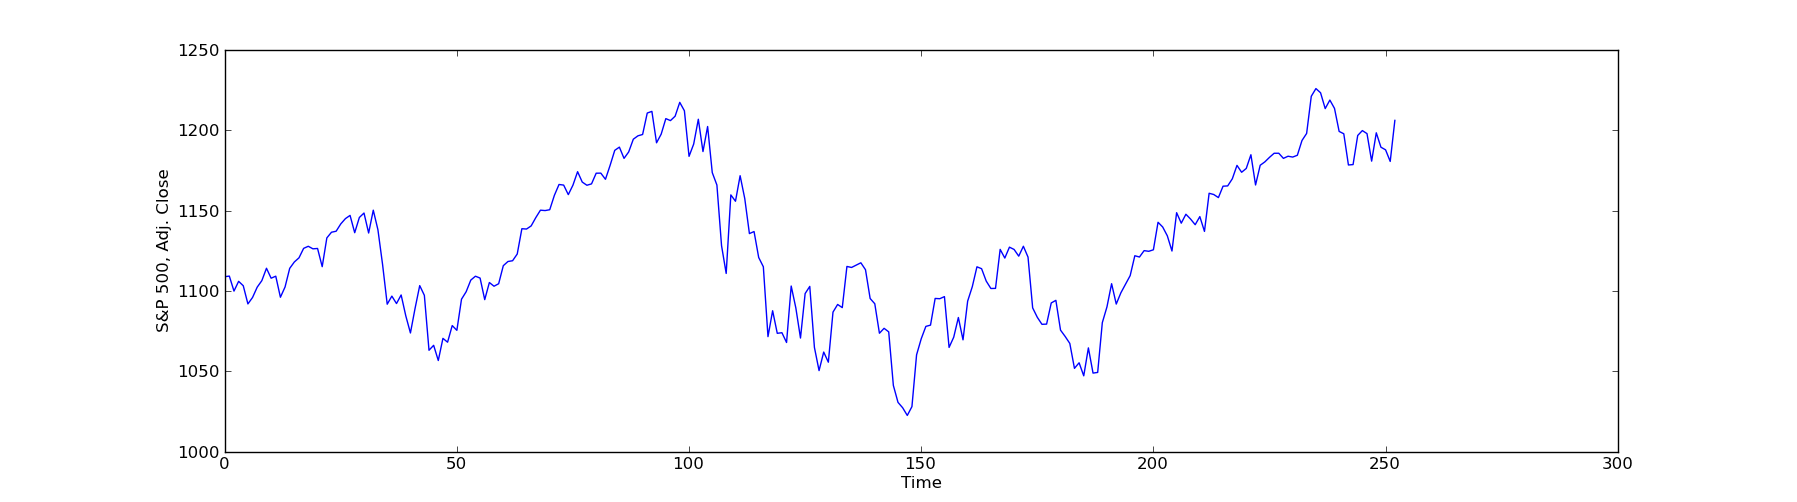
This is the type of chart that attracts people who trade more slowly than any daily trader. Like Warren Buffett, George Soros and the like. It demonstrates the impact on the market for Flash Crash (a crash on the New York Stock Exchange in 2010).
If you do not register detailed values on the X axis, it is impossible to understand from where and when the market collapsed. The author tells the story of a friend-trader who, just at the time of the collapse, went to the restroom. Within 20 minutes while he was there, the market managed to sit down and recover. Yes, there were things that needed to be cleaned. But overall, the recovery did not take much time.
Here is another chart that illustrates the story of Knight Capital in 2012:
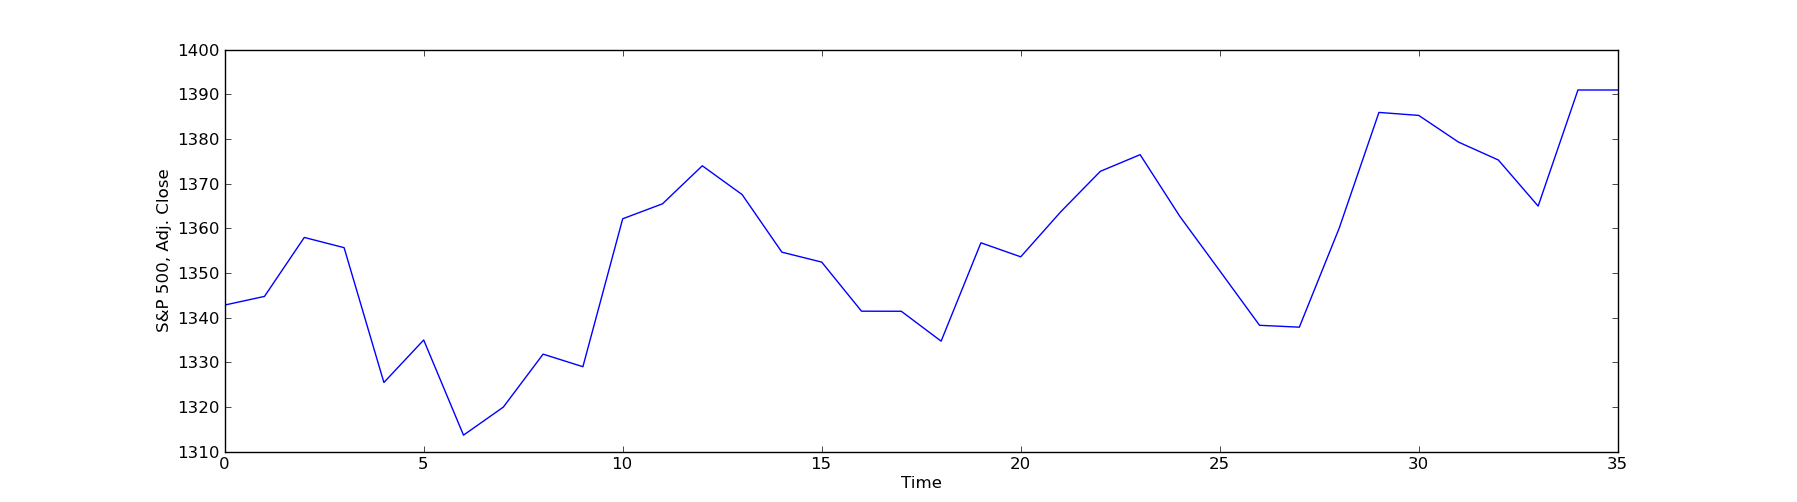
There are two options, the author says: either the failure from this diagram is not really visible, or he simply does not know how to handle Matplotlib to display the data correctly.
The time has come for the next grand revelation. The only line that indicates troubles from Knight Capital's activity is the stock price of the company itself.
To summarize, what happened when Knight Capital burst? We can notice some irregularities in the bidding process at the time of trouble with the company, while everyone else was trying to find out what happened. In fact, only the Knight Capital computer program, which began to buy high and sell low, just went into pieces. As a result, it enriched some other traders by $ 400 million. The market itself dipped a little on Tuesday, but by Friday fully recovered.
It seems that Knight Capital was the only victim of this “collapse”. That is, the financial market acted according to the Netflix principle: if someone dipped, throw him overboard, and the market will quickly come to its senses.
Other materials on the topic of finance and stock market from ITI Capital :
- Analytics and market reviews
- Futures, Indices and IPOs: How Exchanges Are Actually Arranged and Why They Are Needed
- Top 10 books for understanding the structure of the stock market
- Futures, Indices and IPOs: How Exchanges Are Actually Arranged and Why They Are Needed
- Infrastructure of the Russian securities market (short educational program)
- How-to: robots and brokerage trading system API