How do Fault Tolerant servers differ from "consumer" consumer goods in a specific example
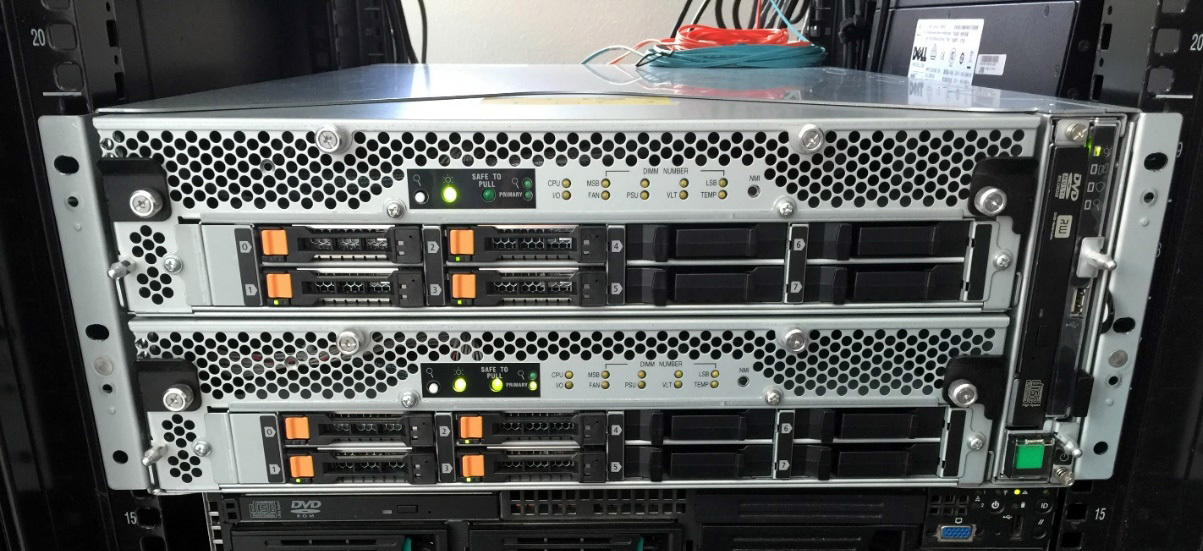
"Mirror" cluster with synchronous computing processes, front view
So far, the entire Internet is screaming about our domestic hard drive of as much as 50 megabytes weighing 25 kilograms, not really understanding that this thing can survive two nuclear wars at the bottom of the pool, I’ll tell you about serious fault-tolerant servers and their differences from ordinary iron. Fortunately, such people just came to us for testing, and there was an opportunity to thoroughly mock them.
These solutions are especially interesting for admins. The fact is that they are protected not physically - by covers, fault-tolerant interfaces or something else, but on the level of the computing architecture.
We got the ftServer 6800 flagship from Stratus in our hands. This is a case with two identical computing nodes combined into one cluster, with both of its halves working synchronously and doing the same “mirror”. This is the good old "space" architecture, when the computational process goes through two independent hardware paths at once. If a bug occurs somewhere (not related to code curvature), then one of the results will definitely reach the goal. This is important for critical systems in a wide range of areas from banking to medicine, and it is very important where there is “silent data loss”. That is, where processor bugs arise in full growth due to the fact that the crystals are still unique and two identical machines do not exist in nature. This usually doesn’t show up, but in critical tasks it is necessary to protect oneself from the accidental influence of interference and possible more obvious problems. Therefore, that's how it was done.
The most important:
- Computing processes are duplicated. Components look like a single device to the OS. Failover runs at the driver level. There is no loss in CPU synchronization, but there is overhead associated with HDD replication.
- The claimed availability of 99,999 on Linux, Win and VMware. From nines ripples in the eyes, and therefore we undertook to verify this statement (as far as possible).
How it works
One of the cluster nodes will always be primary (Primary), and the other slave (Secondary). This approach to construction is due to high requirements for fault tolerance (99,999), the technology is proudly called DMR (Dual Modular Redundancy). Both nodes of the cluster synchronously perform operations and if one of the nodes is lost, an instant failover will be performed on the remaining one.
Each of the nodes is divided into two modules (Enclosure):
- CPU Enclosure - a module that includes CPU and RAM;
- IO Enclosure - a module dedicated to PCIe, RAID controller (with disks) and built-in NICs.
Stratus engineers came to the separation into two modules due to different approaches to synchronizing the devices contained in them:
- Enclosure CPU uses Lockstep technology (step by step). It ensures that the components of these two modules work synchronously and are in the same state, which means that failover will always succeed.
- Lockstep cannot be used for IO Enclosure due to the large number of heterogeneous devices. RAID controllers from both halves of the cluster are replicated by combining disks located in the same slots (in pairs). NICs when using Windows (Intel PROset driver) work in one of the modes: AFT, ALB, SFT, etc., so the Primary node can access the Secondary node ports - in the whole 8 pieces. If Linux or ESXi are deployed, NICs are assembled in bonding, that is, ports are combined in pairs with a common MAC address (similar to disks). For third-party HBAs, if a Primary device fails, it will switch to a working one. USB located on the halves themselves are not subject to synchronization. This problem is solved by the common VGA, USB and COM ports, soldered on a passive backplane.
To manage clustering, a separate ASIC is used - Stratus Albireo, named after the double star system (romance). This controller is located in each of the computing nodes. He is responsible for synchronizing both nodes through a passive backplane, as well as for troubleshooting.
Connection between modules of computing nodes is organized according to the full mesh scheme. Thus, we get a very flexible and fault-tolerant system: this arrangement allows the Primary node to see redundant devices and, in which case, for example, put the IO enclosure Secondary node into operation.

The topology of the relationships between the components of the cluster nodes.
Stratus Albireo also ensures that the data streams received from both nodes are identical. If there is a discrepancy, the system will identify the cause and try to correct the failure. If the error has been eliminated (the error type is correctable), then the MTBF (Mean Time Between Failures) counter will increase by 1, and if not, this element will be disabled (error type uncorrectable). Errors are calculated for the main components of each cluster node: CPU, RAM, HDD, IO devices. Due to the accumulation of statistics, the controller can proactively signal the impending breakdown of a component.
- To run the OS on such a non-standard solution, Stratus uses special drivers, divided into two classes:
- Reinforced drivers developed jointly with the vendor. They are called “reinforced” because they undergo a series of tests for stability and compatibility.
- An additional virtual driver that forces the OS to see a pair of devices spaced across two computing nodes as one device, which ensures transparent failover.
For cluster management and initial OS configuration, the Stratus Automated Uptime Layer software package is used (it has its own for each OS), and it is directly connected to Stratus Albireo (the cluster will not work correctly without it). The types of this software and its capabilities will be described below.
Specifications
The ftServer 6800 is positioned as a solution for databases and highly loaded applications. For those who need something simpler, two more models are provided: ftServer 2800 and ftServer 4800.
Characteristic | ftServer 2800 | ftServer 4800 | ftServer 6800 |
Logical processor (per cluster node) | 1 socket | 1 socket | 2 sockets |
Processor type | Intel Xeon processor E5-2630v3, 2.4 GHz | Intel Xeon processor E5-2670v3, 2.3 GHz | Intel Xeon processor E5-2670v3, 2.3 GHz |
Supported amount of RAM | 8 GB to 64 GB DDR4 | 16 GB to 256 GB DDR4 | 32 GB to 512 GB DDR4 Up to 1 TB for VMware |
Type of supported drives | 12 Gb / s SAS 2.5 " | 12 Gb / s SAS 2.5 " | 12 Gb / s SAS 2.5 " |
10/100/1000 Ethernet ports (per cluster node) | 2 | 2 | 2 |
10 Gb Ethernet ports (per cluster node) | Not | 2 | 2 |
Integrated PCIe G3 Buses (per cluster node) | 2x4 PCIe | 2x4 PCIe | 2x4 PCIe 2x4 PCIe |
Additional PCIe bus (per cluster node) | Not | 2? 8 PCIe | Not |
Our cluster has: Intel Xeon processor E5-2670v3, 2.3 GHz (2 pcs.), DDR4 32 GB, 2133 MHz, 512 GB, 400 GB SSD (1 pcs.), 300 GB 15k HDD (2 pcs.), 1.2 TB 10k HDD (1 pc.), FC 16 Gb 1 port.
The configuration meets current performance requirements, and a special version for VMware is available, which is characterized by a doubled RAM size - 1 TB. Someone will say that now the standard for rack-servers is 2-3 TB of RAM, but you need to understand that the FT cluster is a solution sharpened primarily under the protection of a particular system, the mechanism of which imposes its limitations.
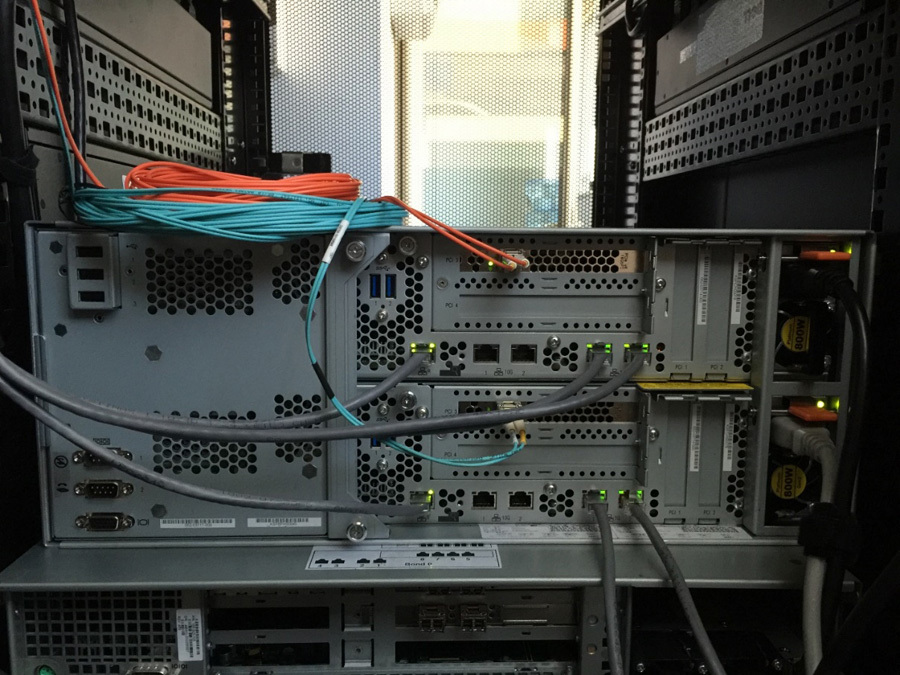
Here is the rear view:
Separately, about the indication, it is quite simple and understandable even without instructions:
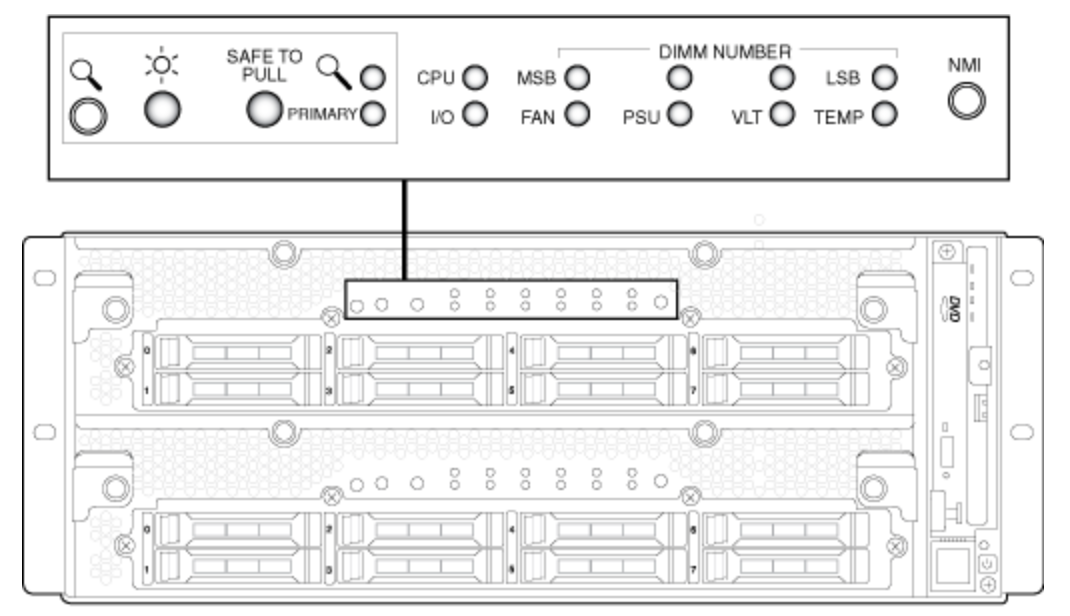
On the front panel are the main indicators responsible for the key elements of the nodes.
But there should be only three of us:
- “Sun” - power is connected, this node is working;
- Primary - talks about which of these cluster nodes is the leading one;
- Safe to Pull - if it blinks, you cannot remove the cluster node, but if it just burns, we safely pull it out.
The indication is fully visible only with the decorative panel removed. If it is returned to its place, then we get information only about the general state of the system, as well as about whether the cluster nodes are synchronized or not.
Chassis - a 4U-height box, which is divided into two main sections (allocated for cluster nodes) of 2U each and one additional vertical section of 4U height, in which there is a management module expander connected to the QPI bus (it is clearly visible on the right in Figure 1 ) With it, we get the usual set: DVD drive, USB port (three more are located at the back), VGA, COM port, and even a modem, also it has a button for turning the server on and off under a cap that protects against accidental pressing.
Initially, we were sure that the expander itself contains the management module, but this theory was debunked by the empirical method: despite removing the expander from the chassis, we were able to successfully access the BMC (Baseboard management controller). Later, when studying the cluster, it turned out that BMC modules are located in the cluster nodes themselves.
We will take out one of the nodes and consider it closer. It just won’t be possible to do this, for this you need to disconnect the power cable that holds the crossbar-lever (the first line of defense against accidental disconnection-extraction) and unscrew the two bolts in front. It is noteworthy that due to this crossbar the power supply cannot be changed “hot”; you need to pull out the cluster node completely.

Retrieving a cluster node. Step 1.

Retrieve the cluster node. Step 2
After these manipulations, the chassis will allow us to extend the cluster node only halfway, for complete extraction we need to press the lever.

Retrieving a cluster node. Step 3.
After we got the server, we begin to examine what is inside.

Cluster node
There are no complaints about the assembly of the node itself. Everything is done qualitatively and without obvious flaws.
The placement of elements and the cabling of the backplate of the HDD and two USB 3.0 (hi PC) are concise and do not cause any negative. It is also worth paying attention to the thickness of the metal of the case: here it is thick, like those of Compaq’s servers. The main elements of the body are attracted by screws with a Grover washer, which means they are unlikely to unwind from vibration. Stratus engineers clearly wanted to show that the cluster is designed for high computational and physical loads.
We cannot but note an interesting find, namely a significant number of NEC logos inside a non-NEC server at all. And indeed, there they are not without reason. As we managed to find out, Stratus signed a contract with NEC for the production of servers, and NEC buys software (OEM) from Stratus. Therefore, if you go to the NEC site, you can catch a sickly deja vu. According to the assurances of Stratus himself, only when buying server hardware from them do you get the latest software, which is quite logical.
Failover Cluster Management
Let's move on to the software, namely, to the BMC management interface (at Stratus it has the proud name of Virtual Technician Module). It looks rustic:


VTM interface
On the other hand, all the basic functionality is present: we can get access to KVM, mount ISO, and even find out the status of the main components.
The lower part of the management console was made interesting; it displays the status of both cluster nodes, BIOS codes (at boot time), the number of users logged in to each of the VTMs, the role of nodes in the cluster, and the Safe to Pull status.

It's funny that if you go to the Secondary cluster node, the graphic console disappears from the functional, and you can turn off the cluster, but there’s no way to see what’s happening on the monitor.
It is worth adding that disconnecting one of the cluster nodes separately or taking some of its elements out of operation using VTM will fail. To do this, in the case of vSphere, deploy appliance on the cluster itself (ftSys virtual machine), and when using Windows or Linux, install the software package. Moreover, for Windows, the program module is an application with a GUI (ftSMC), and for Linux it works only in command line mode and almost completely duplicates the appliance functionality for vSphere. It is important to note that the installation of these software packages (a module for the OS, appliance) is required, as they are also responsible for the initial configuration of the OS or hypervisor for working on the cluster hardware, as well as failover processing. That is, if you do not install and configure these modules,
We were interested in the combination of Stratus FT and vSphere, so the next discussion will be about appliance. FtSys itself consists of two parts: a web interface from which you can track the status of the entire cluster and any of its components, as well as a command line that allows you to manage the cluster.
FtSys main page: ftSys

web-console provides access to viewing settings and status of remote monitoring (Stratus ActiveService Network, ASN), VTM, virtual switches, disk subsystem status and System Management logs (they contain failover logs and further synchronization).
Let's

check the state of the cluster components: Open the CPU Enclosure 0:

The cluster components can be in one of the states:
- ONLINE - the component is synchronized and is in operation (applies to CPU and RAM).
- DUPLEX - the component is synchronized and is in fault-tolerant mode.
- SIMPLEX - the cluster component is not synchronized, or is undergoing diagnostics.
- BROKEN - the component is defective and did not pass the diagnostics. It is important to note that in the case of network cards, BROKEN indicates that the network cable is not connected.
- SHOT - the component of the node was diagnosed as faulty and was electrically isolated by the system.
Раз уж мы заговорили про CPU Enclosure 0, объясним почему именно 0, а не какая-то другая цифра. В системе наименований Stratus’a у каждого компонента есть путь, причем для тех, что находятся в первом узле, в начале пути всегда будет 0, а для тех, что во втором — 1. Сделано это для удобства работы с кластером. К примеру, для просмотра информации о самом компоненте через консоль:

Для разграничения CPU и IO Enclosure у последнего добавлена цифра 1 в начале, поэтому у IO модуля из первого узла путь будет 10, а для этого же модуля из второго узла — 11.
Подключение по SSH к ftSys позволяет производить диагностику сервера, в том числе собирать логи, просматривать детализированные отчеты по компонентам, а также отключать компоненты и модули целиком.
Поддержка и гарантия
Let's consider cluster support with the description of the replaced components. Elements are divided into CRU groups (Customer Replaceable Unit):
CRU | |
Decorative panel | Expander Management Module |
Computing node | PCIe adapter |
Memory | PCIe riser |
DVD drive | PDU |
HDD | Backplein |
This means that if you have a failed CPU or cooling module, then you will receive a cluster node in which you will need to rearrange all the other elements (DIMM, HBA and PCIe riser) from the list above.
The cluster itself is covered by one of four support programs (FtService): Total Assurance, System Assurance, Extended Platform Support and Platform Support. Table with the main indicators:
Ftservice | Total assurance | System assurance | Extended platform support | Platform support |
Sending a spare part to a customer | NBD (Next Business Day) | NBD (Next Business Day) | NBD (Next Business Day) | NBD (Next Business Day) |
Critical Response Time | <30 minutes 24/7/365 | <60 minutes 24/7/365 | <2 hours 24/7/365 | <2 hours 9/5/365 |
First Call Response Time | 24/7/365 | 24/7/365 | 24/7/365 | 24/7/365 |
Proactive Monitoring (ASN) | 24/7/365 | 24/7/365 | 24/7/365 | 24/7/365 |
Access to the accessibility engineer | 24/7/365 | 24/7/365 | Not | Not |
Finding the cause of the problem at the software level | Yes | Yes | Not | Not |
Determining the root cause of the problem | Yes | Yes | Not | Not |
Check out the site | Yes | Yes | Not | Not |
Awarding a high priority application | Yes | Yes | Not | Not |
Full OS support, including patches and updates | Yes | Not | Not | Not |
Collaboration with a vendor | Yes | Not | Not | Not |
Downtime Guaranteed | Yes | Not | Not | Not |
The standard warranty for the cluster is 1 year of Platform Support, which involves only sending spare parts with an analysis of the cause of the problem exclusively from the logs of the cluster itself. This means that if the reason lies somewhere in the OS, then they will not help you. You will have to either increase the level of support or agree to paid assistance.
Certain difficulties may arise if you want to update or reinstall software for the cluster - it is not in the public domain. You need to ask the vendor or be content with what came along with the equipment itself on the disk.
The situation is completely different with the documentation - it is detailed and well written. It is freely available both in the form of an electronic journal and in the form of pdf.
Although in Russia, Stratus is not at the hearing, but at the same time it is quite common in certain areas, for example, in the oil and gas industry. The company has its own spare parts warehouse located in Moscow, in which CRUs prepared for shipment are waiting in the wings. Of course, in the case of our vast country, it will take some time to deliver the parts (especially if you live in Vladivostok), but this is still better than if the parts came from Europe.
Hurray, tests!
The Stratus cluster was connected via SAN (FC 8 Gb) to the storage system (Hitachi AMS 2300). Then on the cluster we deployed a virtual machine to VMware ESXi 6 Update 1b running OS Windows 2012 R2 and installed the Oracle DB 12c database.

Test bench
Testing was carried out in two stages:
- Evaluation of failover and failback with high utilization of computing resources. Characteristics of the used virtual machine: 40 vCPU, 500 GB vRAM.
- Comparison of Stratus FT with VMware FT. Characteristics of the used virtual machine: 4 vCPU, 16 GB vRAM.
The differences in the characteristics of VMs for the 1st and 2nd stages are related to the limitation of VMware FT to 4 vCPUs.
For testing, we used a set of Swingbench benchmarks. From the list of available tests, Sales History was selected. This test creates its own database (the selected size is 8 GB) and allows you to generate queries (obviously specified) to it with a certain frequency.
Requests are different types of unloading, such as sales reports for a month, a week, etc. Benchmark settings (the changes made to the finished model are described):
- Number of Users: 450 (instead of the standard 16). The number of users has been increased for a full (close to 95% peak) load on the VM.
- Test duration: 1.5 hours. There is enough time to check the reliability of the platform as a whole, as well as to reach the normal average value of performance indicators.
For research, we chose the following methodology:
1. Run tests. Evaluation of cluster performance, determination of average values (after 15 minutes of operation):
- Transactions-per-Minute (TPM, transactions per minute);
- Transactions-per-Second (TPS, transactions per second);
- Response Time (RT, db query processing time).
2. Disabling the Primary cluster node;
3. Introduction of the cluster node into operation (30 minutes after shutdown);
4. Waiting for the complete synchronization of both nodes and obtaining the DUPLEX status for all components.
Stage I. Evaluation of failover and synchronization with high utilization of computing resources.
1. Average performance:
- Transactions-per-Minute, TPM: 542;
- Transactions-per-Second, TPS: 9;
- Response Time (db query processing time): 29335 ms.
2. Disabling the Primary cluster node:
06 / 06-07: 57: 10.101 INF t25 CpuBoard [0] DUPLEX / SECONDARY -> SIMPLEX / PRIMARY
This line in the ftSys logs is a node extraction marker. After that, one ICMP Echo Request (Figure 17) to the virtual machine was lost, and then the cluster continued to work in normal mode.

Primary cluster node retrieval results. There was no effect on the disk subsystem, average read delays remained within the reference.


Results of removing the Primary cluster node
3. Introduction of the cluster node to work:
Excerpt from ftSys logs:
06/06-08:25:32.061 INF t102 CIM Indication received for: ftmod 16 41
06/06-08:25:32.065 INF t102 Ftmod — indicationArrived. Index=125, OSM index=124
06/06-08:25:32.142 INF t102 Fosil event on bmc[10/120]
06/06-08:25:32.145 INF t25 Bmc[10/120] SIMPLEX/PRIMARY -> DUPLEX/PRIMARY
Note that the new cluster node (for replacement) comes without firmware and during initialization in the chassis, microcodes and the configuration from the remaining work are poured onto it.
4. Waiting for the complete synchronization of both nodes and obtaining the DUPLEX status for all components:
Within 20 minutes after the cluster node is put into operation, the equipment is diagnosed and synchronized in the following order (with layering, ie, a number of parallel operations can occur):
i. BMC (VTM);
ii. IO Slots (PCIe);
iii. HDD and SSD;
iv. RAM and CPU.
i. BMC (VTM). BMC synchronization in our case was a little faster, since the firmware and configuration were already on the extracted node.
Excerpt from the ftSys logs:
06/06-08: 25: 32.145 INF t25 Bmc [10/120] SIMPLEX / PRIMARY -> DUPLEX / PRIMARY
06 / 06-08: 26: 44.107 INF t25 Bmc [11/120] EMPTY / NONE -> DUPLEX / SECONDAR
06/06-08: 26: 44.259 INF t25 BMC flags, Needed = 00, Changed = 00
06 / 06-08: 26: 44.259 INF t25 Check if can proceed with checking for CFG conflict, saveRestoreCompleted: true
It can be seen from the logs that at first the VTM moved to DUPLEX, which after failover became PRIMARY and only after a minute did the SECONDARY VTM get the same status.
ii. IO Slots (PCIe). During PCIe synchronization, the determination of the type of riser (Make) first takes place, and only then each of the IO slots is read in turn.
Excerpt from the ftSys logs:
06/06-08:27:47.119 INF t25 Make Riser for IoBoard[11]: 2x PCI-E2(x8)
06/06-08:27:47.122 INF t25 Make IoSlots for IoBoard[11]
06/06-08:27:47.238 INF t25 IoSlot[11/1] UNKNOWN/NONE -> EMPTY/NONE
06/06-08:27:47.239 INF t25 IoSlot[11/1] removing PCI, was 0000:43:00
06/06-08:27:47.245 INF t25 IoSlot[11/2] UNKNOWN/NONE -> EMPTY/NONE
06/06-08:27:47.245 INF t25 IoSlot[11/2] removing PCI, was 0000:55:00
06/06-08:27:47.252 INF t25 IoSlot[11/3] UNKNOWN/NONE -> INITIALIZING/NONE
06/06-08:27:47.256 INF t25 IoSlot[11/4] UNKNOWN/NONE -> EMPTY/NONE
06/06-08:27:47.256 INF t25 IoSlot[11/4] removing PCI, was 0000:c7:00
06/06-08:27:47.262 INF t25 IoSlot[11/5] UNKNOWN/NONE -> INITIALIZING/NONE
And NICs are the first to rise and they are added to ESXi:
06 / 06-08: 27: 48.705 INF t191 NetworkIfc (vmnic_110601) UNKNOWN / NONE -> ONLINE / NONE
06 / 06-08: 27: 48.709 INF t191 NetworkIfc (vmnic_110600) UNKNOWN / NONE -> ONLINE / NONE
06 / 06- 08: 27: 48.712 INF t191 BondedIfc (vSwitch0) connecting slave vmnic_110600
06/06-08: 27: 48.716 INF t191 BondedIfc (vSwitch0.Management_Network) connecting slave vmnic_110600
At this point, the response time slightly increases with an ICMP Echo request:

Node synchronization. Adding NIC.
iii. HDD and SSD. After the NICs are raised, the data on the disks begins and their subsequent synchronization:
06/06-08:28:31.432 NOT t12 Storage Plugin: INFORMATION — 11/40/1 is now STATE_ONLINE / REASON_NONE
06/06-08:28:31.433 INF t12 Auto bringup Disk[11/40/1] based on MTBF
06/06-08:28:31.963 NOT t12 Storage Plugin: non-blank disk 11/40/1 discovered (safe mode)
06/06-08:28:31.964 INF t13 Storage: query superblock: vmhba1:C0:T1:L0
06/06-08:28:31.964 NOT t12 Storage Plugin: INFORMATION — 11/40/2 is now STATE_ONLINE / REASON_NONE
06/06-08:28:31.965 INF t12 Auto bringup Disk[11/40/2] based on MTBF
06/06-08:28:32.488 NOT t12 Storage Plugin: non-blank disk 11/40/2 discovered (safe mode)
06/06-08:28:32.488 NOT t12 Storage Plugin: INFORMATION — 11/40/3 is now STATE_ONLINE / REASON_NONE
06/06-08: 28: 32.489 INF t12 Auto bringup Disk [11/40/3] based on MTBF
06/06-08: 28: 32.964 NOT t12 Storage Plugin: non-blank disk 11/40/3 discovered (safe mode)
06 / 06-08: 28: 32.964 NOT t12 Storage Plugin: INFORMATION - 11/40/4 is now STATE_ONLINE / REASON_NONE
06 / 06-08: 28: 32.965 INF t12 Auto bringup Disk [11/40/4] based on MTBF
Next, ftSys detects the boot disk and starts synchronizing it:
06/06-08: 28: 40.360 INF t102 == 11/40/1 is a boot disk
06/06-08: 28: 40.360 INF t102 CIM Indication received for: FTSYS_Storage
06/06-08: 28: 40.367 NOT t12 Storage Plugin: INFORMATION - 11/40/1 is now STATE_SYNCING / REASON_NONE
The last to rise are the RAID controller (10/5, 11/5) and the FC HBA (10/3, 11/3) for both nodes:
06 / 06-08: 30: 47.421 INF t25 IoSlot [11/3] ONLINE / NONE -> DUPLEX / NONE
06 / 06-08: 30: 47.426 INF t25 IoSlot [11/5] ONLINE / NONE -> DUPLEX / NONE
06/06-08: 30: 56.144 INF t25 IoSlot [10/5] SIMPLEX / NONE -> DUPLEX / NONE
06 / 06-08: 30: 56.151 INF t25 IoSlot [10/3] SIMPLEX / NONE -> DUPLEX / NONE
iv. RAM and CPU. Enabling CPU Enclosure closes the synchronization of cluster nodes:
06 / 06-08: 28: 46.409 INF t25 CpuBoard [1] REMOVED_FROM_SERVICE / OK_FOR_BRINGUP -> DIAGNOSTICS / NONE
After 2 minutes, the CPU transitioned from the DIAGNOSTICS status to the INITIALIZING status and the firmware was read from the failed cluster node:
06/06-08:31:21.105 INF t102 Fosil event on cpu[1]
06/06-08:31:21.105 INF t25 CpuBoard[1] DIAGNOSTICS/NONE -> INITIALIZING/NONE
06/06-08:31:26.105 INF t25 Read IDPROM/board data for CpuBoard[1]
06/06-08:32:02.048 INF t102 CIM Indication received for: ftmod
06/06-08:32:02.053 INF t102 Ftmod — indicationArrived. Index=153, OSM index=152
06/06-08:32:02.112 INF t102 Fosil event on cpu[1]
During the synchronization of RAM and CPU, the performance dropped to 20% or 125 TPM, and on the section from 8:31:50 to 8:32:15 (25 seconds), the TPS was zero.
It is also worth paying attention to Response Time, in this period of time its indicator reached an absolute maximum of 313686 ms and lasted 3 s.
Synchronization ended at 08: 37: 29.351, although according to the chart below, the drawdown ended at 08:33:35.
06 / 06-08: 32: 04.280 INF t25 CpuBoard [1] INITIALIZING / NONE -> DUPLEX / SECONDARY
06 / 06-08: 34: 29.351 INF t25 Bringup Complete event, restoring bringup policy.
06/06-08: 37: 29.351 INF t25 BringupPolicy: enableCPU bringup
We can conclude that the synchronization of cluster nodes after failover does not significantly affect cluster performance until the synchronization of CPU and RAM, the latter draws down the main indicators of the cluster. It is important to consider that in this case the processors were utilized by 75% and RAM by 52%.

Initialization of CPU Enclosure. Performance Impact
Phase II. Comparison of Stratus FT with VMware FT
For stage II, the virtual machine from stage I was cloned onto a HA cluster of four Cisco UCS B200 M3 blade servers (CPU: Intel Xeon E5-2650, 2.0GHz; RAM: 128 GB DDR3) running ESXi 6 Update 2. Servers were also connected via SAN (8 Gb) to storage (Hitachi AMS 2300).
Average performance without VMware FT (comparing the performance of VMware and Stratus (Stage I) does not make sense due to the limitations on the number of vCPUs and the type of CPUs themselves (differ in family and clock speed):
- Transactions-per-Minute, TPM: 190;
- Transactions -per-Second, TPS: 3;
- Response Time (db query processing time): 2902 ms.
Before enabling FT, let us outline its main features:
- A maximum of 4 vCPUs and 64 GB Ram per VM are available;
- On one the host can use a maximum of 8 vCPUs in FT mode;
- Requires a dedicated 10 GB vNIC to synchronize cluster nodes;
- Shared storage is required;
Synchronization occurs at the level of virtual machines (Primary and Secondary), vCenter acts as the arbiter.
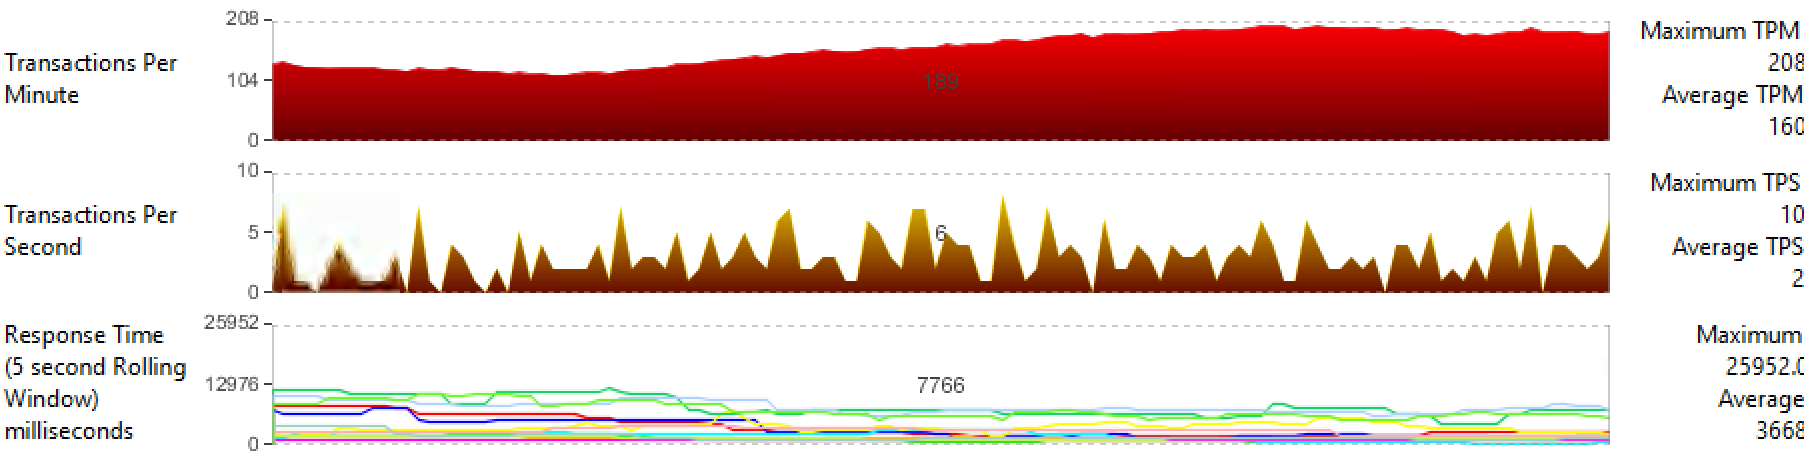
Average performance with VMware FT:
- Transactions-per-Minute, TPM: 160;
- Transactions-per-Second, TPS: 2;
- Response Time (db query processing time): 3652 ms.
We can conclude that we lose 16% of the total cluster performance, especially FT affects Response Time.

VMware

average performance indicators VMware FT average performance
Let us evaluate the impact of failover and FT cluster recovery on VM performance for VMware FT and Stratus ftServer.
VMware FT
When testing failover, VM performance increases from 160 to 190 TPM, since the replication mechanism does not work at this time.
After the switch is completed, the new Secondary VM is raised by Storage vMotion and a mechanism is activated that allows the machines to work synchronously - vLockstep. Note that after the FT cluster returned to its normal state, the TPM indicator slipped to 140 and did not return to the average value of 160.
The average time for synchronization and the transition from the “starting” to “protected” standing is an average of 10 minutes.
Stratus ftServer
Loss of synchronization amounted to 42% of the initial performance or 143 TPM with an average of 241 (Figure 26). As in the previous case, at the initial moment of CPU Enclosure replication, the TPS dropped to 0. The
average time for synchronization and transition from SIMPLEX to DUPLEX for components of both cluster nodes is on average 2 minutes.
The differences between Stratus and VMware solutions are due to the fact that Stratus ftServer was originally developed as an FT cluster, so we do not have significant restrictions on CPU, memory or the need for shared storage (when using only the internal disk subsystem of nodes). VMware FT represents only an additional option, which until the 6th version of vSphere arrived in isolation due to the restriction of one vCPU and was not in demand on the market.
Vmware FT. Рост производительности в процессе failover

Vmware FT. Падение производительности после восстановления FT

Stratus ftServer. Производительность решения при failover и после завершения синхронизации узлов
Выводы
ftServer stands out for its well-developed architecture, which provides a full-mesh connection between modules of cluster nodes, which leads to an increase in the already high level of protection against the failure of any component. The solution is not limited to software, it supports the latest versions of Windows and Linux, as well as virtualization vSphere and Hyper-V.
The documentation is excellent - detailed and well written. In addition, it is worth noting the presence of Russian-speaking support and a warehouse in Moscow, which guarantees timely assistance.
It is worth noting the significantly short time for synchronization (after replacing the node) of the processor modules (during which a significant decrease in performance occurs) and almost imperceptible replication of IO modules.
Given all of the above, we note that Stratus turned out to be an excellent cluster solution, and the declared availability of 99,999 really has a solid foundation.
Where it is used
In world and Russian practice, such systems are used:
- For the automation of continuous and discrete production processes and in energy accounting systems (process control systems / SCADA and ASKUE).
- For MES - systems of control and accounting of the administrative and economic activities of enterprises.
- Naturally, in finance. These are Processing / ERP, exchange gateways. As a rule, this is banking processing or Oracle.
- Like VoIP gateways, softphones, call centers, billing, where a minute of downtime can mean a thousand lost customers.
- Remote computing nodes, difficult to access for maintenance, as a rule, without personnel - the very “space”.
License
Another important point. Management is done as a single server, licensing also as a single server (this is very important for bank licenses for DBMS).
References:
- Vendor Documentation
- Architecture
- Cases and Application
- My mail: GMogilev@croc.ru