Optimizing the trading robot: a genetic algorithm
In the previous article, I took up the comparison of parametric optimization methods, i.e., the selection of parameters, evaluating the profitability of the robot trade during the subsequent backtest . It turned out that the banal Monte Carlo method — the generation of random uncorrelated combinations of robot parameters — works quite well. Now I want to test a popular algorithm, including in the community of programming traders: the genetic optimization algorithm .
Genetic algorithm for optimizing trading strategy
We will consider this algorithm on the example of optimization of 2 parameters. The optimized parameters of our robot are the period of the moving average and TakeProfit . For more immersion in “genetics”, we will call the period the moving average gene responsible for “growth”, and TakeProfit - the eye-color gene.
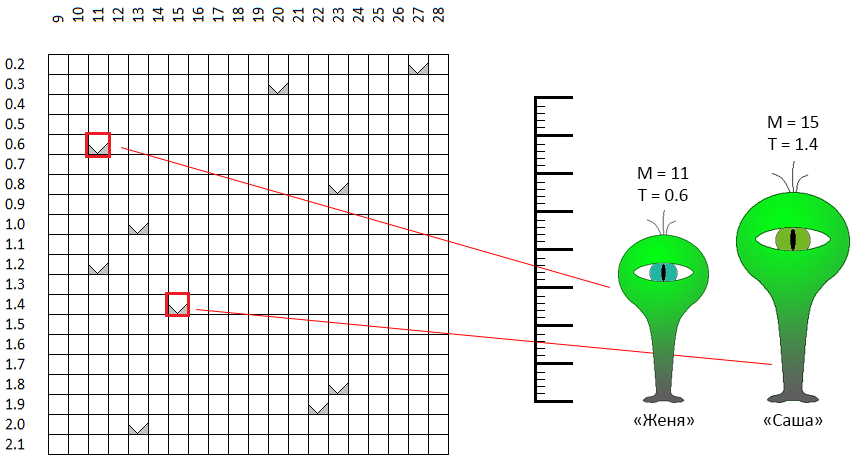
In the space of admissible values of parameters, each point, each pair of coordinates - “height / eye color” theoretically describes one “individual”. Suppose we randomly created 10 individuals. This was the first step of the genetic optimization algorithm - to create the first generation:
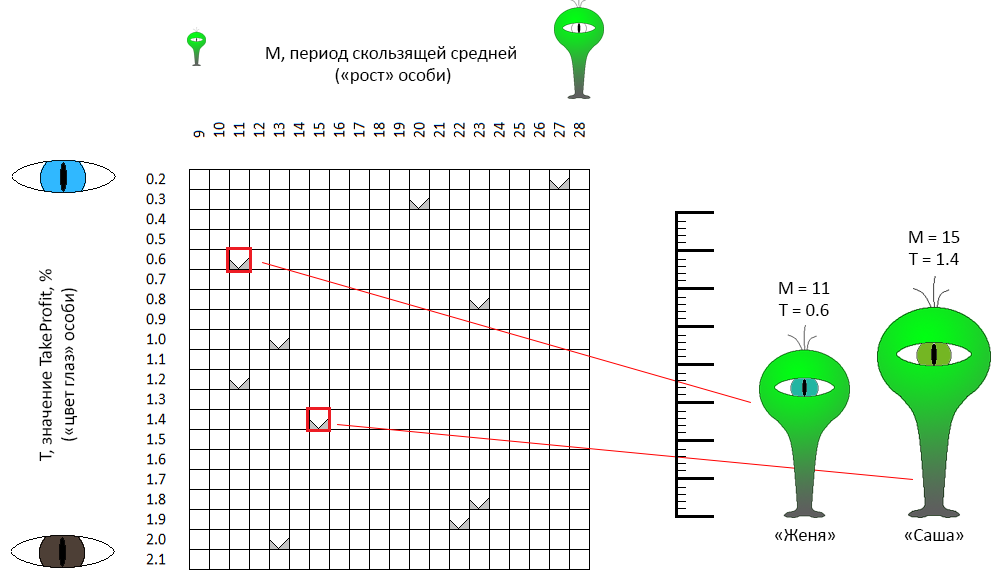
In the coordinate space M - T, points are randomly selected. For example, two dots marked with a red frame are “individuals” with gender-neutral names (this is an important point!) Zhenya and Sasha. Sasha's “growth” (in the initial formulation of the problem is the period of the moving average) is 11 units, the “eye color” is 0.6 (green-blue eyes). Zhenya is somewhat different in parameters. The same characteristics describe the 8 remaining individuals.
The second step is reproduction
Of the entire first generation, we determine a number of the most “successful” individuals. The criterion is obviously the value of the ZF . These individuals will multiply, randomly forming pairs (for this reason they received gender-neutral names). In general, you can set a number of rules for the selection of pairs. For example, selecting individuals that are close in characteristics (i.e., literally, those closest to the coordinate space) are inbreeding. You can, on the contrary, look for opposites (outbreeding). I could not find arguments in favor of one of these options - in my realization the pairs are formed strictly by chance ... For example, Zhenya and Sasha passed the qualification and decided to create a descendant. What does this mean in our context:

From two “parent” individuals, we obtain a third individual, which inherits a part of the traits of one parent, and a part - of the other. For example, Zhenya and Sasha gave birth to Nikita (Nikita, Nikita?):
- Nikita inherited the sign “eye color” (parameter TakeProfit of the robot) from one of the parents - “Eugene”,
- “Growth” (the period of the moving average robot) Nikita inherited from “Sasha” ... but slightly corrected in the direction of the other parent, Eugene.
The fact is that, the smaller the dimension of the optimization space (in our case, it is equal to 2), the “closer” it will be to the progeny. Genetic optimization algorithm does not strictly determine the rules of "inheritance" of genes for the subsidiary. Therefore, randomly, Nikita borrowed the color of his eyes without changes, but his height was midway between both parents, closer to one of them. In my implementation, with the same success Nikita could borrow the original parameters from both parents.
The third step is selection.
The mover of the evolutionary process, natural selection. 4 out of 10 best individuals gave 10 more descendants. Now we have 20 individuals. Genetic optimization algorithm involves maintaining a constant population size. 10 individuals must die. In this implementation, the majority of individuals of the first generation “die”, from 80% to 100%.
Accordingly, in our example, the new generation will be composed of 0 ... 2 parents and 8 - 10 of their offspring. In other words, if you omit the lyrics, the new vectors of the parameters of the trading robot will be calculated from the vectors obtained in the previous step, the “reproduction” (combination) of the 4 best best tests. Most of the “old men” in the new iteration will not take part in the selection (other variants of the implementation of selection are possible).
Completion of the algorithm
Reproduction and selection are repeated N times. Specifically in our example, for comparison with the three algorithms tested earlier, 4 generations of 10 individuals are tested, for a total of 40 tests.
But it may happen that another population collapses. In other words, all tests will be in the vicinity of several points. To avoid this situation, several mechanisms are used, in particular:
- infusion into the “fresh blood” population. To the descendants of the current population, several new individuals are added, obtained randomly, in the same way that the initial population was formed,
- mutation mechanism: a descendant individual may have some of the characteristics (coordinates) slightly different from the characteristics of its own parents:

in this example
- the descendant characteristics of Jane and Joss - “height” and “eye color” are borrowed from each of the parents,
- характеристики особи — потомка Сэм и Сири несколько отличаются от соответствующих характеристик обеих родительских особей.
In my implementation, despite the mutations and “fresh individuals”, periodically the population had to be updated entirely to avoid premature convergence, localization of the entire population in a confined space.
If you go back to the original data on which we tested the algorithms of the Monte Carlo, the gradient descent algorithm with the working title "sea battle", the optimization process can be illustrated by the following animation:

As you can see from the animation, first arrangement of points chaotic, but with subsequent generations has trend towards areas with higher ZF values.
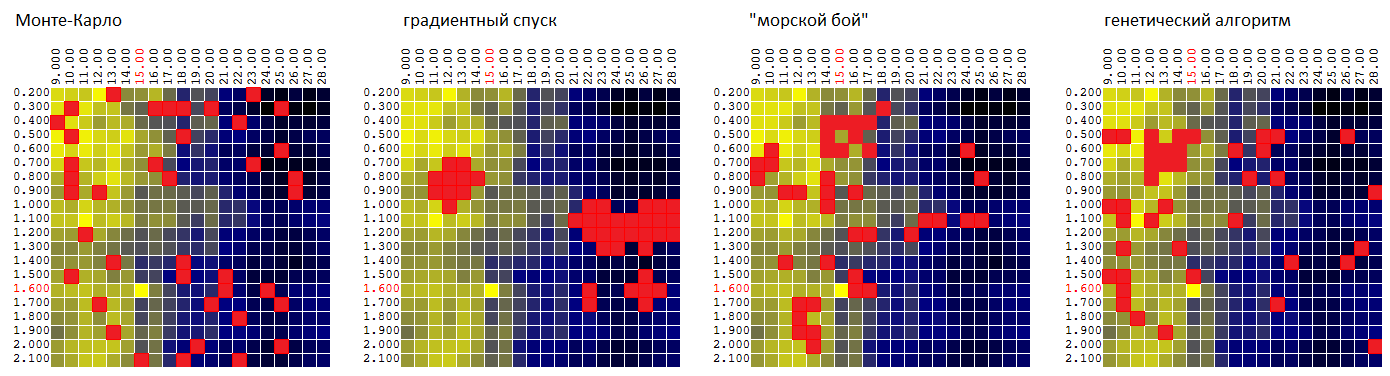
Now compare the algorithms on the same surface: P = f ( M , T ):
| Monte Carlo | gradient descent | “Sea battle” | genetic algorithm |
|---|---|---|---|
| 95.7% | 92.1% | 97.0% | 96.8% |
The average value of the found extremum of the TF as a percentage of the global value.
Of course, it’s early to judge by one set of input data, but so far the GA, with reference to our trading robot, is inferior to the “sea battle” algorithm:
- only slightly - by the average of the found quasi-optimal value of the CF,
- gives the worst estimate of the parametric stability of the trading algorithm, since it doesn’t “explore” the neighborhoods of the found quasi-optimal tuples of parameters in too much detail.
Final test of 4 optimization algorithms
The final test was conducted on 4 sets of input data - the results of the backtest of the trading strategy on 4 different segments of price history ( EURUSD : 2016, EURUSD: 2017, XAUUSD : 2016, XAUUSD: 2017).

(examples of FCs as functions of two parameters for 4 time series of prices)
This time, optimization was carried out on 3 parameters:
- “fast” moving average period
- the period of the “slow” moving average
- TakeProfit (profit on the transaction, as a percentage, at which the transaction was completed).
Each of the parameters took 20 different values. Total, to build the table
P = F (Mf, Ms, T)
where P is profit, Mf is the period of the fast moving average, Ms is the period of the slow moving average, T is TakeProfit,
20 * 20 * 20 = 8,000 iterations of testing.
Optimization was carried out with a limit of 160, 400 and 800 tests (calculations of the CF in the selected coordinates). Each time the results were averaged for 1,000 iterations of optimization. The average value of the CF for the found quasi-optimal vector of parameters was:
| Monte Carlo | gradient descent | “Sea battle” | genetic algorithm |
|---|---|---|---|
| 84.1% | 83.9% | 77.0% | 92.6% |
Separately, it is worth noting that GAs show a good result even with a small percentage of tests from the total possible number of options:
| tests | Monte Carlo | gradient descent | “Sea battle” | genetic algorithm |
|---|---|---|---|---|
| 160 of 8,000 | 79.1% | 76.7% | 73.1% | 87.7% |
| 400 of 8 000 | 84.7% | 85.0% | 77.4% | 93.7% |
| 800 out of 8,000 | 88.6% | 90.1% | 80.4% | 96.3% |
Instead of conclusion
I was somewhat surprised by the result, which showed the genetic optimization algorithm. I do not think that it is the “genetic paradigm” of the method that provided him with the first place in the list. In a sense, according to the logic of the choice of coordinates, it resembled the methods of dichotomy / golden section. It is probably worth trying one of these algorithms and comparing the GA with it.
Returning to the trading robot, it is worth noting how the “relief” of the surface formed by the CF (profit) changes from year to year. That is, “having optimized” the robot on the history of 2017 it makes no sense to apply these settings in 2018 (the first quarter, month, week ... 2018).
Artificial, dogmatic, and helpless trading strategies like ours (buying at the intersection of the moving average) probably won't go out of style soon. Other strategies, unfortunately, I was not able to meet. Accordingly, the profit or loss of trading robots I attribute, rather, to luck than to the advantages / disadvantages of the algorithm. Therefore, the task of parametric optimization of a trading robot is for me personally purely academic interest.