How to analyze paying users. Part 2, Time revenue structure
The last time we talked about how you can segment your paying users recalled RFM-analysis, as well as whales and dolphins.
This time we will also apply segmentation, however, on a completely different principle. Have you thought about your income structure? Who brings more - beginners or oldies? What is the ratio of income from new and old users, how does it change over time? We’ll talk about this.
The structure of the audience as a whole
First, we will divide our entire audience (both paying and non-paying) into several segments in time from the moment of their registration. How many segments to allocate is entirely up to you and depends on the characteristics of your business and the duration of your involvement in the project.
In any case, we would recommend limiting ourselves to 5-7 segments.
For instance:
By highlighting user segments, you can build a report on the structure of your audience at the time of analysis.
What you can see in this report:
The next step is to consider not only the structure of your audience, but its dynamics - how this structure has changed over time. Usually it is at this stage that the most interesting thing is found out.
The structure of the paying audience
We perform the same manipulations, but now exclusively for the paying audience. For an example we will address to the report “ Users & Gross structure ” in the devtodev system .
This example shows how the pitfalls are hidden behind the size stability of your paying audience, and the growth of one segment is offset by a decrease in the other segment.
We see that the percentage of newcomers (up to 30 days from the moment of registration is growing), and the percentage of old people (from 6 to 12 months from the moment of registration) is falling. And without considering the structure, we might not have noticed it.
A sign of a healthy application is that the segment of the old people should at least slowly but grow - more and more users should reach the adult segment and remain in it.
Income structure
Finally, income can be analyzed in a similar way, cutting it into segments by time from the moment of registration of users making the payment.
In the report on the structure of income, all distortions in favor of old people or beginners, as a rule, are more pronounced. The fact is that usually (in projects based on long-term retention) for beginners, the average check is small, while for old people it is quite large.
As we can see, the income in our example has a downtrend (remember that the size of the paying audience was stable at the same time). And the decrease in this trend is due primarily to a decrease in income from the elderly. Until the green segment inclusive, some stability is observed, then the fall begins.
Our verdict on the reviewed project is that the project has problems with payments from users registered 3 months ago and earlier. It is necessary to optimize the long-term retention of the project so that the natural influx of users in the last segment exceeds the natural outflow.
Mathematical modeling
Having the reports described above, you can create a mathematical model for predicting your income for several months in advance.
What is needed for this:
By combining all the calculated values into one model, you can simulate how the structure of your audience and income will change in a month, two, three, six.
Moreover, such a model will allow you to calculate various experiments with traffic and monetization.
Examples of questions that she can answer:
Etc.
With this article, we wanted to convey to you one simple thought: it is important to study the structure of your audience and income over time from the moment of registration of users. This will help you make more informed and effective decisions, whether it’s marketing, monetization or game design.
Soon, expect another article on the analysis of paying users.
This time we will also apply segmentation, however, on a completely different principle. Have you thought about your income structure? Who brings more - beginners or oldies? What is the ratio of income from new and old users, how does it change over time? We’ll talk about this.
The structure of the audience as a whole
First, we will divide our entire audience (both paying and non-paying) into several segments in time from the moment of their registration. How many segments to allocate is entirely up to you and depends on the characteristics of your business and the duration of your involvement in the project.
In any case, we would recommend limiting ourselves to 5-7 segments.
For instance:
- 1 segment - less than 14 days from the date of registration;
- 2 segment - from 14 to 30 days;
- 3 segment - from 1 to 2 months;
- 4 segment - from 2 to 6 months;
- 5th segment - from 6 months to 1 year;
- 6th segment - more than a year from the date of registration.
By highlighting user segments, you can build a report on the structure of your audience at the time of analysis.
What you can see in this report:
- If newcomers are noticeably prevailing, you have retention problems. The project cannot hold users for a long time. So - either work on retention, or think about how to monetize just the newbies (for example, make the application paid).
- If the old people noticeably prevail - this is also not good. Is everything all right with the new registrations? Maybe you should buy some traffic? Remember that the more users, the more users. But you can’t go far on old people alone - sooner or later the application will begin to fall in the ranking.
The next step is to consider not only the structure of your audience, but its dynamics - how this structure has changed over time. Usually it is at this stage that the most interesting thing is found out.
The structure of the paying audience
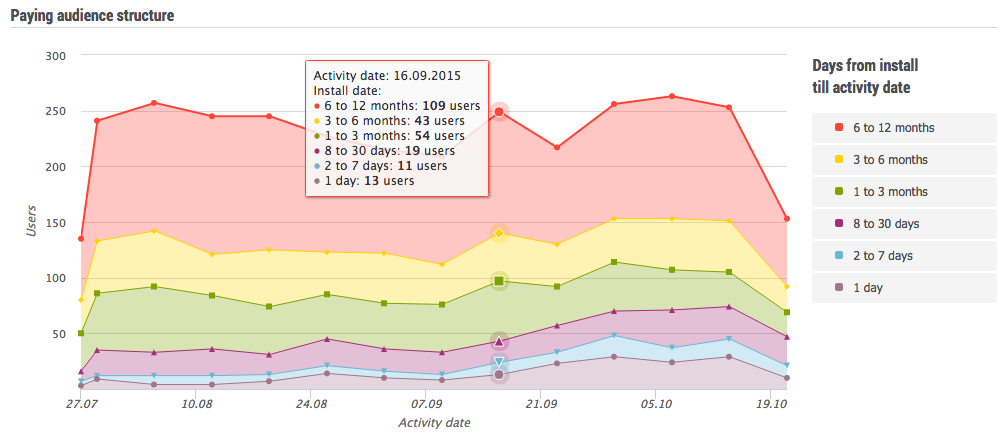
We perform the same manipulations, but now exclusively for the paying audience. For an example we will address to the report “ Users & Gross structure ” in the devtodev system .
This example shows how the pitfalls are hidden behind the size stability of your paying audience, and the growth of one segment is offset by a decrease in the other segment.
We see that the percentage of newcomers (up to 30 days from the moment of registration is growing), and the percentage of old people (from 6 to 12 months from the moment of registration) is falling. And without considering the structure, we might not have noticed it.
A sign of a healthy application is that the segment of the old people should at least slowly but grow - more and more users should reach the adult segment and remain in it.
Income structure
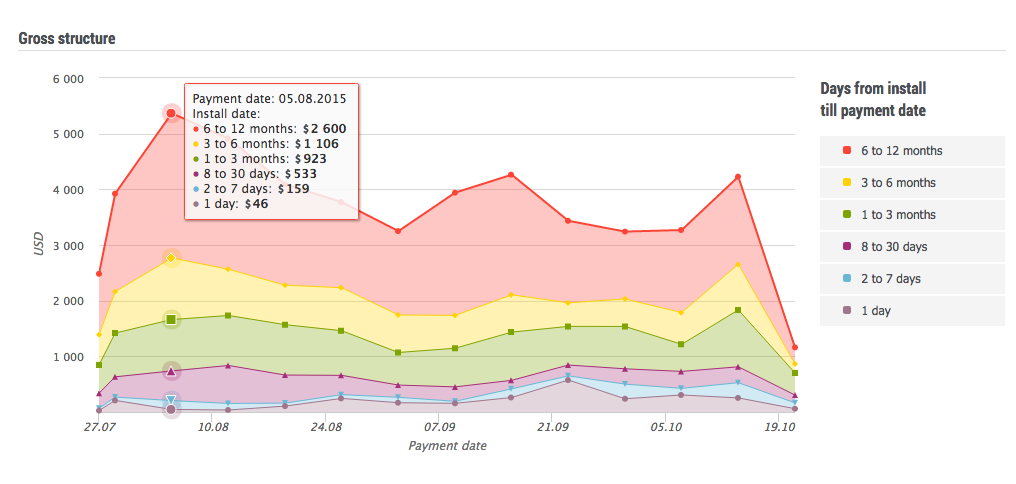
Finally, income can be analyzed in a similar way, cutting it into segments by time from the moment of registration of users making the payment.
In the report on the structure of income, all distortions in favor of old people or beginners, as a rule, are more pronounced. The fact is that usually (in projects based on long-term retention) for beginners, the average check is small, while for old people it is quite large.
As we can see, the income in our example has a downtrend (remember that the size of the paying audience was stable at the same time). And the decrease in this trend is due primarily to a decrease in income from the elderly. Until the green segment inclusive, some stability is observed, then the fall begins.
Our verdict on the reviewed project is that the project has problems with payments from users registered 3 months ago and earlier. It is necessary to optimize the long-term retention of the project so that the natural influx of users in the last segment exceeds the natural outflow.
Mathematical modeling
Having the reports described above, you can create a mathematical model for predicting your income for several months in advance.
What is needed for this:
- evaluate the size of each of the selected segments;
- for all segments, calculate the probability of transition from segment N to segment N + 1 (what is the probability that a user who is active during the month will become active in the second month as well?);
- calculate the average revenue per user (ARPU) of each segment.
By combining all the calculated values into one model, you can simulate how the structure of your audience and income will change in a month, two, three, six.
Moreover, such a model will allow you to calculate various experiments with traffic and monetization.
Examples of questions that she can answer:
- What if I turn off paid traffic and stay only on the viral? How will this affect my income in 12 months?
- If I optimize retention (for example, 30 days retention) by 2%, how will this affect the structure of the audience and income?
- I am going to make changes to the balance of the game and thereby increase the average check of users of the eightieth level (which is achieved on average after six months of the game) by 10%. How much will my income change?
Etc.
With this article, we wanted to convey to you one simple thought: it is important to study the structure of your audience and income over time from the moment of registration of users. This will help you make more informed and effective decisions, whether it’s marketing, monetization or game design.
Soon, expect another article on the analysis of paying users.