How to put metrics at the service of business
- Transfer

It is very important for any company to track effective business metrics (internal and external). Correct quantitative indicators can help motivate the team, concentrate on the primary tasks, make realistic forecasts, impress investors and build a dialogue with large companies.
One of the important skills that every novice manager or leader needs to master is the ability to create a culture based on the use of metrics.
The problem is that learning to think like a business analyst is incredibly difficult! I stayed in the shoes of Brainscape CEOsome years. All this time I learned to manage quantitative indicators correctly, despite the fact that before that I had worked in the field of economics, finance and statistics for almost 10 years. I read a lot of books and looked through endless feeds of posts, but they could not prepare me for working with business analytics.
In this article, I will try to summarize all the knowledge and skills that I have acquired during the creation of the Brainscape metric-oriented culture. I was lucky, and I had the honor to share my thoughts in the audience of the General Assembly. I also acted as the mentor of the accelerator Kaplan / TechStars EdTech . It's time to tell you about metric approaches to business development.
1. Start with a solid business model
Most of the literature on company growth indicators suggests that when you start your project, you have already identified some key performance indicators (KPIs) that you want to optimize. Want to increase user retention? Perform a cohort analysis. Want to measure audience engagement? Just calculate the ratio of daily to monthly user activity. Want to boost monetization? Decrease customer churn rate and failure rate. It’s vital for some companies to keep track of these metrics. However, all companies are different. Considering performance indicators in isolation from the specifics of the organization, you risk ceasing to see the whole picture.
I do not recommend using conditional indicators and the first tools that come across (such as Google Analytics or MixPanel). Start building a company by developing a complete table of metrics that define your business model. This could be a shared Google spreadsheet, scheduled many months in advance. This will allow all project participants to study the factors affecting business growth. Having painted the structure of the model, you better understand your project and determine the data that is right for you.
Business models can be roughly divided into two types: monetization models that help evaluate all growth factors, and market entry models that help evaluate the effectiveness of business expansion through marketing activities.
Let's take a look at them in more detail.
A. Monetization Models
You can regard monetization models simply as “bloated” profit and loss statements. In a good monetization model, in addition to money, the sources of their income are indicated.
For example, if you have a jewelry store, then the table may have the following lines:
- the number of visitors to the store;
- percentage of people talking to the seller;
- Percentage of people making a purchase
- average purchase price.
These profit indicators (they need to be calculated every month) will be interesting to other project participants. The ability to see all sources of income at once is a very important first step towards the formation of a company whose management is based on metrics. The spreadsheet below is just one way of formalizing sources of income. There are countless options for structuring business data because each company is unique. You need to create a model that fits your business specialization.
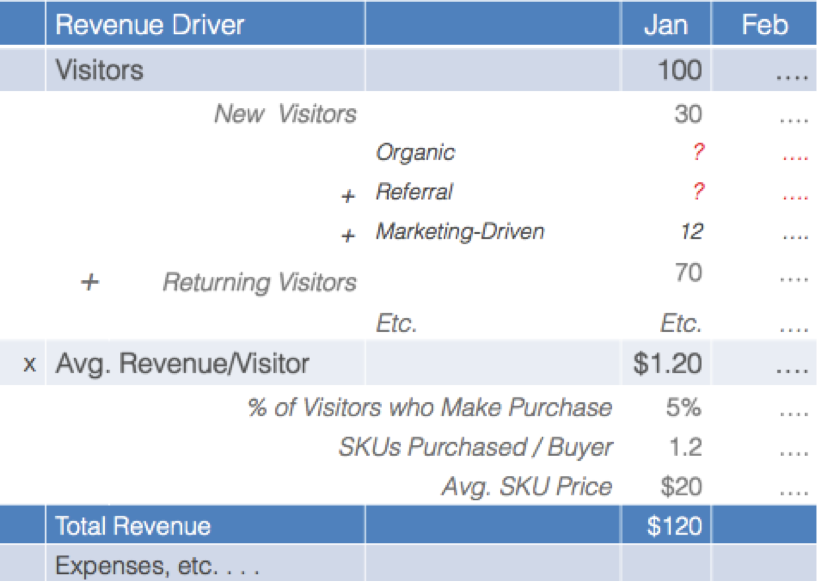
If you have defined indicators of the upper level, then you can “dig deeper” and select a few low-level ones. The image above shows a metric table for an e-commerce site. To calculate the amount of income, the following formula was applied:
Revenue = Number of visitors * Average purchase price
For a company of this type, it is important to determine the sources of customers - this will help to understand how the organization will go next month.
Remember that it will be most convenient to present the model as a hierarchical structure. Such an organization will allow you to identify gaps (points for which you do not have data) that are not able to fill the current set of tools (in the table above, such places are highlighted in red). We will solve this problem in the second section.
B. Market entry models
While monetization models are ways to optimize a business funnel, market entry models show how you can expand your business by filling this funnel with new resources. Entry patterns are of particular importance to venture capitalists, helping to determine how fast a business will develop after an infusion of cash investments and how much profit it will bring. The basis of the model for entering the market is the ratio of the profit that the client will bring to the price that will have to be paid in order to attract him (LTV / CAC).
All marketing campaigns should be conducted taking into account the ratio of LTV / CAC: you need to make sure that your unit economy really "converges."
Calculation of an indicator of LTV:LTV is much simpler than CAC. This is the amount of net profit that the company receives from the buyer, for the entire time of cooperation. Here is the formula:
LTV = Revenue / Number of customers / Months * Average duration of customer’s interaction with the company (in months)
The form of the equation may vary depending on the specifics of the company, but its essence remains the same. In particular, this applies to projects that provide subscription software, consulting firms and e-commerce sites. LTV is customer lifetime value. For a subscription software company, LTV for a monthly fee of $ 10 and an average subscription time of 10.5 months is $ 105.
CAC score calculation:Unlike LTV, CAC can take many forms: literally for each marketing channel of the company, its own indicator is calculated. To simplify it, the formula for CAC can take the form:
CAC = Cost per subscriber / Percentage of subscribers who have become customers
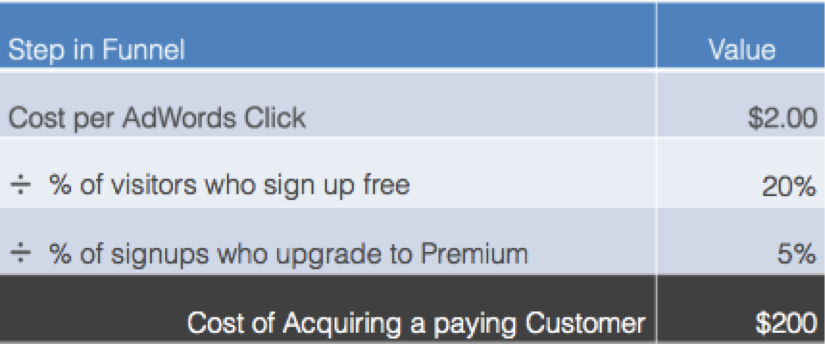
A typical example of a CAC is an ad campaign in Google AdWord. This example is so revealing that many start-ups use it to evaluate the cost of marketing while communicating with venture capitalists even before the start of an active promotion campaign. The image shows a simplified process of calculating the CAC of a marketing campaign using Google AdWord for shareware services.
In other words, in this particular example, you need to spend $ 200 on Google Ads to get one paying customer (this is only if the viral effects that accelerate the growth of the company and lower the cost of attracting a client do not interfere). If the CAC is $ 200, that's a lot. In this case, the value of the indicator LTV should be very large.
As a rule, in order to attract investor money, you need to set the LTV / CAC ratio in the amount of 3/1 (having proved at this point that there is a market for the product). You need to show investors that after paying for a marketing campaign, your business will immediately begin to grow. Even if the product is a niche, a smart businessman tries to optimize the LTV / CAC ratio - this helps to increase sales.
Any new company should build both models (it is assumed that it has all the necessary data for this). That's just the data is not an element of paramount importance. Create the right data structure framework and demonstrate the viability of the project - take care of data collection later.
2. Prepare data collection tools
Now you have a reliable framework for structuring information that will allow you to tell “the history of your company” - it remains to supply its [history] with real data, so you should take care to find the right tools for collecting them. This may include tools for web analytics (e.g. Google Analytics or Kiss Metrics), mobile analytics (e.g. Flurry), tools for polling users, financial information from Quickbox, exporting data from Salesforce.com, user queries to your database or any other set of tools that can provide the data needed to populate the table.
Perhaps you should consult with your programmers - they can help set up adequate integration, which will simplify the collection of data for each item. Do not underestimate this stage - in order to collect the necessary information, it will take some effort.
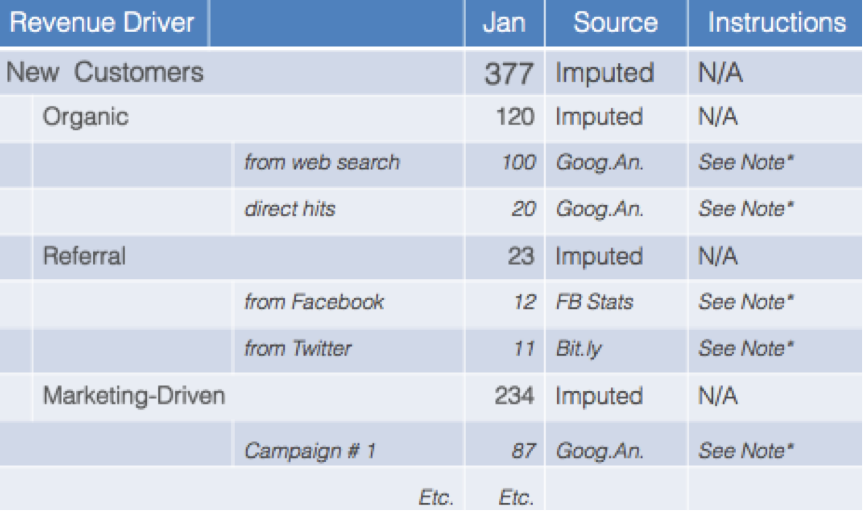
It is very important to indicate in each paragraph where the data comes from, preferably directly in the main Google spreadsheet. Thus, it will be easier for you to transfer your functions of collecting information to another person. In our Brainscape, so as not to clutter up the table, we put all the data collection algorithms in the “Notes” attached to the corresponding cells. The data collector simply hovers over the cell of interest to him and follows the instructions.
3. Define monthly data collection and sharing processes
This new general business model table with data collection techniques and clear instructions can now serve as the basis for organizing a continuous process of data collection and exchange. To do this, you will need to delegate part of your responsibilities.
A. Hire a data collection assistant
Considering that your story has a huge number of points on which you need to collect data, you should shift the responsibility for collecting them to the shoulders of a junior employee or virtual assistant. For example, the statistics of the Brainscape model are generated on the basis of more than 300 sources, which represent several complex elements of the funnel of interaction with the buyer. I would not want to manage all incoming data myself!
If your junior employees are not ready for this job (or, conversely, monotonous routine work is not the best use of their skills), you should hire a virtual assistant . Freelancers from services such as UpWork are ideally suited for such tasks and even, after some time, may start working with you on an ongoing basis.
B. Provide information collectors with adequate training
It doesn’t matter how well the data collection instructions are written: when the employee starts to process the incoming information flows, any erroneous values of the indicators will certainly begin to appear. Work closely with him (or her) [employee] and let me ask you questions. Continue to practice until you understand that the collector is 100% up to the task.
C. Set a specific schedule
Most companies collect business model data once a month. Of course, there will always be situations when you need to analyze data for a shorter period of time - for example, when you evaluate the results of an experiment or test the effect of the release of a new version of software - however, for these cases, you can always perform ad hoc analysis using the temporary table . The KPI master record is likely to exist in a single copy and is consistent with profit and loss statements as well as other reporting tools.
Regardless of the frequency of data collection, you should set a reminder in the calendar (for yourself and the data collector) to know when data for the previous period becomes available. So you will not forget to check the results and share them with other project participants.
D. Make predictions and take into account what-if scenarios
A well-organized model of business growth indicators helps to evaluate not only the work done, but also the prospects. I recommend that you draw a vertical line in the table and separate the past months from the future months (I additionally highlight future months in gray). Now you can edit the formulas in the columns of the coming months to make sure that the planned growth is consistent with the current conversion rates.
To make the tables even more visual, I thought that you could highlight the key "assumptions" in yellow. It is like saying: “Change the value of the cell and see what happens in the future.” For example, if you want to illustrate the effect of a potential improvement in user retention rate or subscriber conversion rate by 1%, you just need to fix the value in the yellow cell and see how the forecast cells change.
Here is an example business model table. See the main tab and the details tab.
E. Share the results with other project participants.
One of the best features of Google Spreadsheets is access settings. You can make it so that only you and your assistant can edit the document. At the same time, you can allow investors to view the data, and board members can comment on it. Thanks to the flexibility of Google spreadsheets, the same document can be used for different types of communication.
In most cases, I recommend immediately sharing the results with the whole team (and asking for comment). Ask for the biggest changes. Once you understand everything, share the table with the board of directors (or a group of managers) and ask them to leave comments on any cell for which they have questions. Thus, discussing KPI in a “virtual” space, it will be easier for you to do this in verbal communication.
As for investors (and potential investors), here you are free to decide when to demonstrate the data. If you want to be fully open, you can show the entire table (of course, with read-only access), but it might be worth sharing with them only a copy of the table saved in a separate file.
In general, your goal is to “automate” the process of collecting and exchanging data as much as possible so that you do not have to do it yourself every month. Creating a convincing story about a company’s activities on the basis of its indicators can be exhausting, therefore, the more delegate you can delegate data collection and exchange (be it a calendar or an assistant), the more mental resources you will have left to analyze them.
4. Analyze the data and act in accordance with the information received
Monthly team discussions of data often generate interesting conversation topics. Is the market really as big as we thought? Does this category of population really use our product more often than others? Are we really losing so many customers because of one web page? An honest and modifiable business model table makes such discussions as productive and efficient as possible.
Some indicators may not be large enough; some indicators may be higher than normal (which, sometimes, can be regarded as an advantage). Your actions are completely determined by the metric. To improve some of the performance indicators, you may need to engage focus groups, conduct A / B tests, send out emails and mobile messages, introduce new features to the product, or conduct targeted marketing campaigns. The ability to prioritize and correctly respond to changes in the value of indicators is the management skill that comes with experience.
5. Constantly recycle your model
Earlier, I mentioned that you need to automate the process of collecting data as much as possible. So, this is not entirely true. You should definitely divide the task of collecting data into blocks and transfer part of it to other people, but only with the development of the business will the model structure begin to change.
Each new function or business specialization may entail a change in the main table and a revision of all data collection instructions. You will have to update this table every time a project goes through another evolutionary round, otherwise you risk losing your understanding of your own business.
The formation of a company, the management of which is based on quantitative indicators, requires you to constantly strive to automate the collection of metrics, but this cannot be fully achieved. In his famous book “Predictable Success »Les McKeown advises executives to take more risks when creating informed decision-making structures. It is impossible to achieve great forecasting accuracy if you don’t instill in your company a culture based on metrics.
 Announcement:
On October 1-3, 2015, Moscow will host the first Russian conference on the Lean startup and Customer development: Lean Startup Russia 2015 methodologies .
You can participate in the first day of the conference for free and use the “startuphub” promo code, which gives a 10% discount on any ticket .