Greedy Dwarf: As I wrote market analytics in Lineage 2
Here comes the autumn-winter season. Outside the window, the rains and the desire to spend time outdoors are less and less. And here comes a message to me from a friend " And let's play in Lineage 2 ?". And again, I succumbed to nostalgia, agreed. We chose a fresh server at our site and created characters.
Unlike World of Warcraft in Lineage 2 is a completely different game currency mining system. It is necessary to hunt monsters all day long in order to gain profit. For me it was even a discovery that for some people RMT (Real money trading) is something of a job. Also, the game has an economy that players form. In other words, you can make money on buy-sell or buy cheap resources, from them to do things and sell at a premium. Since for us the game remains something like a rest, this is the way to get game currency was chosen by us.
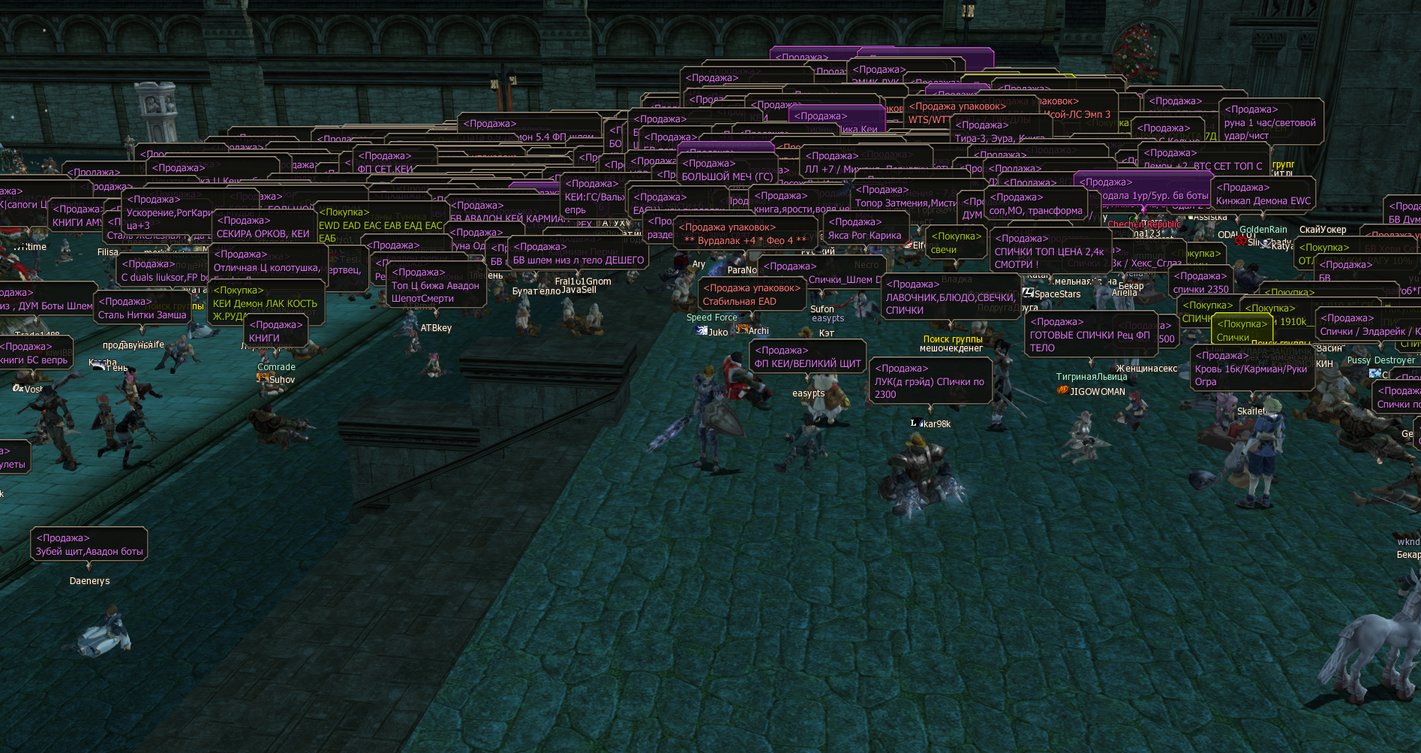
To buy and sell items, the player must be online (screenshot above). Accordingly, someone wants to quickly sell (cheaper) and someone quickly buy (more expensive). And what if the difference to sell is to buy a positive one? Just this example will be considered in the article as a result.
However, prices in the market are quite unstable and often change. Therefore, it is possible to buy something “cheap” and then sell it even cheaper to sell it with a negative profit. This is what we are trying to avoid. In general, it was decided to write a market analytics system and deal with a couple of interesting technologies for me.
Spoiler :
The following technologies will be used in the article :
Docker, DigitalOcean, NodeJs, Ktor, Prometheus, Grafana, Telegram bot notification
First was Data
In order to analyze something, we first need to get something. It was considered 2 options for obtaining information.
Sniffing - write an application that will listen to traffic and analyze it. The disadvantages of this approach are very simple. You need to be constantly online and watch the market and even according to server policy they can be banned. However, I would like minimal actions from the user and it is desirable to automate everything as much as possible.
Parsing is a site that specializes in sniffing for this game - l2on.net. Just what we need! We give the role of the raw data collector to this service. It remains only to get the data and start experimenting with them.
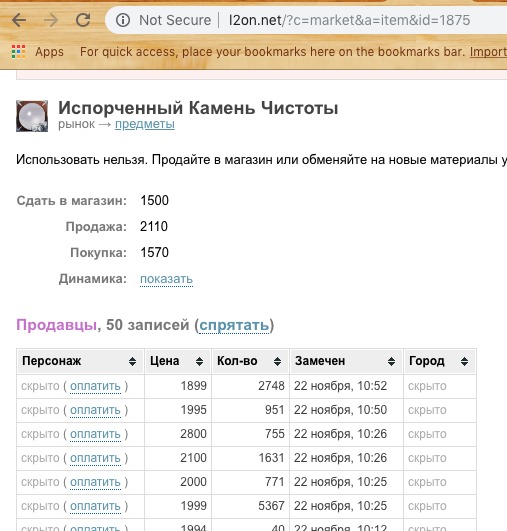
Based on the query string, we understand that we need to pass the id of the resource to obtain information on it. However, if we automate this, it is also necessary to transfer the id of the game server. After rummaging a minute in the source code of the page the following was found:

We try ... Great! We receive the list of the prices of purchase and sale.
Now you need to think with what we will parse the site.
The choice fell on Puppeteer for NodeJs.
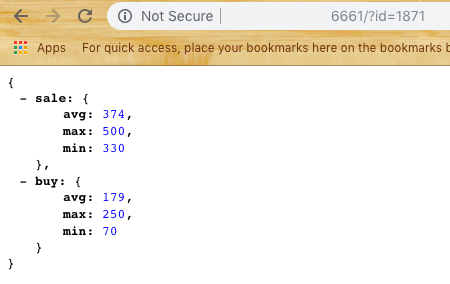
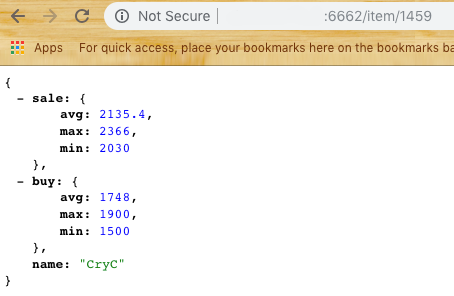
On its basis, the first module of the subsystem was created - Scrapper . Its main task is to go to the site, open, parse and return data in the form of JSON. We take a sample of the last N elements, we consider the average, minimum and maximum price. (Looking ahead, I’ll say that you need to modify the percentile for editing noise if a player puts too high a price to sell or a low one to buy) We get an answer according to the form:
Now we can move to the next part - data storage .
Suppose we have 2-3 consumers of our data and we want to give them an array. We also want to avoid frequent requests for l2on not to be added to the blacklist. So we need to create a second module that will act as an intermediary between l2on and our agents.
The survey method was chosen simple. Every 5 minutes, the module must request all items from the set list and provide output for data on one resource or output for analytics.
For this system, I wanted to try Ktor - server solution on Kotlin.
I did not use the database, and decided to store the latest data in Singleton. Yes, the decision is not the most elegant, but it’s a quick fix, and we’ll always have time to optimize.
This is how the second module of the system appeared - Harvester .
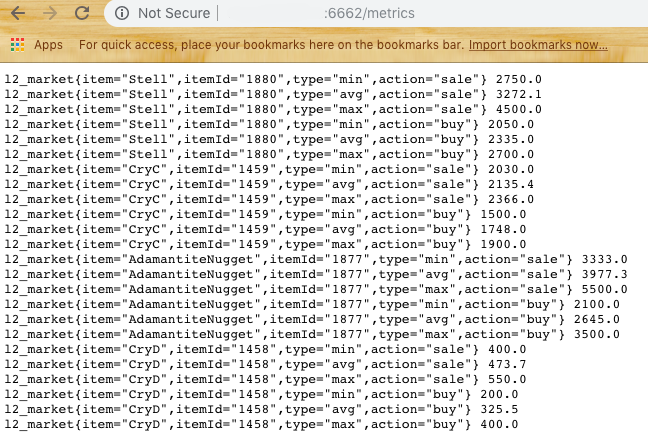
Harvester provides the user with two endpoint'a / item / {id} and / metrics
If everything is clear with the first, the latter returns the data in the format for the next system - Prometheus
Data Storage for Analytics
Intermediate link was selected Prometheus - Open Source database for analytics which works through the Pull approach. In other words, during the configuration, you need to specify in the yaml file the set of data providers and the polling frequency. In our case, this is the same / metrics endpoint.
We try to run Prometheus (by default it is port 9090) and if we see in Target something similar to:
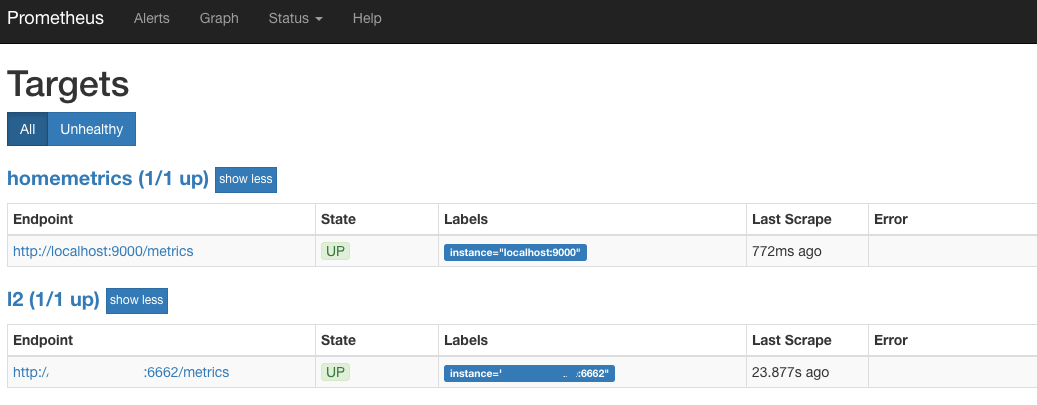
So we are going the right way. This means that every 30 seconds Prometheus goes to Harvester and picks up the latest status on all products of interest to us.
Data display
The next stage is a beautiful display of graphs.
Grafana was chosen for rendering, which is also Open Source.
Pros Grafana and Prometheus - they are available in the form of Docker containers that require a minimum of user actions.
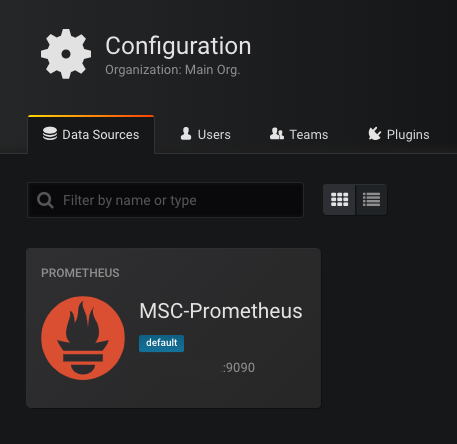
When you first start Grafana (standard port 3000), it will ask you to specify an available database. Select Prometheus as the base and prescribe the address. If everything goes well, we will see:
The next step is to draw the graphics.
An example of a request for drawing a sales schedule:
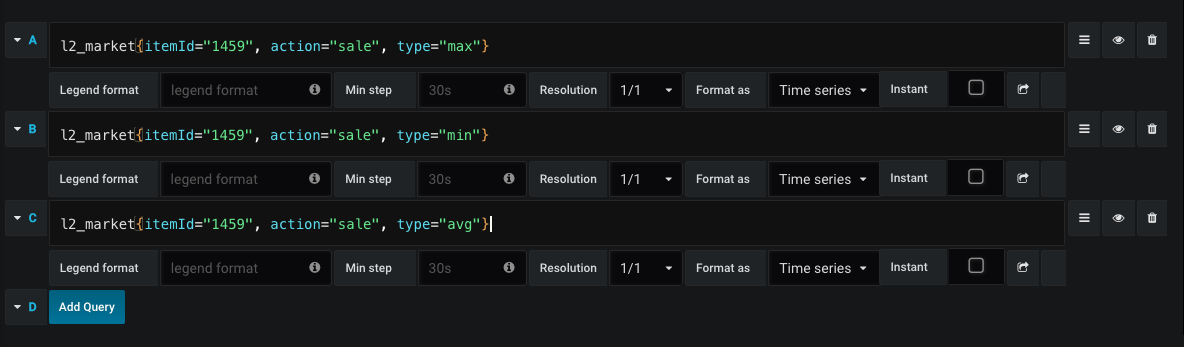
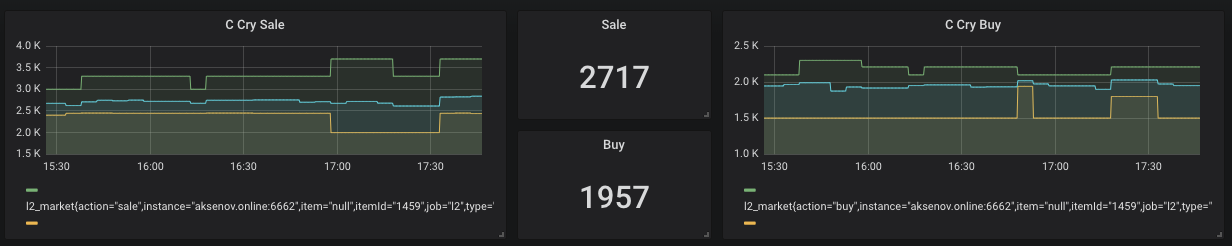
Thus, at any time we see the average price for buying and selling, as well as price dynamics.
However, there are times when the minimum sale price is higher than the maximum purchase price. This means that we can get easy money in the form of "buy sell." Telegram was selected for the notification channel. Create a bot and add its token to Grafana (yes, yes, it supports notifications)
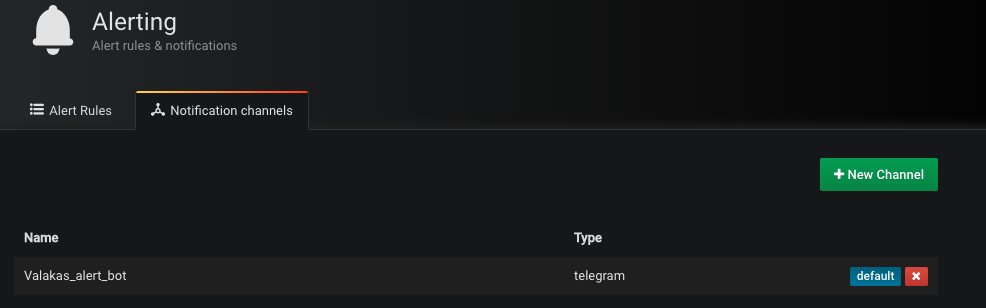
Simply set the condition under which we will receive this notice.
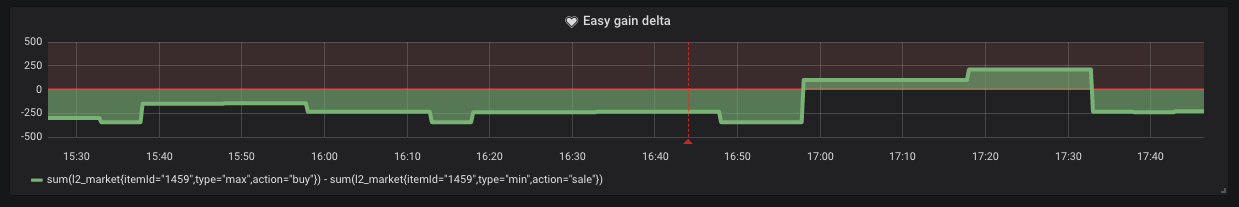
As we see from the schedule, such situations occur in the market.

Cloud
We pack each subsystem into a Docker container and load into DigitalOcean or other services of your choice. But this does not prevent us from running this entire system without a dedicated IP. Now the minimum container for DO costs $ 5 per month.
We first start the Scrapper
docker run -d -p 6661: 6661 --name scrapper l2 / scrapper: latest
Behind him Harvester
docker run -d -p 6662: 6662 -v / root / harvester: / res --link scrapper: scrapper l2harvester: latest
In the / harvester folder there should be an ids.txt file with the format
id1 name1
id2 name2
Conclusion
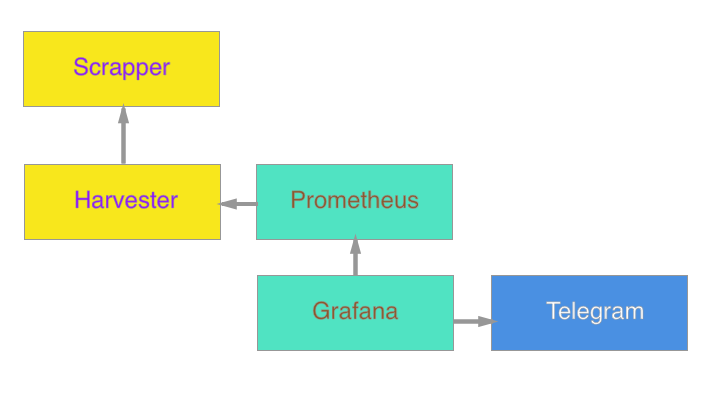
Ultimately, the system looks like this:
It is planned in the future to add an agent to update google docs, and count the cost of crafting on the fly.
I do not know whether this development will bring any benefit, but for me personally it was a good experience to refresh my knowledge in the applied field. My main specificity is mobile apps. Development of the server part is an additional skill and curiosity.
As an addition, I attach links to familiarize yourself with the code:
Scrapper
Harvester
(You can assemble containers with
docker build -t scrapper commands .
Docker build -t harvester.)
I very much hope that this article inspired someone to nostalgic feelings, or gave inspiration for some new idea. Thank you for reading the article to the end!