Spurious traffic in Google Analytics (Android app)
I accidentally discovered in the statistics left sources, of which over 4 months I had already accumulated as many as 21 pieces. In total, during this time they spoiled the picture for 88 users and 584 sessions. I carefully unloaded everything in Excel every day, twisted it, looked at the data without this traffic - the indicators changed. In particular, the conversion. Where did these left-wing users come from - it’s pretty clear, I’ve already seen these in the site’s metrics. How to clean analytics is also understandable, because they still have common properties. Why do "figures" need this - there are assumptions, but with regards to sites. Is there really too much from mobile applications?

So, we meet our "heroes":
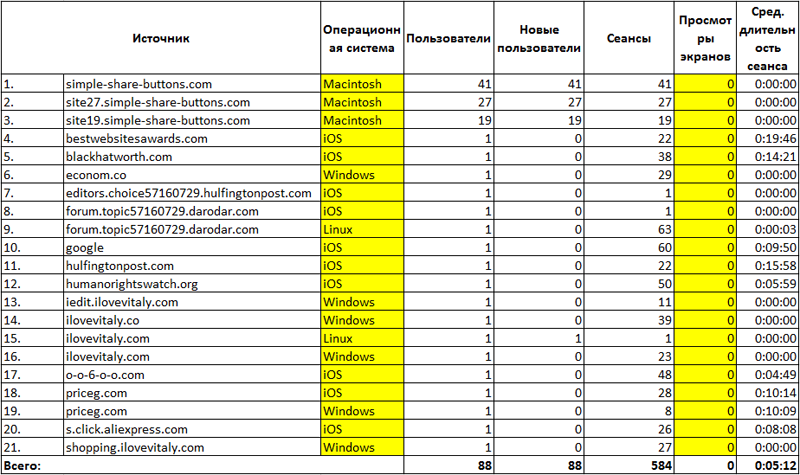
It can be seen from the picture that none of the sources uses Android, and everyone has zero screen views - these are the fields where you can configure filters in analytics. At the same time, at the beginning of the period, most sources gave “No” in the “Mobile device” field, then at the end everyone shouted “Yes”. And I, damn it, racked my brains - where did I get users with apples ... Here they are, darlings.
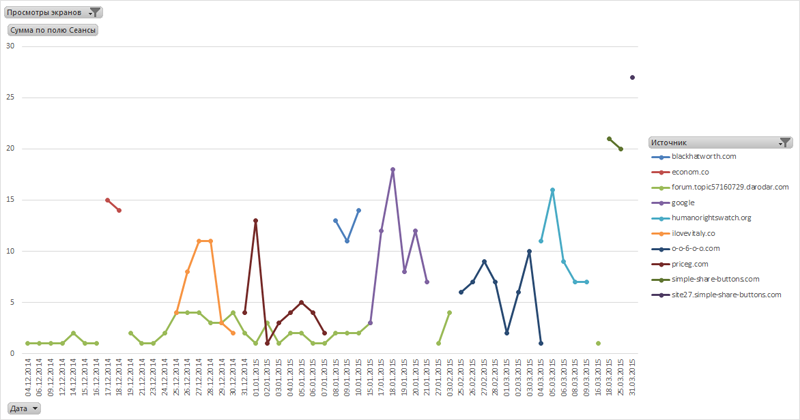
I could not resist, and tried to build a schedule by day. The same forum.topic57160729.darodar.com at one time hollowed constantly, albeit a little, then disappeared, but no, no, and it would be announced again. But simple-share-buttons.com appeared at the end of March, but immediately powerful. It may seem that some sources show continuity, but there is too little data for such conclusions. Below is a picture of the Top 10 by the number of sessions:
Has anyone else come across this? How do you fight? Share your experience.
So, we meet our "heroes":
It can be seen from the picture that none of the sources uses Android, and everyone has zero screen views - these are the fields where you can configure filters in analytics. At the same time, at the beginning of the period, most sources gave “No” in the “Mobile device” field, then at the end everyone shouted “Yes”. And I, damn it, racked my brains - where did I get users with apples ... Here they are, darlings.
I could not resist, and tried to build a schedule by day. The same forum.topic57160729.darodar.com at one time hollowed constantly, albeit a little, then disappeared, but no, no, and it would be announced again. But simple-share-buttons.com appeared at the end of March, but immediately powerful. It may seem that some sources show continuity, but there is too little data for such conclusions. Below is a picture of the Top 10 by the number of sessions:
Has anyone else come across this? How do you fight? Share your experience.