Zabbix 3.0 released
The long-awaited version of the open monitoring system Zabbix promises us a whole bunch of new features, embarking on the path of visual updates.
Today I want to share with you what the release brought, and what you can start using today by downloading the new version from the site. We will also be happy to invite everyone to the Zabbix Meetup in Moscow, details of which you will find at the end of the article.

The first thing that catches your eye is a refreshed web interface. The new design got rid of superfluous, piling up elements, various unnecessary graphical frames and so on went away.

Also, the interface has been designed from the point of view of convenience, for example, now for any network node or template you can always see how your own macros overlap with inherited ones. Several designs are available, light and dark. Be sure to try the darkside of the theme!

You can read about other interface changes here .
and also in a separate mini-review on Habré.
Now Zabbix supports encryption of all messages if necessary - all communication between the server, proxy and agent can be encrypted and protected from prying eyes.
Encryption also provides authentication - only with a trusted certificate or Pre-shared key can components communicate with Zabbix. Authentication is mutual, that is, not only Zabbix Server verifies the agent certificate, but the agent can also be configured to check the server certificate: who issued it and whether it can be trusted.

Encryption is completely optional, and can be configured for each component separately (that is, some agents and proxies can use encryption, while others continue to communicate openly as before)

If you don’t need encryption or you are not mentally prepared for it, then just use Zabbix as before (taking other new features into circulation of course! :)) At the same time, all 3.0 components will support encryption, and it can be gradually enabled for individual components at your own pace.
And no new ports - as before, 10050/10051 are used for all types of communications in Zabbix.
All details about encryption in Zabbix are here , as well as in our separate mini-review on Habré.
Anticipate the problem before it happens? - Now yes, in Zabbix 3.0.
They say that in 2016 the discs still run out of space sometimes. Zabbix can anticipate this situation and save the application from crashes, warning everyone in advance and giving time to add or free up space just before the problems begin.
Just look at an example where Zabbix predicts how quickly a place will end on / home by analyzing historical values recently.

Let's say we need 10 hours to react and add or clean a place (as in the screenshot above). And let’s say that 1 hour of free space data collected is enough to make a correct forecast. The real problem for us is when the space on the / (vfs.fs.size [/, free]) section is completely over, i.e. 0 bytes. Then Zabbix should raise the accident when the forecast for 10 hours ahead, based on the collected data for the previous 1 hour, will be 0, or:
or you can swap the forecast horizon (10h) and the threshold value (0 bytes) and use another trigger function:
The statistical analysis under the hood of these functions is the same, so just choose an expression that is more convenient.
Learn about forecasting in Zabbix here and here .
And also in our separate article on Habré on forecasting.
The new proc.cpu.util data item, available on Linux and Solaris, allows you to monitor CPU usage by each individual process or group of processes.
For example, it might be interesting for a server administrator to control how various users use the CPU. Using the key:
he will be able to see CPU usage by all processes running under john. And if only John's java is suddenly interesting:
In addition to the username and process, you can specify the type of CPU utilization (system, user), the name of the process with the path, and other parameters.
The full specification can be found here .


In 3.0, they did not forget about performance optimization. For example, the History Cache has been seriously redesigned. Thanks to the redesign of the structure, the cache is fast at any items / values ratio, even if only a few data elements fill the server with a large number of historical values.
A history index has been added to monitor this cache. You can control it using the new internal counter zabbix [wcache, index,]

For example, the graph clearly shows how long the processing of eight history syncers took 500,000 values for 100 data items before 3.0 and after.
More on this and other internal checks here .
In 3.0, the actions themselves and their conditions are also stored in the cache so as not to disturb the database once again. This innovation will come in handy on large installations and when the system has a large volume of events

If something was enough to check once a day, then it was impossible to choose the exact time. The check could have happened both at night and at lunch, and this could not be influenced in any way.
Well, now you can.
For example, if you need to collect data from office computers, then simply set the collection schedule from 9 to 6 on weekdays:

This will allow us to avoid unnecessary accidents about the unavailability of turned off computers at night.
In the example above, checks will occur every five minutes (m / 5) only on business days (wd1-5) from 8 to 18 (h9-18), that is, at 9:00, 9:05, 9:10 and so on .

Or would you like to do LLD-discovery in the dead of night to minimize the impact on the network? Yes, it can be done just as well.
Read more about scheduled intervals here .
Personal maps, integrated screens (screens) and slides appeared in Zabbix.
This allows each user to create their own representations of information that will be convenient for him. And admin rights are not needed at all.
At the same time, you can easily share a card or screen, making it available to all users, or only to members of a particular group:

Interesting? more here .
A long time ago, people asked about the possibility of using low-level detection (LLD) macros in the name in data element groups? Yes, now please, and these are prototypes of data element groups (Applications) are now available along with prototypes of data elements, triggers, graphs, and screens.
For example, for network interfaces:
The database cleanup procedure is necessary to delete old historical data. If you really need to delete a lot, then a large amount of system resources will be required, which can negatively affect other Zabbix processes, which are busy with something more important and more useful.
3.0 added the ability to cancel the scheduled cleaning procedure and start it manually when necessary. The new feature is supported by both Zabbix proxy and Zabbix server. To use it, you must disable the scheduled cleaning in the config file:
And then it is possible to start the database cleanup through the command line:
Read about this and other administrative functions (runtime-control) from the command line here .
The main Zabbix processes can now be launched not only as daemons, if you use the -f (--foreground) switch. Among other advantages, this, for example, can be useful when using Zabbix components in Docker.
The dependencies between the triggers, which allow you to get only one accident from the router, instead of a dozen accidents from the devices that are located behind it, have been in Zabbix for quite some time. But unfortunately, this did not work for trigger prototypes. Again, in 3.0 this limitation goes away. This will allow, for example, creating a group of triggers from prototypes that have different threshold values and importance level (warning and accident) when monitoring the amount of free disk space:


Details can be found here .

Those who monitor Windows servers through Zabbix should appreciate the following innovation - the ability to find all available services in Windows using the LLD key service.discovery, and create data elements and triggers for each new service. Found services can also always be filtered through the standard filter mechanism, which is in low-level detection.


For more details on how to configure this, see the updated LLD documentation again .
It happened! Now you can send out notifications simply and without problems: through the Zabbix interface, you configure the connection to the mail server using the password login, as well as encryption, if necessary. No more additional postfix in smarthost mode or uncomprehending looks from the administrator of the mail servers whom you asked to allow from the Zabbix server IP to send mail anonymously.

More details here .
Matured and patterns. Now, when loading / unloading in XML, they include all the used value mappings. You can also upload / download conversions separately. And you can now download value mappings through the API.

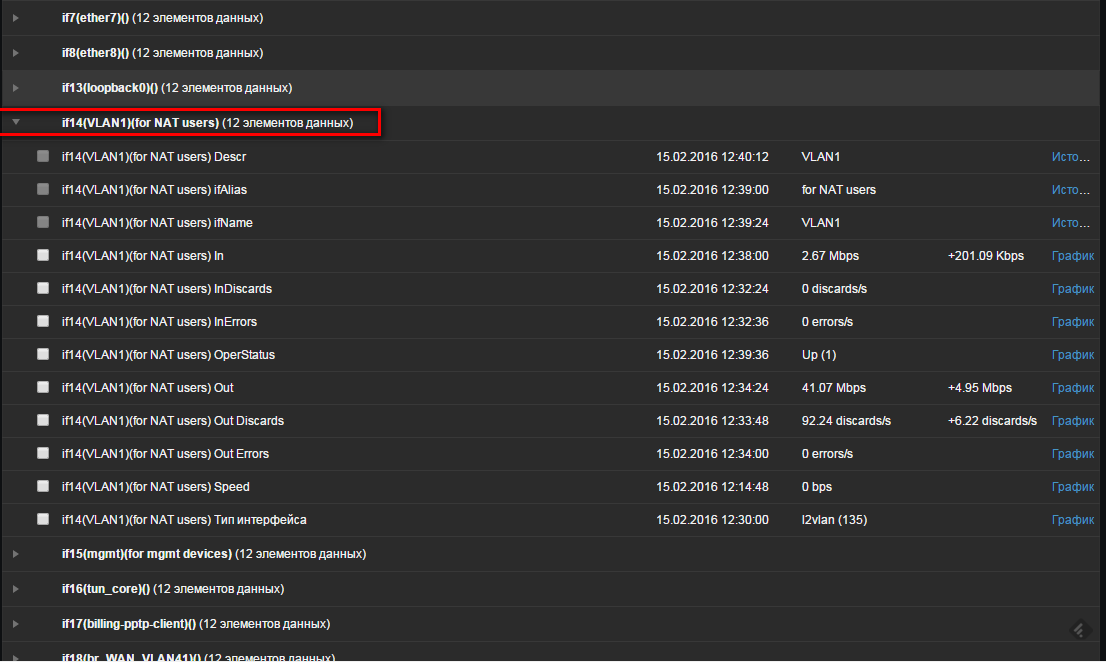
There is a great opportunity to make a decision on SNMP discovery based on not just one, but several OIDs.
For example, for interfaces, we can search immediately ifName, ifAlias, ifDescr and ifOperStatus:
And if you specify, for example, in the description of the trigger prototype of a trigger, here is a list:
then in case of an accident by a trigger we can see a detailed description of the port.

You can use the values of additional OIDs in LLD filters, to make a decision whether or not to monitor the interface, and also use the values in the names of triggers, graphs, and data elements. Or as mentioned above in the name of the groups of data elements (Applications).
Read more in the updated LLD manual .
Zabbix 3.0 offers over 50 new learning opportunities, with all that weren’t included in this article, such as the API for trends or the addition of additional parameters for custom alert scripts, see the release here .
We invite everyone to try the updated Zabbix system today and share with us their impressions online or in person at the Zabbix meetup in Moscow, which will be held on March 12, 2016, at 11:00, at the metro station Trubnaya, 2. Tsvetnoy Boulevard, 2. Registration for the meeting will be access in two weeks.
Today I want to share with you what the release brought, and what you can start using today by downloading the new version from the site. We will also be happy to invite everyone to the Zabbix Meetup in Moscow, details of which you will find at the end of the article.
Interface
The first thing that catches your eye is a refreshed web interface. The new design got rid of superfluous, piling up elements, various unnecessary graphical frames and so on went away.
Also, the interface has been designed from the point of view of convenience, for example, now for any network node or template you can always see how your own macros overlap with inherited ones. Several designs are available, light and dark. Be sure to try the dark
You can read about other interface changes here .
and also in a separate mini-review on Habré.
Encryption
Now Zabbix supports encryption of all messages if necessary - all communication between the server, proxy and agent can be encrypted and protected from prying eyes.
Encryption also provides authentication - only with a trusted certificate or Pre-shared key can components communicate with Zabbix. Authentication is mutual, that is, not only Zabbix Server verifies the agent certificate, but the agent can also be configured to check the server certificate: who issued it and whether it can be trusted.
Encryption is completely optional, and can be configured for each component separately (that is, some agents and proxies can use encryption, while others continue to communicate openly as before)
If you don’t need encryption or you are not mentally prepared for it, then just use Zabbix as before (taking other new features into circulation of course! :)) At the same time, all 3.0 components will support encryption, and it can be gradually enabled for individual components at your own pace.
And no new ports - as before, 10050/10051 are used for all types of communications in Zabbix.
All details about encryption in Zabbix are here , as well as in our separate mini-review on Habré.
Prediction and Prediction
Anticipate the problem before it happens? - Now yes, in Zabbix 3.0.
They say that in 2016 the discs still run out of space sometimes. Zabbix can anticipate this situation and save the application from crashes, warning everyone in advance and giving time to add or free up space just before the problems begin.
Just look at an example where Zabbix predicts how quickly a place will end on / home by analyzing historical values recently.
Let's say we need 10 hours to react and add or clean a place (as in the screenshot above). And let’s say that 1 hour of free space data collected is enough to make a correct forecast. The real problem for us is when the space on the / (vfs.fs.size [/, free]) section is completely over, i.e. 0 bytes. Then Zabbix should raise the accident when the forecast for 10 hours ahead, based on the collected data for the previous 1 hour, will be 0, or:
{host:vfs.fs.size[/,free].forecast(1h,,10h)}<=0or you can swap the forecast horizon (10h) and the threshold value (0 bytes) and use another trigger function:
{host:vfs.fs.size[/,free].timeleft(1h,,0)}<=10hThe statistical analysis under the hood of these functions is the same, so just choose an expression that is more convenient.
Learn about forecasting in Zabbix here and here .
And also in our separate article on Habré on forecasting.
Monitoring CPU usage by a single process or application
The new proc.cpu.util data item, available on Linux and Solaris, allows you to monitor CPU usage by each individual process or group of processes.
For example, it might be interesting for a server administrator to control how various users use the CPU. Using the key:
proc.cpu.util[,john]he will be able to see CPU usage by all processes running under john. And if only John's java is suddenly interesting:
proc.cpu.util[java,john]In addition to the username and process, you can specify the type of CPU utilization (system, user), the name of the process with the path, and other parameters.
The full specification can be found here .
Performance enhancements
History cache
In 3.0, they did not forget about performance optimization. For example, the History Cache has been seriously redesigned. Thanks to the redesign of the structure, the cache is fast at any items / values ratio, even if only a few data elements fill the server with a large number of historical values.
A history index has been added to monitor this cache. You can control it using the new internal counter zabbix [wcache, index,]
For example, the graph clearly shows how long the processing of eight history syncers took 500,000 values for 100 data items before 3.0 and after.
More on this and other internal checks here .
Action cache
In 3.0, the actions themselves and their conditions are also stored in the cache so as not to disturb the database once again. This innovation will come in handy on large installations and when the system has a large volume of events
Run checks at a specific time
If something was enough to check once a day, then it was impossible to choose the exact time. The check could have happened both at night and at lunch, and this could not be influenced in any way.
Well, now you can.
For example, if you need to collect data from office computers, then simply set the collection schedule from 9 to 6 on weekdays:
This will allow us to avoid unnecessary accidents about the unavailability of turned off computers at night.
In the example above, checks will occur every five minutes (m / 5) only on business days (wd1-5) from 8 to 18 (h9-18), that is, at 9:00, 9:05, 9:10 and so on .
Or would you like to do LLD-discovery in the dead of night to minimize the impact on the network? Yes, it can be done just as well.
Read more about scheduled intervals here .
Custom maps, screens and slides
Personal maps, integrated screens (screens) and slides appeared in Zabbix.
This allows each user to create their own representations of information that will be convenient for him. And admin rights are not needed at all.
At the same time, you can easily share a card or screen, making it available to all users, or only to members of a particular group:
Interesting? more here .
Macro item group names
A long time ago, people asked about the possibility of using low-level detection (LLD) macros in the name in data element groups? Yes, now please, and these are prototypes of data element groups (Applications) are now available along with prototypes of data elements, triggers, graphs, and screens.
For example, for network interfaces:
Force database cleanup
The database cleanup procedure is necessary to delete old historical data. If you really need to delete a lot, then a large amount of system resources will be required, which can negatively affect other Zabbix processes, which are busy with something more important and more useful.
3.0 added the ability to cancel the scheduled cleaning procedure and start it manually when necessary. The new feature is supported by both Zabbix proxy and Zabbix server. To use it, you must disable the scheduled cleaning in the config file:
HousekeepingFrequency=0And then it is possible to start the database cleanup through the command line:
zabbix_server -R housekeeper_executeRead about this and other administrative functions (runtime-control) from the command line here .
Ability to work Zabbix components in the foreground
The main Zabbix processes can now be launched not only as daemons, if you use the -f (--foreground) switch. Among other advantages, this, for example, can be useful when using Zabbix components in Docker.
Dependencies between trigger prototypes
The dependencies between the triggers, which allow you to get only one accident from the router, instead of a dozen accidents from the devices that are located behind it, have been in Zabbix for quite some time. But unfortunately, this did not work for trigger prototypes. Again, in 3.0 this limitation goes away. This will allow, for example, creating a group of triggers from prototypes that have different threshold values and importance level (warning and accident) when monitoring the amount of free disk space:
Details can be found here .
Windows Services Discovery
Those who monitor Windows servers through Zabbix should appreciate the following innovation - the ability to find all available services in Windows using the LLD key service.discovery, and create data elements and triggers for each new service. Found services can also always be filtered through the standard filter mechanism, which is in low-level detection.
For more details on how to configure this, see the updated LLD documentation again .
Authenticated SMTP
It happened! Now you can send out notifications simply and without problems: through the Zabbix interface, you configure the connection to the mail server using the password login, as well as encryption, if necessary. No more additional postfix in smarthost mode or uncomprehending looks from the administrator of the mail servers whom you asked to allow from the Zabbix server IP to send mail anonymously.
More details here .
Import and export value conversions
Matured and patterns. Now, when loading / unloading in XML, they include all the used value mappings. You can also upload / download conversions separately. And you can now download value mappings through the API.
Low-level SNMP discovery across multiple OIDs at once
There is a great opportunity to make a decision on SNMP discovery based on not just one, but several OIDs.
For example, for interfaces, we can search immediately ifName, ifAlias, ifDescr and ifOperStatus:
discovery[{#SNMPVALUE},ifOperStatus,{#IFALIAS},1.3.6.1.2.1.31.1.1.1.18,{#IFNAME},1.3.6.1.2.1.31.1.1.1.1,{#IFDESCR},.1.3.6.1.2.1.2.2.1.2,{#IFTYPE},ifType]
And if you specify, for example, in the description of the trigger prototype of a trigger, here is a list:
Last Discovery Interface info:
ifAlias:{#IFALIAS}
ifName:{#IFNAME}
ifDescr:{#IFDESCR}
ifType:{#IFTYPE}
then in case of an accident by a trigger we can see a detailed description of the port.
You can use the values of additional OIDs in LLD filters, to make a decision whether or not to monitor the interface, and also use the values in the names of triggers, graphs, and data elements. Or as mentioned above in the name of the groups of data elements (Applications).
Read more in the updated LLD manual .
And that's not it
Zabbix 3.0 offers over 50 new learning opportunities, with all that weren’t included in this article, such as the API for trends or the addition of additional parameters for custom alert scripts, see the release here .
We invite everyone to try the updated Zabbix system today and share with us their impressions online or in person at the Zabbix meetup in Moscow, which will be held on March 12, 2016, at 11:00, at the metro station Trubnaya, 2. Tsvetnoy Boulevard, 2. Registration for the meeting will be access in two weeks.