Monitoring at hand on IxoraRMS. Fast and tasteful
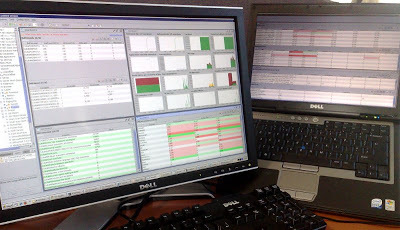
Sometimes a problem with the application results in a small nightmare, rebus. Call it what you want. I want to share about the experience of using monitoring tools by developers on one of the projects. Habr is multifaceted and there are already dozens of articles about products that facilitate understanding of what is happening: cacti - habrahabr.ru/post/179391; zabbix - habrahabr.ru/post/137641; collectd - habrahabr.ru/post/93205; regular JVM tools - habrahabr.ru/post/147008 (supplement).
I'll try to talk about another small universal and lightweight product in this category - IxoraRMS.
Anyone interested, welcome to cat.
Prehistory
We have CentOS 6.5, JDK 1.7, JBoss AS 7.1, DBMS Linter and the Hibernate / JPA application, Seam, RichFaces and strange behavior. After about a week of work, the application’s performance degrades significantly, the web interface in terms of speed causes complaints from users and is “given” to developers (in one place).
Debugging, profiling tools show the problem in one of the functions -autoFlushIfRequired. Having studied a ton of articles about optimization and Hibernate problems, having covered his code in the debugger, we decide to observe the picture more widely.
You can, of course, set up a system for collecting statistics and monitoring Cacti / Munin / Zabbix, etc., but if you do it well and correctly, then this is another task and within the organization it is not our responsibility. Therefore, we take a simple one, which will require a minimum of movements on the local machine. There are separate tools for Java profiling and monitoring, but I want to see the picture as a whole (OS, DBMS, application server, java and the application itself), because the source of the problems is elusive. Since we love Java, in terms of the tool we choose IxoraRMS (it is in Java! Hurray!) (I’ll make a reservation right away, I have nothing to do with the product or its authors). The product is open source, so the field for improvements is open. You can look at www.ixorarms.com , code.google.com/p/ixora-rms ,github.com/danielm777/ixora-rms .
Highlights why IxoraRMS was chosen from Munin, Cacti, collectd:
- Lightness and usability (this is a simple desktop Java + Swing application, without a database, the need for deep knowledge of Linux administration and the build process from source code)
- There are agents and providers to collect all indicators, many are ready to use. In many cases, receiving data from the system / source can simply be described in the interface without lines of code.
- Examples of monitoring the OS, DBMS, web server and JMX out of the box (not without a file in a specific configuration)
- Many charts, ready control panels.
- If a disk, service, EJB component or something else is added / removed, then the information on the graphs can change dynamically, without the need for reconfiguration.
- It runs the same under Linux / Windows (it is important, since most of the developers in our project work in the Windows environment).
Examples of what you can see on the screen after setup


Briefly about IxoraRMS
This is a java application that can be run as a gui client, or as a console application. At the same time, your agent can be used to start and collect statistics on a remote machine (we did not want to put anything on the server’s production) or it can be collected locally with a network connection to a remote machine (our case). This option can also be useful when you come to the customer to diagnose a problem (yours or someone else's).
What can IxoraRMS:
- Group all information on control panels and screens.
- Draw graphs of various indicators.
- To display tables and lists with indicators, including non-numeric ones, there is filtering.
- Record and lose the log, including the status of all control panels and graphs, tables, lists in time.
- It has many configured agents for the OS, DBMS, web servers and application servers, java (JMX) for collecting indicators and customized control panels for them in one click.
- All other agents and providers are finalized based on Process, SQL or Java templates through a graphical interface or hands in XML. If desired, you can add a provider in Java
- Baselines can be processed using built-in functions and JavaScript.
- Has a system for setting alerts when an event occurs (for example, the processor load is more than 80% for 3 minutes).
- It is possible to run tasks (scripts) on a schedule or on monitoring events.
Concept
When starting monitoring for each server, an entity tree is constructed with indicators (analogy to the JMX model), which contains hosts, agents, entities and counter indicators by nodes. All this is updated, by default, with an interval of 5 seconds. The node diagram is not rigid, i.e. nodes can be formed dynamically (for example, on each disk, process, processor, etc.) depending on the current configuration / situation on the server and monitoring settings.
Agents that determine the source of information are added to each host. For each agent, providers are defined that provide small pieces of information in the form of indicators in the tree. Providers can be described for each version of their software.
There is an initial set of ready-made agents with providers.

We can construct everything else using the interface or by editing XML files in the config folder. Charts, tables, lists can be built by selecting indicators or defining a list of them with regular expressions. Ready-made views and control panels can be configured for any level of the tree: global for the session / all hosts, for the current host, for the agent, etc. down the hierarchy of entities. Agent and providers can optionally provide a different set of entities and indicators depending on the level of monitoring detail set (maximum, high, medium, low). If necessary, you can write the provider code in Java.
After adding an agent, each entity (node) in the tree can have two D (ashboard), V (iew) icons next to it, which mean that there are ready-made settings for viewing indicators. This can and should be used to minimize effort. Here is an example when you added an agent for Linux.

Dark blue arrows indicate that the nodes have indicators currently being updated for monitoring (it is convenient to use it when debugging new providers and views).
And immediately the finished panel with indicators (a picture after several minutes of work and changing the names of the panel and windows with views):

Now briefly and step by step
Step 1. Download and run the IxoraRMS graphical shell
In the folder with the distribution installed, run:
console.bat
Note: You can start and stop the local agent (host manager, hmStart and hmStop, respectively) and run in batch mode (batchStart, batchStop).
We create a session and add our host (CentOS 6.5 on it) to the list of servers for monitoring.
For our host, select Add Agents from the context menu. We can see which agents are already present in the repository. For our tasks, we need agents for CentOS (Linux), Linter, Java (HotSpot or JMX), JBoss 7.1 (JBoss or JMX). Due to the lack of development since 2011, agents for software products are either outdated or initially had no support. Therefore, the next steps are devoted to customizing the application to our requirements.
To be able to make corrections to the built-in agents and providers in the interface, we restart the console with the -Dapplication.dev = true parameter when starting for java. We edit and run the console.launch.bat file for this (it is regenerated when console.bat starts, be careful!).
Step 2. Monitor the OS
For CentOS 6.x, a suitable agent exists (Linux), but the supported versions are only RedHat 9 and RedHat AS 3. If you select RedHat 9 and then start monitoring, not all graphs come to life, errors appear in the IxoraRMS log. Providers for the Linux agent work using the iostat, mpstat, vmstat utilities, so we install the sysstat and procps packages from the repository on the host.
yum install sysstat procps
Using one provider as an example, let’s try to figure out how they are configured. To do this:
• open the Tools / Agents Installer menu
• find Linux and click Edit
• add “CentOS 6.x” to the list of System versions

When displaying the control panel for RedHat 9, errors related to the File system data and Disk data providers appear in the log. To fix it, proceed as follows:
• open the Tools / Provider manager menu;
• select the Linux agent, the Disks data provider (RedaHat 9, RedHat AS 3)
• create a copy based on it using Create Like, indicating the previous name and another version;

• in our case, the provider uses Process, which redirects the standard output stream from the specified command to the parser. The flow is obtained from running the command locally or via telnet / ssh with the transfer of the command to them;
• you can run this iostat –d –x 5 command on the host console with CentOS to see the output format ({tick} - a standard parameter with the current monitoring interval)

• Now compare the output to the screen and the parser settings;
• switch to the Parser tab;
Here are the rules by which nodes (entities) and indicators are formed in the tree. Each source data column can form an entity by specifying the entity path relative to the agent and a metric value based on the column number. In short, a data model for monitoring is formed here.

• the columns in the iostat output relating to the 7th and 8th columns of the output “Kilobytes read per second” and “Kilobytes written per second” are missing in CentOS with the same command line, therefore we delete them;
• the Descriptors tab stores the types of indicators and their description for the legend. In our case, the rows for deleted metrics will simply disappear;
• save the provider.
Thus, comparing the output of the utilities used with the specified parameters, we bring the providers for CentOS in order. You can do the same work by hand, fixing the files:
• config / agents / agents.linux / agent - general description of the agent;
• config / repository / agents.linux / agent.db - control panels at the agent level;
• config / repository / agents.linux / agent.pi - configured instances of providers;
• config / repository / agents.linux / entity.db - control panels for entities;
• config / repository / agents.linux / entity.dv - customized representations for entities.
These providers use telnet / SSH connection to the host through which the utility is remotely launched, and all output is converted to entities and metrics after parsing. Therefore, when adding an agent, you have to specify a login and password for connection. The password is stored in the session description on disk in encoded form.
The agent as a whole has a lot of collected indicators from different utilities and when starting on the host, in our case 5-6 open ssh sessions hang (if we try through the HostManager, I will write later, the developers do not recommend this option so that the agent does not introduce large distortions with preprocessing into the observed system). Total resource consumption <1%.
After adjusting the agent and providers, we remove the Linux agent from the host tree from the entity tree and add it again with the choice of CentOS 6.x. We start monitoring and immediately turn on the ready-made System overview control panel (available in the agent’s tree). Now we see everything that was interesting to us in the OS.
The final Linux agent file with the version for CentOS 6.x for import can be found here (Ixora RMS has import / export).
So we monitor the OS, then the DBMS.
Step 3. We analyze the operation of the DBMS
There is no ready agent for DBMS Linter . Therefore, in this case, the path is slightly longer.
We will control the operation of the DBMS based on the following available information:
• SYSTEM. $$$ CHAN system view with a list of channels;
• system representation SYSTEM.SYSINFO with aggregated information on input-output from the moment of start.
To connect to the database, we use the JDBC driver from the LINTER distribution kit - jdbc / linjdbc-1.4.jar. It’s better to copy it to a folder
Based on these tables, the following information is available to us:
• number of open channels (Connection + Statements);
• the maximum possible number of open channels;
• number of blocked channels;
• the number of active (unclosed) transactions through the channels (core 6.0.16.x and higher);
• lifetime of the “oldest” active transaction (sec) (kernel 6.0.16.x and higher);
• total number of completed transactions;
• total number of logical entries (in cache);
• total number of logical reading pages (from the cache);
• total number of physical write operations (to disk);
• total number of physical read operations (from disk);
• total number of SELECT operations.
It is proposed to divide these indicators into 3 providers with the following
Connection data data model : Connection / [Opened, Locked, MaxAvailable]
Transaction data: Transaction / [Total, Active, MaxAge]
Input / Output: Statistics / [Block logical reads, Block logical writes, Block reads, Block writes, Selects]
Now we create a new agent as follows:
• open the Tools / Agents Installer menu and click the Install button in the dialog;
• Next, select Custom agent installation;
• as the Agent Template, select SQL;
• fill in the properties of the Linter agent as follows:
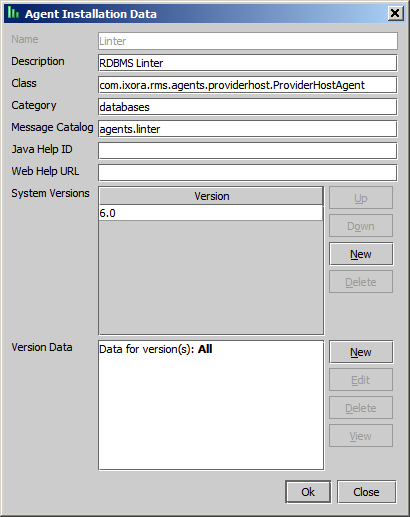
• now open the menu Tools / Provider Manager;
• select the Linter agent and click Add to create the Connection Data provider;
• select the type of SQL provider and fill in the appropriate fields
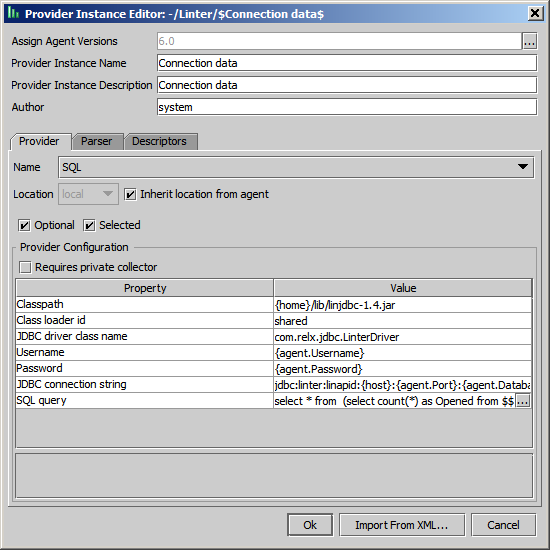
• you can specify special variables {host}, {agent.Username}, etc., which are defined in the session or the properties of the agent when it is added to the host, as field values;
• to obtain the required indicators we use an SQL query of the form:
select * from
(select count(*) as Opened from $$$CHAN where STATUS<>'') a,
(select count(*) as Locked from $$$CHAN where STATUS<>'' and LOCKED_BY<>0) b,
(select count(*)-1 as MaxAvail from $$$CHAN) c
• on the Parser tab, describe the generated entities and indicators based on the values of the columns in the sample;

• on the Descriptors tab we describe the types of indicators and their description

Similarly, we add 2 more providers based on the following SQL queries:
1.
select * from
(select TRANSACTIONS_COUNT as Total from $$$sysinfo) a,
(select count(*) as Active, NVL(DIVTIME(2, min(TRANSACTION_START), SYSDATE),0) as MaxAge from $$$chan
 where STATUS<>'' and PARENT_CHANNEL!=0 and TRANSACTION_START > '01.01.1900') b
2.
select READ_BLOCKS, READ_LOGICAL_BLOCKS, WRITE_BLOCKS, WRITE_LOGICAL_BLOCKS,SELECT_COUNT from $$$sysinfo
Now you can add the agent to the host by filling in the database connection parameters under the SYSTEM user.
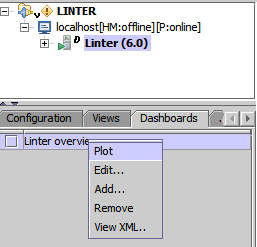
To display indicators, we build a control panel from these providers using the Add / Use Wizards context menu in the Views section.
For large indicators, we use a little trick: instead of absolute values, we show the increment of the indicator over the monitoring interval, thereby observing the load intensity. To do this, add a description of the function in XML with a description of the view (view) by clicking the Edit button on the finished view.

IxoraRMS has built-in functions for aggregation and integration with JavaScript for arbitrary manipulations (see details here www.ixorarms.com/documentation/user-guide/functions )
You can also set alarm events for the view. For example, for a channel pool in a DBMS, when using it more than 90%, you can notify the administrator within 10 seconds.
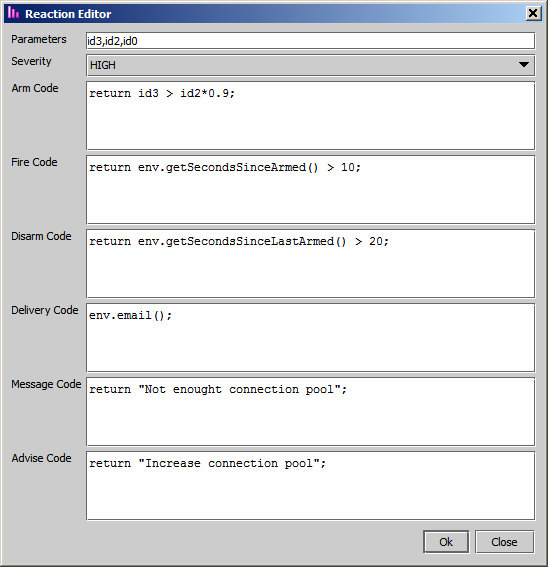
Settings for the distribution server are configured in the general menu Configuration / Setting.
After simple manipulations with building views through the wizard, we get the following control panel for the DBMS.

To simplify the control panel settings, its description is placed in the agent description by editing XML files in the repository folder. Now to view the control panel for any host, just connect the agent and activate the finished panel.
The final agent for DBMS Linter can be taken here .
Step 4. JVM
By JVM I wanted to see: the distribution of Survivor / Eden / Old / PermGen memory pools, the cost of garbage collection, threads. For monitoring JVM from Oracle / Sun there is a ready-made HotSpotJVM agent that uses a JMX connection. To connect to a virtual machine running JBoss AS, you can use the remoting-jmx protocol, which is open by default on port 9999 and supports authorization of users included in ManagementRealm.
In order for the HotSpot JVM agent to use this protocol, it is necessary to put the jboss-client.jar file from the JBoss As 7.1 distribution folder in the / jars folder and replace the log4j.jar file version with version 1.2.12 and higher (for example, log4j comes as part of the JBoss AS 7.1 distribution -1.2.16.jar). The agent description in the file config \ agents \ agents.hotspotjvm \ agent is adjusted, we add jboss-client.jar to the description.
….
/jars/AgentHotspotJVM.jar /jars/RMSJMX.jar /lib/javax77.jar /jars/jboss-client.jar After changing the agent description, we overload IxoraRMS.
To add a user to ManagementRealm we use a script
Now you can add the agent to the host by specifying the appropriate parameters:

After adding an agent, a control panel is immediately available for it. If you use it, we get the following picture:

Only the JVM Throughput view, which shows the performance as a percentage of the total consumed time minus the time to collect garbage, is functional. Because In the calculations the parameters of specific garbage collectors are used, the representation needs to be adjusted for each version of the JVM launch. We did not begin to correct this idea.
An agent with our configuration fixes can be downloaded here .
Step 5. Now the application server queue
What I want to know:
• The number of open web sessions, errors and the load on the transmission of information (received / transmitted bytes).
• The number of transactions (total and completed with rollback).
• JMS message queues (current queue size).
• Hibernate (Infinispan) second level cache statistics (by region: cache size, hit percentage, read / write ratio).
• Pool of EJB / MDB components (by components: how many are created / free / used)
• Statistics on web services (by entry points: total number of requests and with errors).
Ready Agent for JBoss AS only supports version 4.0 servers. and 4.2 via JNDI with jnp access. Therefore, to monitor JBoss AS 7.1, you need to use the standard JMX JSR160 agent (see the example and configuration above for the HotSpot JVM agent, including updating the agent description for working through remoting-jmx).
Note: The latest Ixora RMS source code already contains support for JBoss AS 5.x based on JMX JSR 160, but the compiled version is not yet available.

Specifying values in the Root folder and classpath fields is not enough, because the SPI mechanism is used to search for the protocol, and jar files from the Classpath field for the agent are loaded by a separate classloader.
After successfully connecting the agent to the host, the hierarchy of JMX entities (nodes) is immediately displayed in the tree.

For an example of constructing the graphs and lists we need, we will consider how to organize monitoring of information on the second-level cache.
Information about the Infinispan regions is presented in JMX by the following entities and indicators:

To display the number and percentage of hits in the cache in the form of a table with columns, you can use the XML editor from the context menu on the Views tab. Before that, it is better to activate the jboss.infinispan node in the tree in order to save the constructed view to this node. After editing we get the following XML:
Cache regions statistics Infinispan cache regions hits statistics customer A few comments on it: resource is a data source (indicators from the tree) to display. They are set using the absolute path in the tree or relative. A path can include regular expressions that identify multiple sources. For each source, you can define iname, name attributes that define a unique identifier for the resource and its displayed name. For a detailed description, see the website in the section http://www.ixorarms.com/documentation/user-guide/concepts
Various display options can be used: graphs, tables with many columns, property lists and viewing logs. In our case, the simplest table is used.
We determine the elements we need in the tree of indicators for the JBoss AS server and, to simplify access to them, we then form all the representations at the entity level jboss.as, jboss.infinispan, jboss.ws, respectively. To monitor various services, we use the following entities and their indicators in the IxoraRMS notation:
| Web server | - / - / root / jboss.as / jboss.as: subsystem = web, connector = http. * , metrics: bytesSent, bytesReceived, requestCount, errorCount |
| Cache | - / - / root / jboss.infinispan / (jboss.infinispan: type = Cache, name = (. *) ,. *, component = Statistics) , metrics: hits, hitRatio, readWriteRatio, numberOfEntries, evictions |
| Web Services | - / - / root / jboss.ws / jboss.ws: context =. *, endpoint = \ w + $ , metrics: RequestCount, FaultCount |
| EJB components | -/-/root/jboss.as/jboss.as:deployment=.*,subsystem=ejb3,stateless-session-bean=.*, -/-/root/jboss.as/jboss.as:deployment=.*,subsystem=ejb3,message-drive-bean-bean=.*, показатели: poolAvailableCount, poolCurrentSize, poolCreateCount |
| Очереди сообщений | -/-/root/jboss.as/jboss.as:subsystem=messaging,hournetq-server=default,jms-queue=.*, -/-/root/jboss.as/jboss.as:subsystem=messaging,hournetq-server=default,jms-topic=.*, показатели: messageCount |
| Транзакции | -/-/root/jboss.as/jboss.as:subsystem=transactions, показатели: numberOfTransactions, numberOfInflightTransactions, ,numberOfCommitedTransactions, numberOfAbortedTransactions, numberOfApplicationRollbacks |
Regular expressions allow you to specify whole samples of entities instead of concrete ones.
As a result of the settings for JBoss AS, we get the control panel with graphs and tables, presented below (after pressing the Start button).

We unite all the views into a single control panel and save them at the JMX JSR 160 agent level under the name "JBoss AS 7.x Overview". This is done by the wizard on the Dashboards tab for the selected entity in the tree. All settings for views and control panels are automatically saved in the agent settings. JMX JSR 160 Agent with settings for JBoss AS can be downloaded for import here .
All control panels can be placed on various screens in IxoraRMS and switched between them to monitor various system indicators.

Total in our experience
Pros:
- Received provider settings for our configuration
- if necessary, we quickly complete the graphs and tables during the monitoring process without restarting;
- we see in a comprehensive way everything that happens with our server;
- To monitor the test server, now it works for a minute connecting the right agent.
And a few minuses:
- The project has not been supported since 2011 and it is necessary to update agents and providers if necessary;
- In case of several unsuccessful interruptions of the JMX monitoring application, the interface on the JBoss side does not respond at all later (this is more likely a JBoss problem, but the production server will have to be restarted if further monitoring is necessary);
- The log player on the monitoring interval of 2-3 days or more is uncomfortable, responds slowly in the interface, slows down. True, the size of the logs in XML format is about 2-4 GB, the initial viewing phase contains settings for the level of aggregation of indicators by minutes, hours, but games with settings have not increased usability. Note: the ability to write a log to the database was later discovered in the latest source code, but they didn’t have time to try.
- The system is not suitable for continuous monitoring, you can connect occasionally and monitor performance on servers for up to 1-2 days in a continuous mode.
The monitoring of our application did not end there, and we tried, without much intervention in the application, to monitor the logic of the application itself according to the following list:
- a list of the most costly in terms of total time execution of service methods;
- список наиболее затратных по среднему времени выполнению методов сервисов;
- список наиболее часто вызываемых методов сервисов;
- список наиболее затратных по общему времени выполнению SQL запросов;
- список наиболее затратных по среднему времени выполнению SQL запросов;
- список наиболее часто вызываемых SQL запросов;
- ошибки в логе
But more about that in the next part. Good luck in debugging!
PS And a complete understanding of the original problem did not come. The Context switches per second indicator for the OS clearly goes into the range of 8000-10000 in a week. In this case, the number of threads grows insignificantly. Synchronization? AutoFlushIfRequired in Hibernate takes a very long time: from fractions of a second to 30-70 seconds in total after degradation on some calls to the service. The first level cache is the same in volume for this service request (about 8000 entities), but the execution time is increasing. Synchronization within HIbernate and Infinispan? By hook or by crook, the system degradation time has increased and is already close to 2 weeks, but I want more.