How to debug front-end and backend: step-by-step instructions
- Tutorial
Hi, Habr! I present to you the translation of the article " How to debug javascript in Chrome quick and easy ".
In this post, we will learn how to debug JavaScript on the front and backend using Chrome DevTools and VS Code.
A lot of services now allow debugging code over the frontend. Chrome DevTools and Firefox Developer Tools are the most popular among them, but other browsers also have their own tools. We will use Chrome DevTools for examples.
Frankly, debugging code can take a lot of time. Especially if you use such simple commands as console.log () or window.alert () .
You need to write, and then delete the additional code, and sometimes these commands still get into the commit (even if you thought that everyone took them). And if you use lints (static debuggers), then the console or alert commands will be highlighted in the code.
And at this moment Chrome DevTools comes into play, allowing us to debug code without tedious commands. Among the chips of this tool, editing CSS and HTML, testing the network and checking the speed of the site are our favorites.
In order to get acquainted with this tool in practice, let's create a simple JavaScript page with getData ()method. This method will simply collect data from the input field, create a DOM element with a dataSpan ID, and add a value from the input field to this element.
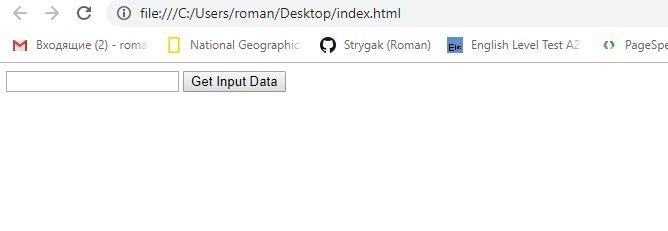
Here is how our page will look like:
In HTML:

In JavaScript:
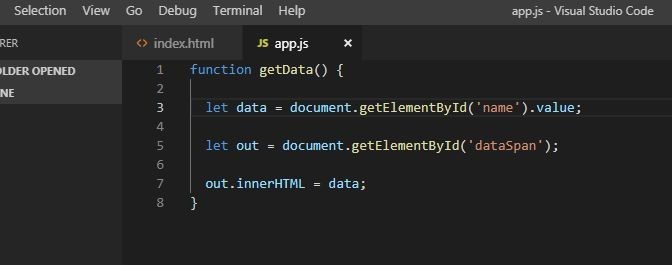
Save it as app.js.
Here's how our page will look in the browser:
To check how the method works before storing data in dataSpan , you can use old-fashioned console.log (data) or window.alert (data) . Here is what we will see when running the file in VS Code:

This is the most primitive approach.
Instead, we use breakpoints (breakpoints) in Chrome DevTools to make sure everything works as it should.
Breakpoint is a line of code on which we want to pause the running of the code in order to study how it works (or does not work).
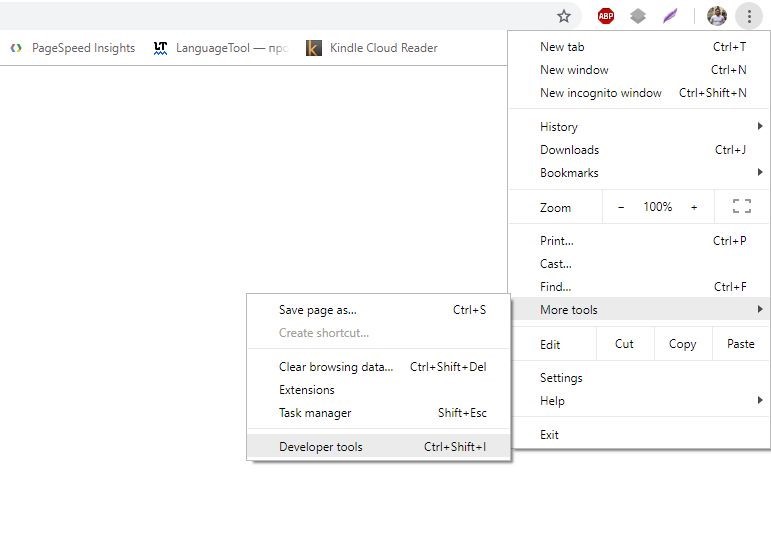
Returning to the example, let's launch the page in Google Chrome and do the following:
In addition, you can use the key combination Ctrl + Shift + I (we use it, but this is up to you =).
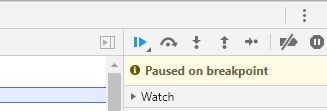
Having opened the developer's toolbar, let's pause the breakpoint code:
Thus, we set breakpoint (for convenience, the program allocates a place with breakpoint with a blue flag). Also note that the selected variable is automatically added to the Breakpoints> Local section (in the JavaScript Debugging panel).
Having put a breakpoint, we suspend the execution of the function on it. Therefore, we will need to continue line-by-line code execution to examine the changes in our variable.
In the upper left corner of the JavaScript Debugging panel are the basic breakpoint sweep commands:
The first button, Resume script execution (), will continue executing the code to the end or to the next breakpoint.
Let's enter hello world in the input field. Data = “hello world” is added to the string. Now let's click on the Step over next function call () button .
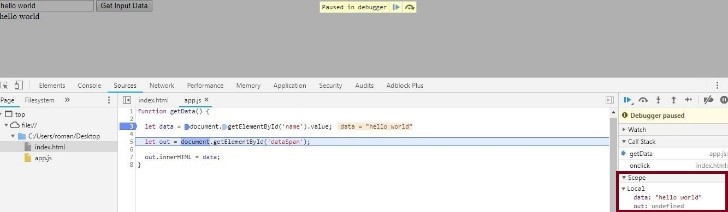
The selected breakpoint string will be executed and the debugger will select the next one. Click the Scope tab to see the value of the data variable. It has changed to “hello world”, which we entered earlier and just shows the value of our variable on a specific line of code. Click Step over next function call again to execute the selected method and go to the next line.
If you refresh the page, the value of the out variable is also updated in the DOM element. To see the value of a variable, you can click on Expand () to its left. If you again click on Step over next function call, the text “hello world” will be added again to the dataSpan.
Suppose that we perform a more complicated function that definitely does not hurt to debug. For example, we want users to enter numbers separated by spaces. The function will then process and output these numbers, their sum, and the result of the multiplication.
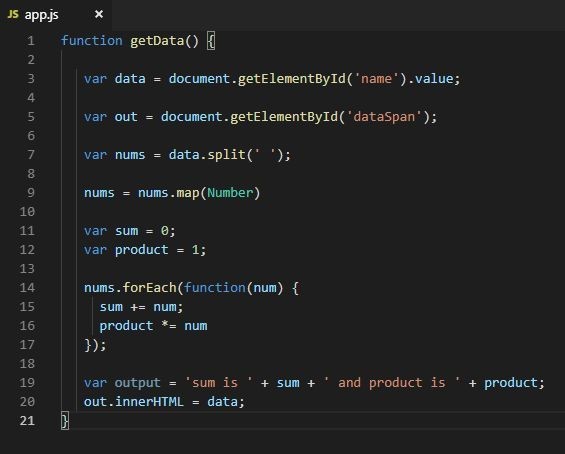
To do this, we will update the app.js code as in the screenshot above. We update the page and proceed directly to debugging.
The screenshot shows that both the sum and the product of numbers have the value NaN (not a number). This indicates that you need to fix the code immediately.
In most cases, your code is much longer and, quite possibly, concatenated into one line. For example, suppose you have 1000 lines of code. In this case, setting breakpoints by clicking on line numbers each time doesn't seem like such a great idea, does it?
For this, DevTools has a cool tool for setting breakpoint on different types of interaction with the browser. In the JavaScript Debugging panel, click Event Listener Breakpoints to view the available categories.

As you can see, you can put a breakpoint on the Mouse> click event (mouse click) anywhere in our code. This means that if you click Get Input Data , the code execution will stop at the onclick event . And you do not need to manually add anything.
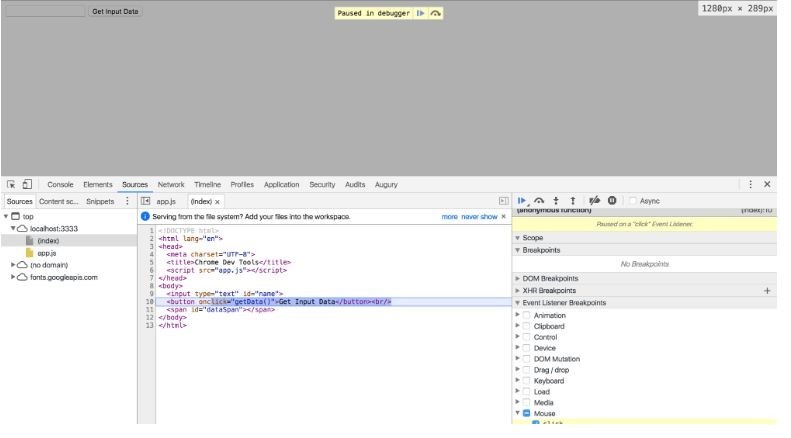
Clicking on the Step over next function call will sequentially guide us through the code used to process the clicks.
Using Event Listener Breakpoints, you can put breakpoints on a bunch of different types of events, such as Keyboard, Touch, and XHR.
If you enter a debugger anywhere in the code, Chrome DevTools will pause the execution of the code on this line and highlight it as well as breakpoint. You can use this tool to debug JavaScript in Chrome or other browsers. Just remember to remove it when you are finished debugging.

The code in the screenshot above will stop at the line that contains the debugger keyword and automatically launch Chrome DevTools. In essence, this is the same as putting a breakpoint on this line. Also, the execution of the code can be controlled using the buttons Step into next function call and Step over next function call.
In the beginning, we looked at the console.log () and window.alert () commands and realized that they were not very convenient. It was necessary to use them often throughout the code, which could make the code “harder” and slower if we forgot to remove them before the commit.
As the number of lines grows, Chrome Developer Tools is much more efficient at catching bugs and evaluating overall performance.
The easiest way to debug Angular code is to use Visual Studio Code (VS Code). To start debugging, you will need to install the Chug Debugger extension:
How to set breakpoint?
In the same way as in DevTools, click on the line number in app.component.ts. The breakpoint line will be highlighted with a red circle (to the left of the line number).
To begin, we will need to configure the debugger:
1. From the File Explorer, go to the Debug tab.
You can also use Ctrl + Shift + D for this.
2. Click on the Settings icon to create launch.json.
This is the settings file that we will use.
3. From the Select Environment pop-up menu, select Chrome.
This will create a new .vscode folder and launch.json file for your project.
4. Run this file.
5. To use this file for our purposes, in the url method, replace localhost port from 8080 to 4200.
6. Save the changes.
Here's what the file should look like:
7. Press F5 or click the Start Debugging button to start the Debugger.
8. Launch Chrome.
9. To pause the execution of code at breakpoint, refresh the page.

To sequentially view the code execution and how variables change, use the F10 key.
In the extension Debugger for Chrome, there are many additional configurations, the work of source maps and troubleshooting all sorts of problems. To view them directly in VS Code, click on the extension and select the Details tab .

Here you will learn how to debug the code on Node.js. Here are the most common approaches:
• Using Chrome DevTools
For now, this is our favorite approach.
• Using IDE-type Visual Studio Code, Visual Studio, WebStorm, etc.
For examples, we will use VS Code and Chrome DevTools.
Chrome and Node.js use the same JavaScript engine, Google V8, and this means that for the backend we will use the same tools as for the front.
To do this:
1. Run your project in VS Code.
2. Click the Console tab.
3. Type npm start --inspect and press Enter.
4. Ignore the suggested “chrome-devtools: // ...” URL (there is a better method).

5. Launch Chrome and enter “about: inspect”.
This will redirect you to the Devices tab on DevTools.
6. Click the Open dedicated DevTools for Node link.

The debugging process is the same as for the frontend, that is, using breakpoint. In fact, it is very convenient that you do not need to switch to IDE. Thus, it is possible to debug both the front and backend on the same interface.
Thanks for reading and hope you enjoyed this post. Subscribe to updates - we still have lots of useful things in our sleeves :-)
In this post, we will learn how to debug JavaScript on the front and backend using Chrome DevTools and VS Code.
Goals:
- Learn to debug frontend and Angular
- Analyze the Node.js debugging process
We catch bugs on the frontend (JavaScript, Angular)
A lot of services now allow debugging code over the frontend. Chrome DevTools and Firefox Developer Tools are the most popular among them, but other browsers also have their own tools. We will use Chrome DevTools for examples.
Javascript javascript
Frankly, debugging code can take a lot of time. Especially if you use such simple commands as console.log () or window.alert () .
You need to write, and then delete the additional code, and sometimes these commands still get into the commit (even if you thought that everyone took them). And if you use lints (static debuggers), then the console or alert commands will be highlighted in the code.
And at this moment Chrome DevTools comes into play, allowing us to debug code without tedious commands. Among the chips of this tool, editing CSS and HTML, testing the network and checking the speed of the site are our favorites.
In order to get acquainted with this tool in practice, let's create a simple JavaScript page with getData ()method. This method will simply collect data from the input field, create a DOM element with a dataSpan ID, and add a value from the input field to this element.
Here is how our page will look like:
In HTML:
In JavaScript:
Save it as app.js.
Here's how our page will look in the browser:
To check how the method works before storing data in dataSpan , you can use old-fashioned console.log (data) or window.alert (data) . Here is what we will see when running the file in VS Code:
This is the most primitive approach.
Instead, we use breakpoints (breakpoints) in Chrome DevTools to make sure everything works as it should.
Breakpoint is a line of code on which we want to pause the running of the code in order to study how it works (or does not work).
Returning to the example, let's launch the page in Google Chrome and do the following:
- To open the Chrome Developer Tools, in the upper right corner of the browser, click to open the settings menu.
- In this menu, select the Additional tools (in the English menu - More tools), and then the Developer tools (Developer tools).
In addition, you can use the key combination Ctrl + Shift + I (we use it, but this is up to you =).
Having opened the developer's toolbar, let's pause the breakpoint code:
- Select the Sources tab.
- In Sources, in the Page pane, select app.js (which we created a little earlier).
- In the code editor, click on the line number.
let data =document.getElementById('name').value;
Thus, we set breakpoint (for convenience, the program allocates a place with breakpoint with a blue flag). Also note that the selected variable is automatically added to the Breakpoints> Local section (in the JavaScript Debugging panel).
Manage code execution intervals
Having put a breakpoint, we suspend the execution of the function on it. Therefore, we will need to continue line-by-line code execution to examine the changes in our variable.
In the upper left corner of the JavaScript Debugging panel are the basic breakpoint sweep commands:
The first button, Resume script execution (), will continue executing the code to the end or to the next breakpoint.
Let's enter hello world in the input field. Data = “hello world” is added to the string. Now let's click on the Step over next function call () button .
The selected breakpoint string will be executed and the debugger will select the next one. Click the Scope tab to see the value of the data variable. It has changed to “hello world”, which we entered earlier and just shows the value of our variable on a specific line of code. Click Step over next function call again to execute the selected method and go to the next line.
If you refresh the page, the value of the out variable is also updated in the DOM element. To see the value of a variable, you can click on Expand () to its left. If you again click on Step over next function call, the text “hello world” will be added again to the dataSpan.
More complex debugging
Suppose that we perform a more complicated function that definitely does not hurt to debug. For example, we want users to enter numbers separated by spaces. The function will then process and output these numbers, their sum, and the result of the multiplication.
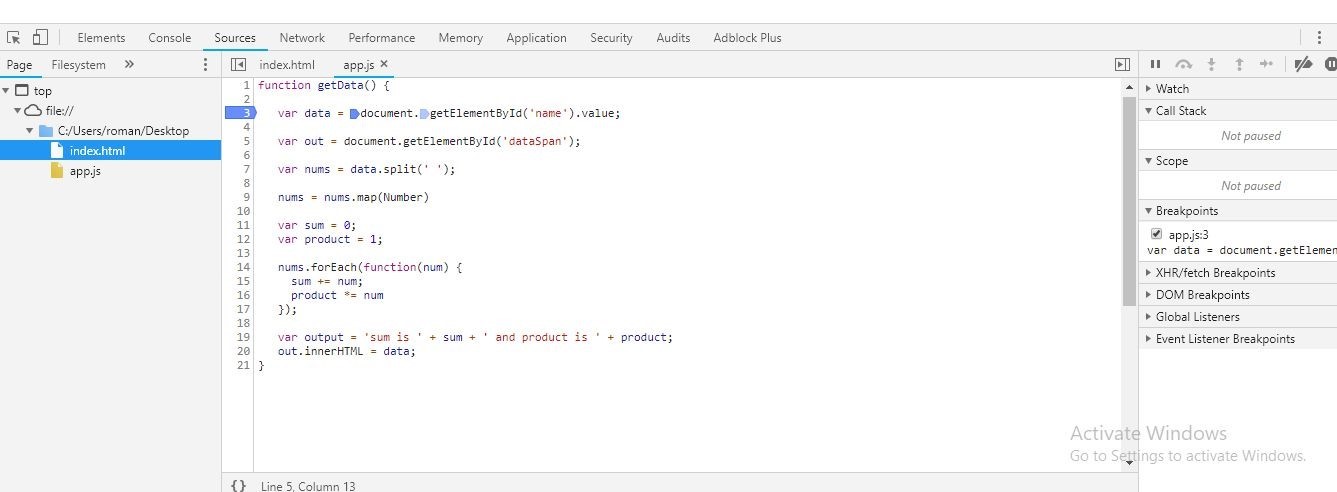
To do this, we will update the app.js code as in the screenshot above. We update the page and proceed directly to debugging.
- Click 3 (line number of let data = document.getElementById ('name'). Value;) to set breakpoint.
- Enter 23 24 e in the input line in the browser.
- Click Step over next function call.
The screenshot shows that both the sum and the product of numbers have the value NaN (not a number). This indicates that you need to fix the code immediately.
How else can you set breakpoint
In most cases, your code is much longer and, quite possibly, concatenated into one line. For example, suppose you have 1000 lines of code. In this case, setting breakpoints by clicking on line numbers each time doesn't seem like such a great idea, does it?
For this, DevTools has a cool tool for setting breakpoint on different types of interaction with the browser. In the JavaScript Debugging panel, click Event Listener Breakpoints to view the available categories.
As you can see, you can put a breakpoint on the Mouse> click event (mouse click) anywhere in our code. This means that if you click Get Input Data , the code execution will stop at the onclick event . And you do not need to manually add anything.
Clicking on the Step over next function call will sequentially guide us through the code used to process the clicks.
Using Event Listener Breakpoints, you can put breakpoints on a bunch of different types of events, such as Keyboard, Touch, and XHR.
Keyword “debugger”
If you enter a debugger anywhere in the code, Chrome DevTools will pause the execution of the code on this line and highlight it as well as breakpoint. You can use this tool to debug JavaScript in Chrome or other browsers. Just remember to remove it when you are finished debugging.
The code in the screenshot above will stop at the line that contains the debugger keyword and automatically launch Chrome DevTools. In essence, this is the same as putting a breakpoint on this line. Also, the execution of the code can be controlled using the buttons Step into next function call and Step over next function call.
Squeeze
In the beginning, we looked at the console.log () and window.alert () commands and realized that they were not very convenient. It was necessary to use them often throughout the code, which could make the code “harder” and slower if we forgot to remove them before the commit.
As the number of lines grows, Chrome Developer Tools is much more efficient at catching bugs and evaluating overall performance.
Angular Angle
The easiest way to debug Angular code is to use Visual Studio Code (VS Code). To start debugging, you will need to install the Chug Debugger extension:
- Run the project on VS Code and open the Extensions tab. Or press Ctrl + Shift + X on the keyboard.
- In the search bar, enter Chrome.
- Select Debugger for Chrome and click Install.
- After install the extension, the Reload button appears. Click it to complete the installation and activate the Debugger.
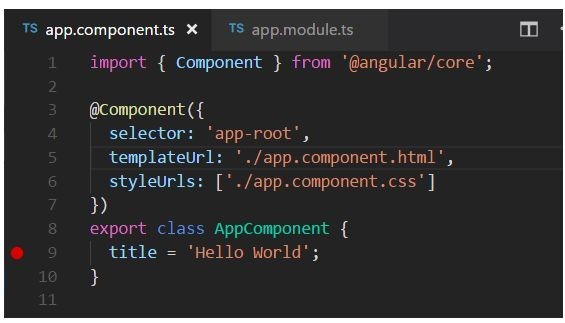
How to set breakpoint?
In the same way as in DevTools, click on the line number in app.component.ts. The breakpoint line will be highlighted with a red circle (to the left of the line number).
Configuring debugger
To begin, we will need to configure the debugger:
1. From the File Explorer, go to the Debug tab.
You can also use Ctrl + Shift + D for this.
2. Click on the Settings icon to create launch.json.
This is the settings file that we will use.
3. From the Select Environment pop-up menu, select Chrome.
This will create a new .vscode folder and launch.json file for your project.
4. Run this file.
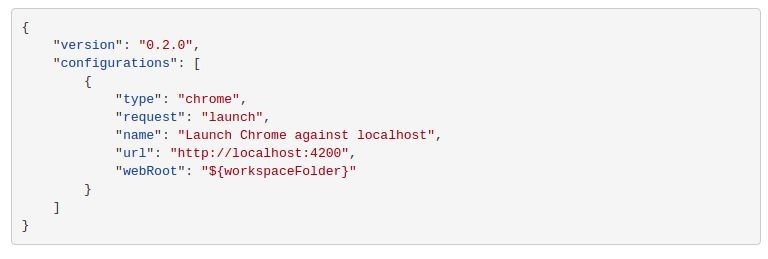
5. To use this file for our purposes, in the url method, replace localhost port from 8080 to 4200.
6. Save the changes.
Here's what the file should look like:
7. Press F5 or click the Start Debugging button to start the Debugger.
8. Launch Chrome.
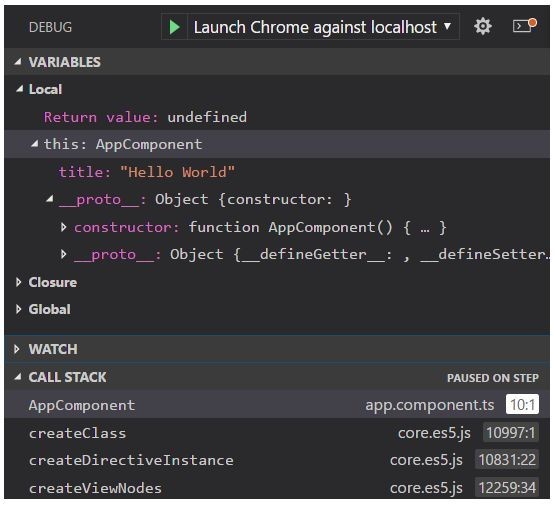
9. To pause the execution of code at breakpoint, refresh the page.
To sequentially view the code execution and how variables change, use the F10 key.
README
In the extension Debugger for Chrome, there are many additional configurations, the work of source maps and troubleshooting all sorts of problems. To view them directly in VS Code, click on the extension and select the Details tab .
Backend Debugging (Node.js)
Here you will learn how to debug the code on Node.js. Here are the most common approaches:
• Using Chrome DevTools
For now, this is our favorite approach.
• Using IDE-type Visual Studio Code, Visual Studio, WebStorm, etc.
For examples, we will use VS Code and Chrome DevTools.
Chrome and Node.js use the same JavaScript engine, Google V8, and this means that for the backend we will use the same tools as for the front.
To do this:
1. Run your project in VS Code.
2. Click the Console tab.
3. Type npm start --inspect and press Enter.
4. Ignore the suggested “chrome-devtools: // ...” URL (there is a better method).
5. Launch Chrome and enter “about: inspect”.
This will redirect you to the Devices tab on DevTools.
6. Click the Open dedicated DevTools for Node link.
The debugging process is the same as for the frontend, that is, using breakpoint. In fact, it is very convenient that you do not need to switch to IDE. Thus, it is possible to debug both the front and backend on the same interface.
Thanks for reading and hope you enjoyed this post. Subscribe to updates - we still have lots of useful things in our sleeves :-)