Develop a visual modeling language with Sirius
- Tutorial

This is the third article in a model-driven development cycle. In previous articles, we dealt with OCL and metamodels , created our own metamodel for Anchor language with a tree editor . Today we’ll make an Anchor diagram editor.
Summary
In a few words: the article describes how to create diagram editors. Moreover, it is described in great detail. If you do not plan to do this right now, then I recommend just flipping through the article, see the pictures, headlines - do not read too much.
If you want and can devote a little more time to this, then there is a ready-made project. You can install Eclipse and try it all live.
If you are ready to put off all your affairs and right now start creating a diagram editor, then below is a detailed step-by-step guide for you.
Introduction
It is important to note that the Anchor metamodel from the previous article is syntactically neutral. It describes only the concepts used in the construction of Anchor-models. But it is not described how exactly these concepts can be drawn on diagrams or described as text.
Also in the previous article, in parallel with the syntactically neutral metamodel, we created a tree editor of Anchor models, in which for abstract concepts a completely concrete representation in the form of a tree with icons is used.
If you look into the anchor file with some Anchor-model , you will see another notation, but not tree-like, but text.
The Java API, which we also generated in the last article, is already working with the third representation of Anchor models as Java objects.
In this article, we will describe another notation for Anchor-models - diagrammatic. To create a diagram editor, as before, we will use the Eclipse Modeling Tools. There are several tools for working with charts.
Graphical Editing Framework (GEF)
GEF is a fairly powerful toolkit for Eclipse, allowing you to work with various charts, graphs. Particularly good at the moment is the 4th version, which has DOT support and many different interesting things. The disadvantage of GEF is that you need to know Java and write a lot of sample code that could be generated automatically.
Graphiti
I personally did not use it and did not see examples. But, as far as I understand, this is some cross-platform abstraction over GEF-like toolkits, which, however, currently does not support anything other than GEF :-)
Graphical Modeling Framework (GMF)
GMF is a toolkit that makes it easy to use GEF for EMF-based charts. It consists of 3 parts: GMF Notation, GMF Tooling and GMF Runtime.
GMF Notation is a metamodel for representing (arbitrary) diagrams.
GMF Runtime - reusable components for chart editors (toolbars, functionality for exporting charts to various graphic formats, etc.).
GMF Tooling is a toolkit that allows you to generate code for the chart editor. Working with GMF Tooling usually looks like this.
- Create an Ecore metamodel for some modeling language.
- Create a .gmfgraph model with a description of the graphic elements that will be used in the diagrams.
- Create a .gmftool model with a description of the chart editor toolbar.
- Create a .gmfmap model that links 3 of these models together :-)
- And finally, generate the source code of the chart editor.
All of these additional models in GMF are very similar to the .genmodel model that we used in our last article to generate the tree diagram editor. This is probably easier than using GEF directly, but still quite complicated.
GMF Notation and GMF Runtime are used in almost all Eclipse-based chart editors.
There are alternatives for GMF Tooling. However, it is worth noting that GMF appeared relatively long ago and works including in older versions of Eclipse. For example, Rational Software Architect is usually based on a fairly old version of Eclipse. Therefore, if you want to create a diagram editor for RSA, you have to use the GMF Tooling, instead of more modern tools. An example of such a chart editor you saw inthe first article of the cycle (pay attention to the diagram with the little men, the source code is available here ).
Note
In general, the same Sirius should theoretically work starting with Eclipse Juno, but to be honest, I have not tried it yet.
Sirius
Sirius, like GMF Tooling, allows you to create chart editors based on GMF Notation and GMF Runtime. But it is much simpler, more functional and more convenient.
- Only one model is created that describes the chart editor, not 3.
- In addition to presenting the model in the form of a diagram, it supports tree, tabular and other representations.
- Model validation, navigation between views, filters, etc. are supported.
- No need to generate any code. You describe the diagram editor and immediately test it in the same instance of Eclipse.
Eugenia
Based on Eclipse, a fairly large number of tools have been created that can be used in model-driven development. The tools are completely different: for transforming, validating, comparing, combining models, etc. In the Epsilon project, the developers tried to somehow unify and dock all these technologies among themselves.
EuGENia is a tool used by Epsilon to develop chart editors. In fact, this is a wrapper over GMF Tooling, which simplifies the creation of .gmfgraph, .gmftool and .gmfmap models.
Customization
We will create a diagram editor based on the Ecore metamodel described in a previous article . Accordingly, it does not make sense to use pure GEF or Graphiti, you need to take some add-on sharpened for EMF. EuGENia disappears because we will not use Epsilon for now. GMF Tooling also disappears, because, on the one hand, it is too complicated, and on the other, we do not need the chart editor to work in older versions of Eclipse. Remains Sirius.
Install Eclipse Modeling Tools .
Install Sirius. To do this, select Help -> Install New Software from the menu ... Add the site http://download.eclipse.org/sirius/updates/releases/3.0.0/mars
Note
At the time of writing, this is the latest version of Sirius. The current version list is available here .
Select and install the components marked in the figure.

Take the designs from the last article . Expand them in the current workspace. To do this, select File -> Export ... -> Deployable plugin-ins and fragments from the menu.
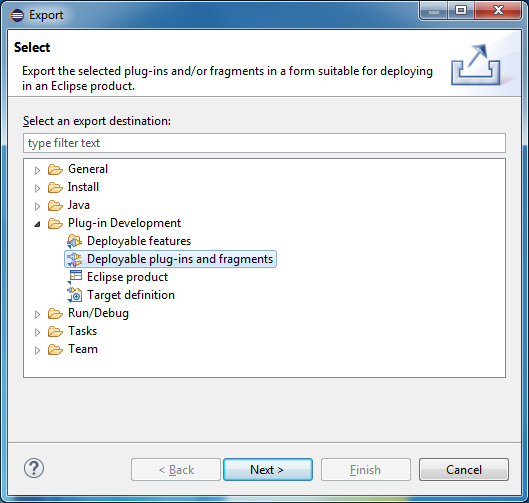
Check the projects anchor, anchor.edit and anchor.editor. Select Install into host. Repository After deploying the plugin, restart Eclipse.
The previous article described two more options for launching these plugins in Eclipse (launching a second instance and copying jar files to $ ECLIPSE_HOME / dropins).
Make sure you open test models from the anchor.tests project in the model folder.

After that, it is advisable to remove the projects anchor, anchor.edit and anchor.editor from the workspace because they are already deployed. If you leave them, then there will be nothing fatal. It is possible that when autocompletion duplicate metaclasses will be issued (one from the workspace, the second from the deployed plugin).
Project creation
In general, the anchor.design project has already been created . You can
- delete this project and create your own,
- create a similar project nearby,
- Do not create anything and see everything on the example of a finished project.
To create a project, select File -> New -> Other ... -> Sirius -> Viewpoint Specification Project. Call it anchor.design or something else.
Open the Sirius perspective (Window -> Perspective -> Open Perspective).

There are a minimum of files in the project: several standard files with settings, a plugin activator in the src folder and, most importantly, an anchor.odesign file. In it, we will describe the elements of diagrams, the chart editor toolbar and everything else.
Create a point of view
There can be several points of view on the same model (customer or developer, conceptual, logical or physical, etc.). We will describe only one point of view (Viewpoint). Add it via the context menu in the tree editor. Assign her Anchor identifier, in the Model File Extension field, specify anchor.

Note
Personally, I am very confused that in Sirius you need to manually register identifiers for objects, they could very well be assigned automatically. Confused by the possibility of changing identifiers.
It is also embarrassing to bind the diagram editor to models by the extension of the model file, and not by the namespace.
But, in principle, it works, and okay.
Create view
A model can have many different views. Currently, Sirius supports 5 views (chart, table, pivot table, tree, sequence chart). In this article we will only work with charts.
Add to the Anchor point of view a diagram representation of the model (New Representation -> Diagram Description).

In the properties, specify the Anchor Diagram identifier, in the Domain Class field, specify the root object of the model (anchor.Model). In this field, as in many other fields, autocompletion works, called by Ctrl + Space.
Note that the Default layer is automatically created in the view to place the chart elements. In this article we will not create additional layers.
Specification of visual elements for anchors
Now it is necessary to describe the nodes and edges from which the diagrams will be built.
Note
Once again, I note that in the previous article in the anchor.ecore file we described the Anchor language in a syntactically neutral way. They described only the concepts that Anchor models consist of. These concepts can be represented in the form of diagram elements, in the form of tree nodes, in the form of text. Now we are actually creating a second model in which we describe how syntactically neutral concepts of Anchor models should be visualized.
It is very important to understand the difference between a model and a chart.
In the Default layer, add a Node node for anchors with Anchor identifier. In the Domain Class field, type anchor.Anchor. In the Semantic Candidates Expression field, you must specify where exactly in the model you need to look for anchors. Press Ctrl + Space and see what options are available:
- var: means that you need to take the value of some variable;
- feature: means that you need to take some property or association of the current object (in this case, the current object is the root object of a model of type anchor.Model);
- service: means that you need to run some Java method, which will return a list of anchors that need to be displayed on the diagram;
- aql: means that you need to execute some AQL expression that will return a list of objects (AQL is very similar to OCL, and if you read this article , it should be completely understandable to you);
- [/] similarly allows you to write some expression that will be interpreted by the Acceleo engine (however, it works slowly, unstable and difficult, it is recommended to use AQL);
- ocl: means you need to execute some OCL expression that will return a list of objects (in this article we will use mainly OCL expressions, frankly, I do not really understand how OCL and AQL are fundamentally different, but still OCL is a standard OMG).
In this case, the anchors that need to be displayed on the diagram are accessible through the anchors association of the model root object. Therefore, in the Semantic Candidates Expression field, you must write feature: anchors.
Note
If you do not understand what kind of association is involved, look at the last diagram in the previous article .

Now it is necessary to describe exactly how the anchors should be represented on the diagrams. If you created a new project, then copy the icons folder into it . In the Model Explorer, click on the anchor.design project on the left and press F5 (or select Refresh from the context menu). After that, the icons folder should appear in Eclipse.
Add a link to the image in the description of the Anchor node (New Style -> Workspace Image). In the properties, specify /anchor.design/icons/Anchor.png.
Chart Editor Testing
So, we have already described one element of the diagram, let's see how it all looks. In the anchor.tests project, in the model folder are test models with diagrams. If you create a new anchor.design project, then these diagrams cannot be opened, because there are many objects in them that we have not yet described in the anchor.odesign file. Therefore, you can simply delete the Pefrormance.aird file and create a new one (the test model itself will not go anywhere, because it lies in the anchor file). To create a new diagram, select File -> New -> Representations File. Choose Initialization from a semantic resource. Select a model.

On the last tab of the chart creation wizard, specify the anchor.tests / model folder. Choose Anchor's point of view.
There are no diagrams in the created file yet. To create one, select the model root object and click New Representation -> new Anchor Diagram.

Drag the chart editor window to the right to simultaneously see both the description of the anchor.odesign chart editor and the test chart.

The diagram looks a little strange :-)
This is due to the fact that two icons are displayed on it. One of the anchor.design project, the second of the anchor.edit project (which we created in the last article for the tree editor). Icons for the tree editor are small and clumsy, because they are obtained by converting from svg- to gif-format. To remove them from the diagram in anchor.odesign in the image properties on the Label tab, uncheck the Show Icon checkbox.
Also in the Label Position field, specify border. This means that the signature of the anchor should not be displayed inside the anchor icon, but on its border.
Note that the Label Expression field indicates feature: name. This means that the name property of the anchor will be used as the signature.
On the Advanced tab, in the Allow resizing field, prohibit resizing the icon.
Now save the specification of the chart editor (Ctrl + S) and, lo and behold, the chart will automatically update. In this regard, Sirius greatly simplifies the development of chart editors. For example, in a previous article, you had to generate source code, run a second instance of Eclipse. You have to do the same when using GMF Tooling, but here everything is simple.

Specification of visual elements for attributes
For attributes, we could describe the visual element in the same way as for anchors by selecting the anchor.Attribute metaclass and the corresponding icon. However, everything is somewhat more complicated.
Firstly, for attributes without preserving history and preserving history, different icons should be used - circles with single or double borders, respectively.
Secondly, when you begin to describe visual elements for links, you will see that for them it is indicated which nodes of the diagram they can link. For example, only KnottedStaticAttribute and KnottedHistorizedAttrbute can be associated with a node (Knot). And StaticAttribute and HistorizedAttrbute cannot be associated with a node, they have a banal relationship with a node in the metamodel (anchor.Knot).
Therefore, copy the description of the visual element for Anchor four times for each kind of attribute. Change the Id and Domain Class fields accordingly. Clear the Semantic Candidates Expression field, because attributes are not top-level objects, they belong to anchors, not the model directly. One could write an OCL expression that traverses all the anchors and returns all the attributes, but that makes no sense. Also change the icons. After saving the specification and organizing the objects (by dragging with the mouse) you will see something similar.

Specification of relationships between anchors and attributes
An attribute relationship is defined between the metaclasses anchor.Anchor and anchor.Attribute. For each instance of this relationship, we need to draw a line on the Anchor diagrams. To do this, add an edge based on the relation (New Diagram Element -> Relation Based Edge) in the Default layer.
Specify the AttributeEdge identifier. In the Source Mapping field, specify the Anchor visual element that is used to draw anchors. In the Target Mapping field, specify 4 visual elements for various types of attributes. In the Target Finder Expression field, specify feature: attributes.
In the Edge Style, on the Decorators tab, select NoDecoration for both ends. On the Advanced tab, in the Ends Centering field, select Both so that the ends of the lines are centered on the nodes that they connect. Also remove the Label nested element, because signatures are not needed here.
After saving and organizing the elements, you will see something similar. You have to arrange with the mouse, out of the box automatic ordering does not work very well.

Specification of visual elements for staples and nodes
You can already do this yourself. For nodes, specify the metaclass anchor.Knot, and in the Semantic Candidates Expression field, specify feature: knots. For staples, as well as for attributes, create 4 elements. In the Semantic Candidates Expression field, specify feature: ties. On the Label tab for scraps, clear the Label Expression field because they do not have names.
Add a relationship between KnottedStaticAttribute, KnottedHistorizedAttribute, and Knot, similar to the relationship between anchors and attributes.
Note
If you don’t see any connections on the diagram or something doesn’t work, try to validate the specification. To do this, click the button with a green checkmark in the header of the specification editor.
For example, instead of feature: knot, I wrote feature: knots. At the same time, the links between attributes and nodes simply did not appear without any error messages. After validating the specification, it becomes clear what the problem is. Another common mistake is extra spaces.
You end up with something like this.

Specification of ties with anchors and nodes
This type of connection is already somewhat more complicated than those that we created earlier. This is because they are not based on the relationship between objects, but on instances of the anchor.AnchorRole metaclass, which have two properties (a name and a flag that determines whether this relationship is identifying) and two associations (with a brace and an anchor).
Add an Element Based Edge with an AnchorRoleEdge ID and the following properties:
- Domain Class - anchor.AnchorRole
- Source Mapping - StaticTie, KnottedStaticTie, HistorizedTie, KnottedHistorizedTie
- Source Finder Expression - feature: tie
- Target Mapping - Anchor
- Target Finder Expression - feature: anchor
As before, draw a line without arrows, center the ends of the line, uncheck the Show Icon in the captions.
Unlike previous links, this one will display two signatures. In the center of the line, you need a signature with the role name, for this in the Label Expression field specify feature: name. Add Begin Label Style, in the Label Expression field write ocl: if self.isIdentifier then '1' else 'm' endif. Well, OCL came in handy for us all of a sudden . The meaning of the expression, I think, is intuitive: if the relation is identifying, we show 1, otherwise - m.
By analogy, add links based on the metaclass anchor.KnotRole. As a result, you will see something like that. Please note that in the properties window you can change both the properties of model objects and various aspects of the display of these objects in diagrams.

Well then, the chart editor is almost ready. Of course it is not as beautiful and comfortable as on the Anchor Modeling website . Consider this a fee for using a generic solution. Although the fact that properties are displayed in the same window is, in my opinion, quite convenient. In any case, everything else (adequate automatic ordering of nodes in the diagram, normal splines for edges, etc.) should be completed by hand.
Specification of a tool for creating nodes
You probably noticed an empty tool palette on the right. Add a tool to create new anchors there. To do this, create a new section (New Tool -> Section) with the Nodes identifier. Add the New Element Creation -> Node Creation Node Creation Tool with the CreateAnchor identifier. In the Label field, specify Anchor. In the Node Mappings field, add Anchor. On the Advanced tab, you can add a link to the icon.
Expand this element, you will see the definition of two variables and the Begin block, which will be executed when using our tool. Add an operation that sets the context to it (New Operation -> Change Context). In the Browse Expression field, specify var: container. If you (like me do not understand what this variable is), press Ctrl + Space, and you will see that it refers to an object of type anchor.Model, i.e. to the root object of our model.
In the context of the model root object, we need to create an anchor (an instance of the metaclass anchor.Anchor). To do this, add an instance creation operation (New Operation -> Create Instance). In the Reference Name field, specify the name of the association of the current object (specified through Change Context) with which to associate this object with the instance being created. In this case, it is an anchors association. In the Type Name field, specify anchor.Anchor. The Variable Name field indicates the name of the variable that will refer to the created object.
Save the specification and try creating a new anchor in the diagram editor. On the properties tab below, specify the name of the anchor.

Примечание
Вообще в Sirius доступно ещё множество разных операций, например, можно задавать имя нового якоря по умолчанию и т.п. Но с этим вы можете разобраться самостоятельно.
Спецификация инструмента для создания атрибутов
With attributes, things are a bit more complicated than with anchors, because attributes are not top-level objects. They belong to anchors, not models.
Copy the anchor creation tool, correct the Id, Label and Node Mappings fields. Do not forget that this needs to be done 4 times (for each type of attribute). On the Advanced tab, in the Extra Mappings field, add Anchor. This will allow you to create attributes not only in the context of the model, but also in the context of individual anchors.
Now you need to prohibit the creation of attributes that are not anchored to the anchor. To do this, on the General tab, in the Precondition field, specify ocl: container.oclIsKindOf (Anchor). This means that only the anchor can be used as the container for the new attribute.
For the Create Instance operation, specify attributes in the Reference Name field (this is the name of the association between anchors and attributes). In Type Name, specify the metaclass of the attribute to create.

Try creating new attributes. Make sure that when you hover over an empty area in the diagram, the anchor creation tool appears. And when you hover over the anchor - an attribute creation tool.
Specification of other tools for creating, deleting and modifying objects and relationships
Tools for creating nodes and staples are made similarly. This is rather dreary, but in the GMF Tooling it is even more dreary, and much more dreary in the GEF without using any add-ons.
Tools for creating links, I think, it makes no sense to describe. You can see examples in the project . I only note that for simple connections (anchor - attribute or attribute - node) you need to use the Set operation. And for more complex relationships (brace - anchor, brace - node) you need to create new instances of objects.
Also in the project you will find examples of tools for removing and changing relationships.
Filter specification
The diagram is already quite complicated, add a filter that will hide unnecessary details (attributes and nodes).
To do this, create a composite filter in the Anchor Diagram view (New Filter -> Composite Filter). Give it any identifier and name Hide attributes and knots. Add a chart element filter (New -> Mapping Filter). In the Mappings field, specify Knot, StaticAttribute, HistorizedAttribute, KnottedStaticAttribute, KnottedHistorizedAttribute.
After you enable this filter in the chart editor, you will see something like this.

Validation Rules Specification
In the first article in the series, you saw examples of various control rules. The rules, like the model itself, were very artificial. Now we will add a more useful rule to the chart editor. For example, we prohibit the same name attributes at the anchor.
To do this, add a validation block to the view (New Validation -> Validation).
Then add a validation rule for the model element (New -> Semantic Validation Rule).
- In the Level field, specify Error.
- In the Target Class field, specify anchor.Anchor.
- In the Message field, specify “The anchor has indistinguishable attributes”.
Add a rule specification (New -> Audit). In the Audit Expression field write,
ocl:attributes->isUnique(name)Try to create two attributes of the same name at the same anchor in the model and validate the model (select Validate diagram in the chart context menu). In this case, an error icon will appear at the anchor.
We formulate this rule in a slightly different way. Create another rule:
- In the Level field, specify Error.
- In the Target Class field, specify anchor.Attribute.
- In the Message field, specify “The attribute has non-unique name”.
Add a rule specification (New -> Audit). In the Audit Expression field write
ocl:anchor.attributes->excluding(self).name->excludes(self.name)Now, after validation, not the whole anchor will be highlighted, but individual attributes with non-unique names.

Conclusion
After reading this article, you should understand the difference between models and model notations (for example, diagrams). I hope you can now create modeling languages and diagram editors for them.
You also saw the real use of OCL .
If you are interested, I highly recommend creating some kind of visual modeling language. As you can see, this is just as common as describing a class or function in code.
In subsequent articles, we will look at text notations for models. And of course, we will deal with the most important thing - the transformation of models.