Cost of housing as a function of coordinates
Housing prices are formed from numerous factors, the main of which are proximity to the city center and the availability of various infrastructure nearby. But real prices are only in paper newspapers and real estate sites. We will build our map with real estate prices in Moscow using python, Yandex API and matplotlib, a special report from the scene under the cat.
Hypothesis
As a person who does not live in Moscow, I evaluate the nature of prices in Moscow as follows:
- very expensive - within the garden ring
- expensive - from the garden ring to the TTK
- not very expensive - between TTK and MKAD, and the price decreases linearly towards MKAD
- cheap - beyond the Moscow Ring Road
The map will contain local maximums and minimums due to the proximity of important objects or industrial zones. And there will also be a price gap before and after the Moscow Ring Road, as this ring basically coincides with the administrative border of the city.
Hundreds of lines of excellent and not very python-code will be available at the end of the article by reference.
For research, I took two real estate sites with data for this summer. A total of 24,000 entries about new buildings and secondary housing participated in the sample, and different ads with the same address were averaged by price.
Ads were parsed by a script and stored in a sqlite database in the format:
широта, долгота, цена за кв.м.
About web spiders
Yes, due to a lack of knowledge, no third-party libraries were used and this entailed the creation of two separate scripts, one for each site, pulling the addresses, footage and cost of apartments. Addresses were magically transformed into coordinates using the Google Geocoder API. But because of the rather low quota for use, I was forced to run the script every day for a week. Yandex geocoder is 10 times free .
Building a function
To generalize the function to the entire plane, it is necessary to interpolate it using the available points. For this, the function
LinearNDInterpolatorfrom the scipy module is suitable. To do this, you only need to install python with a set of scientific libraries known as scipy. In the case when the data is very heterogeneous, it is almost impossible to choose a plausible function on the plane. The method LinearNDInterpolatoruses Delaunay triangulation , breaking the entire plane into many triangles. An important factor to consider when constructing functions is the spread in the values of the function. Among the ads are real monsters with a price per square meter of more than 10 million rubles
Meanwhile, the result of the interpolation looks like a gradient hell (clickable):

To get a map that is convenient for perception, you need to distribute the obtained values to discrete levels. After that, the map becomes like a page from the atlas for the 7th grade (clickable):

About discretization on the map
Depending on whether we want to see the general picture of prices or fluctuations near the average value, it is necessary to apply data compilation , i.e. the data distribution is more even on the scale of values, decreasing more values and increasing small ones. In code, it looks like this:
Functions were selected empirically by approximating 3m-4m points on wolframalpha .
    zz = np.array(map(lambda x: map(lambda y: int(2*(0.956657*math.log(y) - 10.6288)) , x), zz)) #HARD
    zz = np.array(map(lambda x: map(lambda y: int(2*(0.708516*math.log(y) - 7.12526)) , x), zz)) #MEDIUM
    zz = np.array(map(lambda x: map(lambda y: int(2*(0.568065*math.log(y) - 5.10212)) , x), zz)) #LOW
Functions were selected empirically by approximating 3m-4m points on wolframalpha .
It is worth noting that the linear interpolation method cannot calculate the values outside the boundary points. Thus, on a graph with a sufficiently large scale, we will see a very polygon. The scale must be selected so that the graph is fully inscribed in the resulting figure.
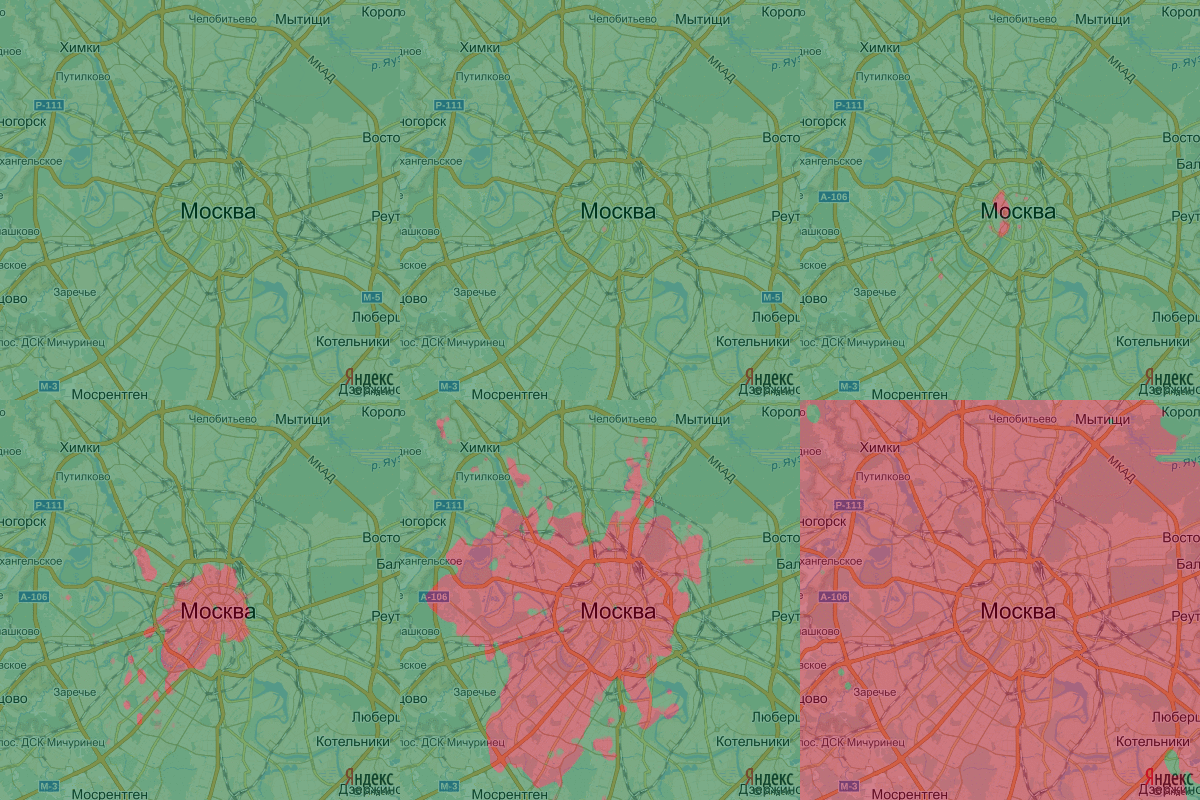
Another look at the statistics can serve as a map with areas of low and high prices. By dynamically varying the boundary between low and high prices, we will be able to see the position of prices in dynamics. The value of the price at each point will no longer play a role, only the grouping of points of a particular group makes a contribution (clickable).
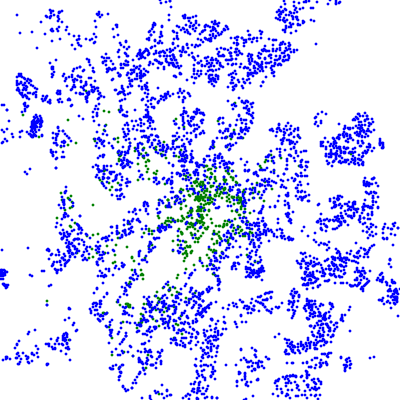
The calculations are similar to the calculation of the gravitational field at a point. For optimization, we will take into account only those points that really contribute to the final value of the field. After calculations, the result resembles a spray (clickable).
What else transformation?
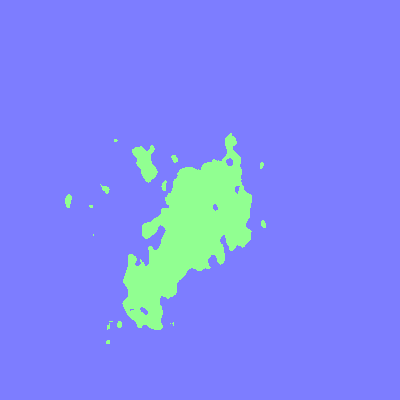
With strict construction of the field graph, it shows a scattering of points corresponding to the local predominance of the “expensive” field over the “inexpensive” one and vice versa. These points are like noise and ruin the graph. You can remove them, for example, with a median filter above the image with a sufficiently large value. For this, I used the command interface of the IrfanView program.
Visualization
Combine the resulting image with a schematic map of Moscow. Yandex API allows you to take a map by coordinates and specify for it the angular dimensions in longitude and latitude, as well as the desired image size.
Request example: The problem is only that the specified angular dimensions do not determine the boundaries of the visible region, but its guaranteed size. This means that we get a picture with angular sizes> = 0.25. There was no way to cope with the boundaries of visible coordinates, and they were searched manually.
static-maps.yandex.ru/1.x/?ll=37.5946002,55.7622764&spn=0.25,0.25&size=400,400&l=map
About Customization
You can align the cards relative to each other using Yandex tags, drawing points on the map with the given coordinates and getting a map with tags.
For a couple of calls from the PIL library, images are combined with comfortable viewing levels of transparency.
map_img = Image.open(map_img_name, 'r').convert('RGBA')
price_img = Image.open(prices_img_name, 'r').convert('RGBA')
if price_img.size == map_img.size:
    result_img = Image.blend(map_img, price_img, 0.5)
results
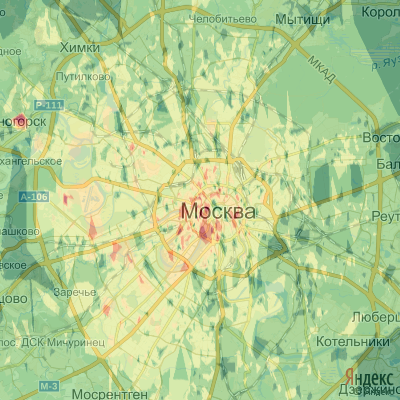
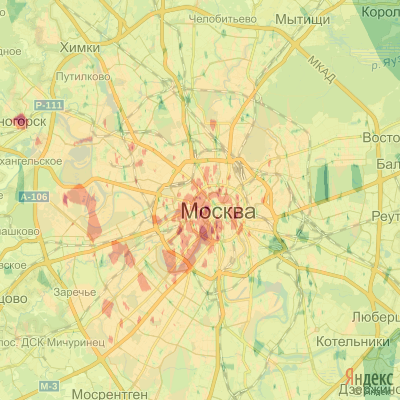
Three images with different levels of companding and animation options with a field.

A bit of analytics:
In general, as the hypothesis predicted, inside the garden ring and the TTK ring, housing prices are maximum and decrease with distance from the center. However, within the MKAD, the average price persists in the western and southwestern parts. Outside the MKAD, as well as in the eastern part beyond the Third Transport Ring, the price is below average.
Everything is much more interesting in details, we note the main areas:
In the puddles and sparrow hills there is no expensiveresidential property in the area of the sparrow hills; most likely, the entire area was built according to the boundary values above and below- Residential areas near the fundamental library of Moscow State University, under construction and constructed skyscrapers near the Mosfilm pond are more expensive, presumably due to the active construction and extensive forest areas. The high price on the territory of the memorial synagogue and square to them. Anna German is also driven by surrounding prices and her location among parks and wildlife sanctuary.
- In the area between the Krylatskoye metro station and Marshal Zhukov Avenue, housing is also considered expensive
- Despite the situation beyond the MKAD and proximity to the cemetery, houses along General Beloborodov Street are notable for their high price.
As can be seen on the maps, the theory is fully confirmed by practice and a successful combination of infrastructure, distance to the center and proximity to famous Moscow structures will be revealed by the linear interpolation function over the coordinates.
Unfortunately, the work done is largely not automated, but if the article is interesting to the Habrovsk citizens, I will build similar maps of the remaining big cities of our country.
The code of web spiders, the program itself, as well as the databases used are available through GitHub .