Non-obvious performance issues in Doctrine related to object hydration
I recently implemented API functions in a project with a Symfony2 backend using Doctrine as an ORM.
And, as it sometimes happens, the speed of mining did not quite suit me. A response to a simple request was generated as fast as 7.2 seconds.
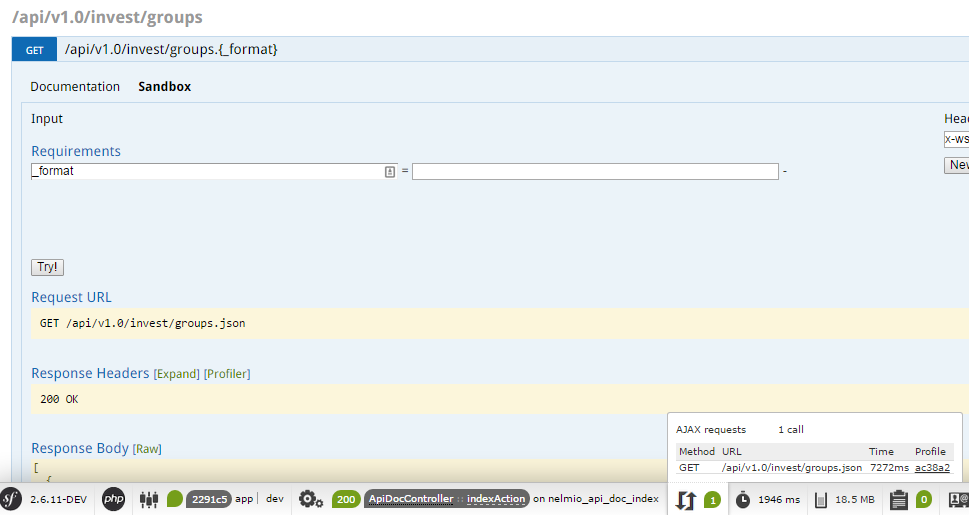
The first assumption is that some heavy queries are triggered somewhere. But through the profiler, nothing is visible that could
suggest the idea of where the problem hid. There are too many SQL queries, but all are fast, and their total execution time is only 223 milliseconds.

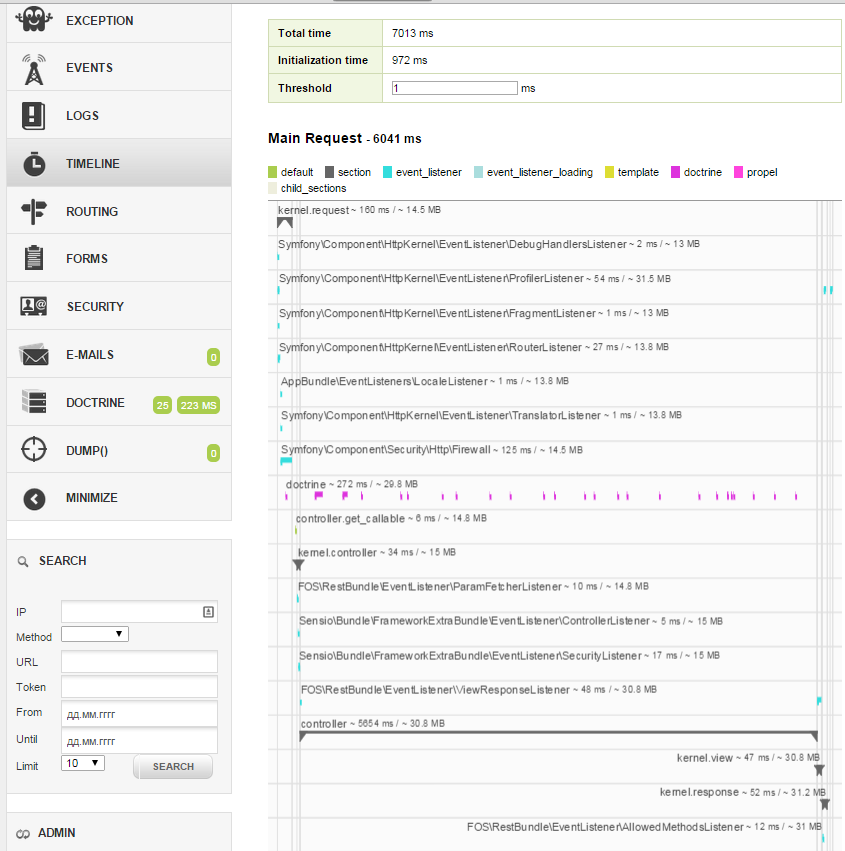
I go to the Timeline tab - it can be seen that the problem occurs during the controller’s operation (there are literally 5 lines), but where exactly it didn’t become clearer.
What turned out in the end.
It turned out that for the generation of data, some models (in the depths of long-written services) required related one-to-many objects. One object was needed, but the entire ArrayCollection of hundreds of objects was raised to access it.
Those. some of those quick queries returned hundreds of rows, on the basis of which Doctrine raised hundreds of objects, and it took a lot of resources.
This problem was solved simply. Having slightly corrected the logic of the models, by the time I accessed the related objects, I was already preparing them. Opening hours have become acceptable. But the problem, at the same time, it seems to me, can be quite typical and often arise in projects related to Doctrine. We need one attached object, everything is initialized (not too noticeable for the developer).
It would be nice to somehow control this.
Therefore, I made a bundle that collects data on the hydration time of objects inside Doctrine.
I think it can be useful for any project that uses the Symfony2 + Doctrine2 bundle.
debesha / DoctrineProfileExtraBundle (github)
After installing the bundle, an additional badge appears in the profiler panel, which shows how many hydrations were performed and how much time was spent on it:

Accordingly, the profiler in the example that I cited at the beginning looks more eloquent - on 5.5 seconds were spent hydrating objects.

And the same thing, but after optimization (which, as I said, was very simple. The most difficult thing was to localize the problem).
Hydration took 0.4 seconds (on my slow working computer).

I hope with my bundle I will save some of my colleagues a lot of time.
And, as it sometimes happens, the speed of mining did not quite suit me. A response to a simple request was generated as fast as 7.2 seconds.
The first assumption is that some heavy queries are triggered somewhere. But through the profiler, nothing is visible that could
suggest the idea of where the problem hid. There are too many SQL queries, but all are fast, and their total execution time is only 223 milliseconds.
I go to the Timeline tab - it can be seen that the problem occurs during the controller’s operation (there are literally 5 lines), but where exactly it didn’t become clearer.
What turned out in the end.
It turned out that for the generation of data, some models (in the depths of long-written services) required related one-to-many objects. One object was needed, but the entire ArrayCollection of hundreds of objects was raised to access it.
Those. some of those quick queries returned hundreds of rows, on the basis of which Doctrine raised hundreds of objects, and it took a lot of resources.
This problem was solved simply. Having slightly corrected the logic of the models, by the time I accessed the related objects, I was already preparing them. Opening hours have become acceptable. But the problem, at the same time, it seems to me, can be quite typical and often arise in projects related to Doctrine. We need one attached object, everything is initialized (not too noticeable for the developer).
It would be nice to somehow control this.
Therefore, I made a bundle that collects data on the hydration time of objects inside Doctrine.
I think it can be useful for any project that uses the Symfony2 + Doctrine2 bundle.
debesha / DoctrineProfileExtraBundle (github)
After installing the bundle, an additional badge appears in the profiler panel, which shows how many hydrations were performed and how much time was spent on it:
Accordingly, the profiler in the example that I cited at the beginning looks more eloquent - on 5.5 seconds were spent hydrating objects.
And the same thing, but after optimization (which, as I said, was very simple. The most difficult thing was to localize the problem).
Hydration took 0.4 seconds (on my slow working computer).
I hope with my bundle I will save some of my colleagues a lot of time.