GammaRay - Qt application introspection tool
- Tutorial
The Qt framework provides good development tools - the Qt Creator IDE included in it includes a designer, debugger, profiler, and other convenient things. Unfortunately, even with all this it’s sometimes not very clear why the application at the given moment looks like it looks: something is not visible, something does not look as expected, somewhere the font size is incorrect or the picture is incorrect.
Some of these problems can be solved in Qt Designer, but only a part. Qt Designer has several significant drawbacks: firstly, it incorrectly displays the position of Qt Quick components in case of active use of Javascript when calculating their coordinates and sizes, and secondly, in the designer we see the state of only the "empty" form, without data loaded into it. In general, something like a developer’s tools in any modern browser is really lacking: in order to be able to see the entire tree of components, find the one you need, see its position relative to others, properties, fix something on the fly, pick the color \ font \ size, see which handlers are hung on events, etc.
And such a tool appeared in the Qt world! Meet - GammaRay, Qt application introspection tool. GammaRay understands what Qt is, what your Qt application consists of, how the components interact in it, how they look, how events are generated and processed, etc. Let's see what GammaRay can do.
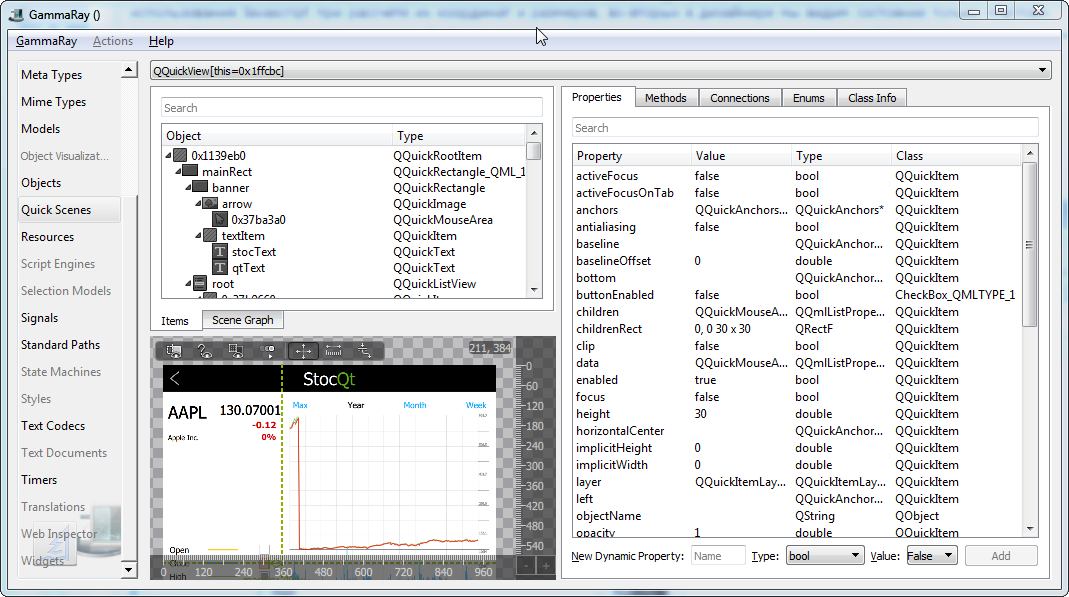
In fact, GammaRay is not one, but about 20 different tools collected in one application. Each tool is placed on its own tab. Not all tabs may be active. For example, the Quick Scenes tab is only active if the application uses Qt Quick components.
There are no binaries for Windows. Sources here: https://github.com/KDAB/GammaRay . To build under Windows + Qt 5.4, I needed to fix the CMakeLists.txt file, adding the following lines to it with the paths to my folder with Qt 5.4:
Otherwise, everything is going as it is written in the instructions (for Windows + Visual Studio):
Now you need to build some Qt application, the examples from the standard Qt delivery are quite suitable. Next, you need to start gammaray, passing it the path to the executable of the controlled application:
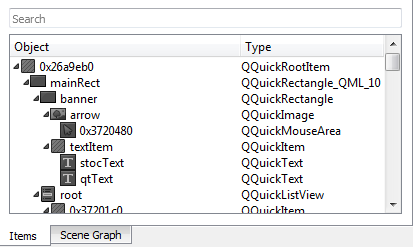
I'll start with the most interesting tab for me - Quick Scenes. It is she who is the Qt-analogue of the very same browser Developer Tools, about which I wrote above. In the upper left part of the tab, we see a tree of Qt Quick components, and not in its “original” form, but with all the objects created on runtime.
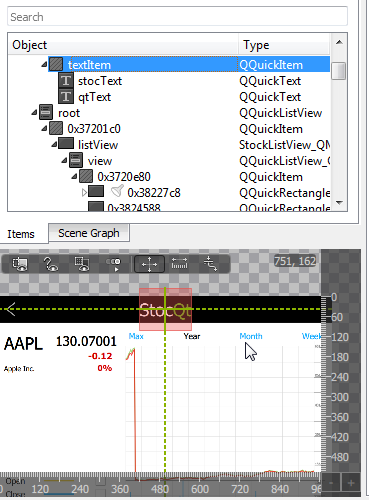
We can select the desired object in the tree - and it will be highlighted in the preview at the bottom of the window.
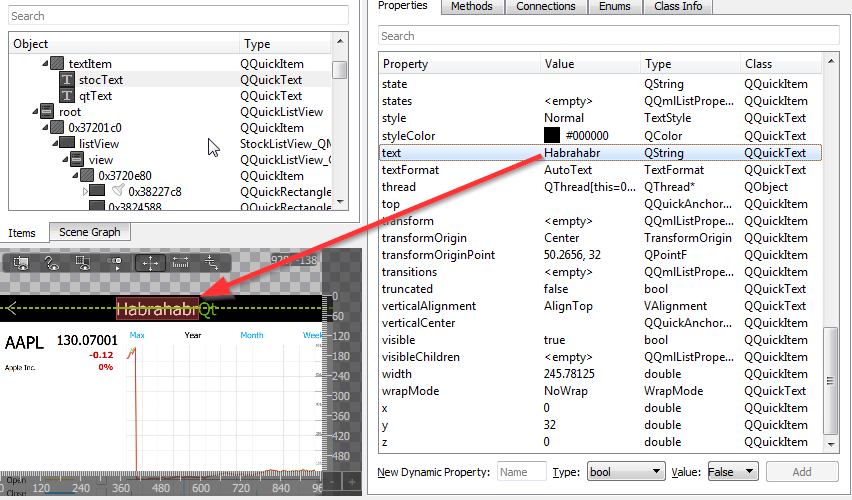
We can look at the properties of this object in the right part of the window, change them. Thus, it is convenient to select the sizes of elements, fonts, colors, and see how text of different lengths will fit in the boundaries allocated to it.
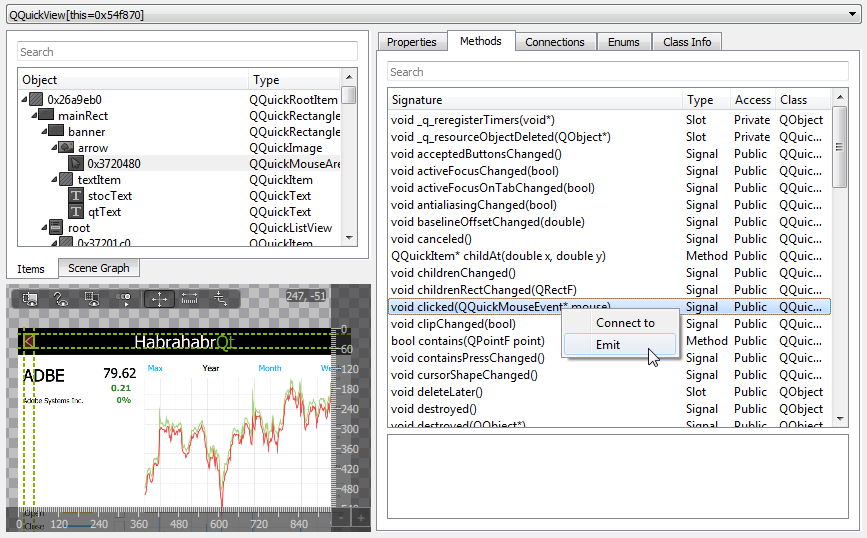
We can call a specific component method. For example, for MouseArea we can generate a “click”, which will lead to a call to the logic of its processing.
The preview window has several modes and, by the way, is “bidirectional” - i.e. the actions performed in it affect not only the preview, but also the application itself.
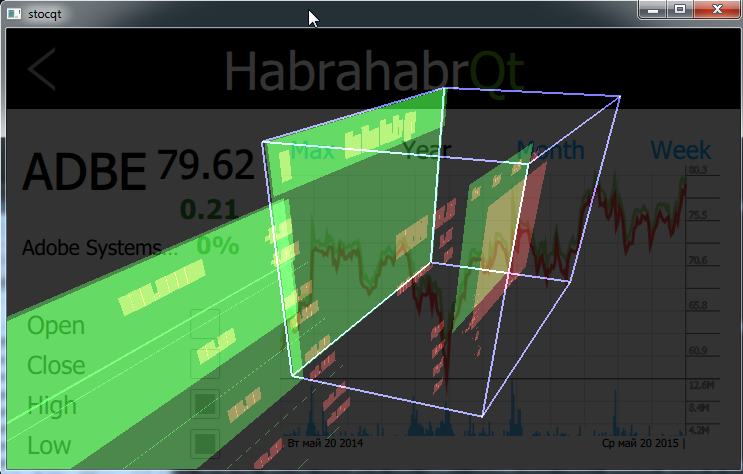
In addition, we can enable such a convenient mode of displaying content, which makes it easier to understand the relative position of the components.
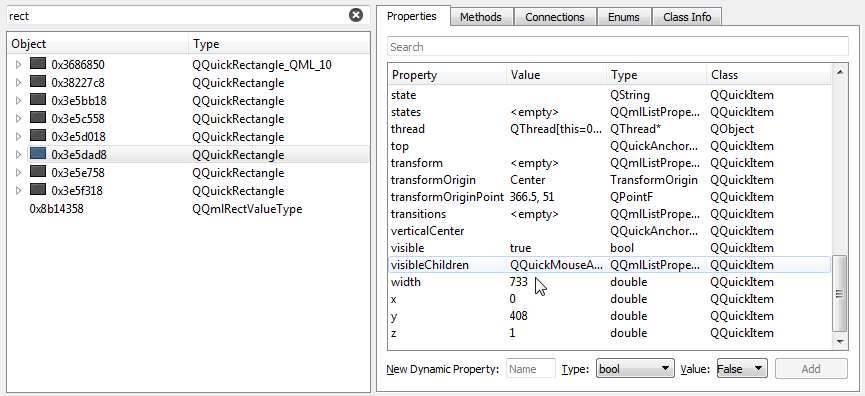
All Qt objects of your application are listed here. Functionality: listing properties, calling methods, viewing signal slots. It’s a little difficult to find a specific object, but there is a filter, sometimes it helps.
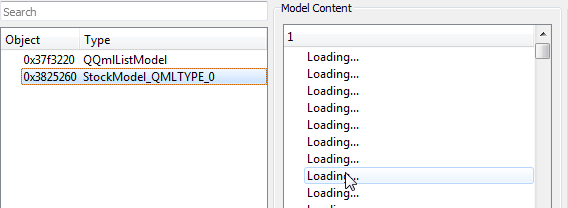
It should show the models used in the application (descendants of QAbstractListModel). In my case, the application crashed every time I open this tab. Perhaps an unstable version of GammaRay came across (I took it directly from GitHub).
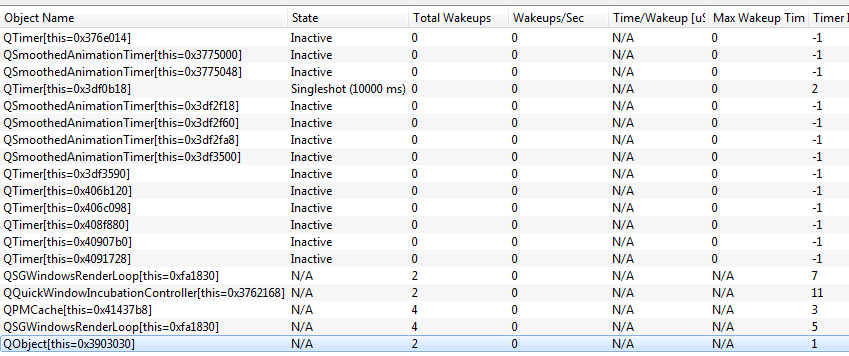
All application timers
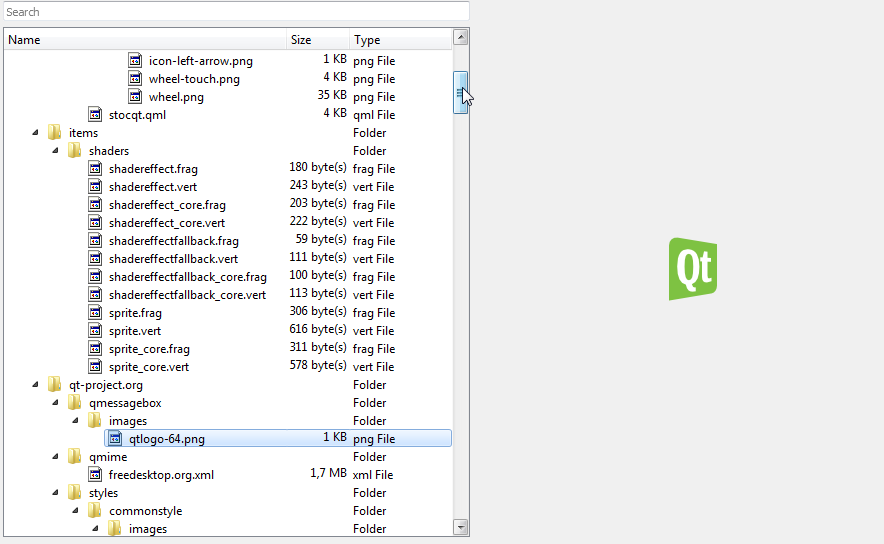
Allows you to view all the resources of a Qt application (pictures, sounds, shaders, QML code) and also export them if necessary. Not a very useful thing when working with your application (you see the same thing in the resource tree in Qt Creator), but it can help when analyzing someone else’s program.
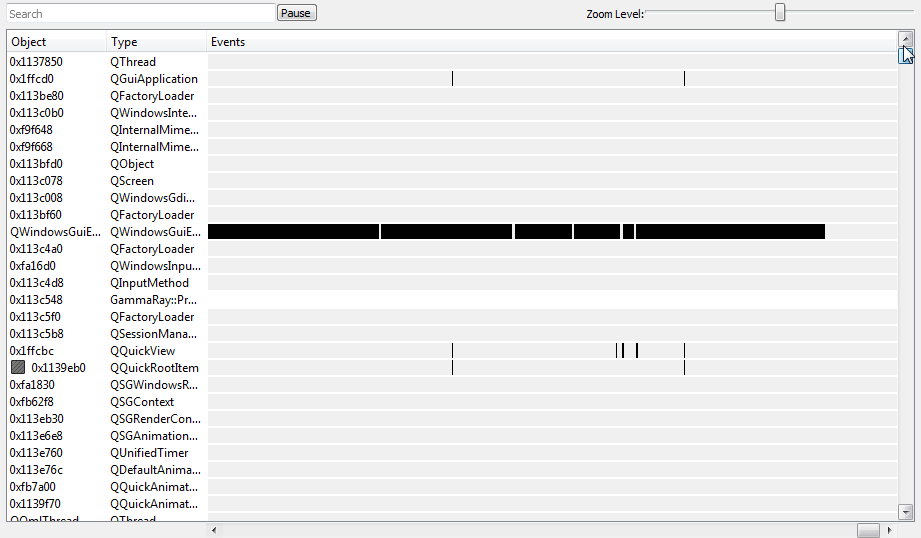
Shows events generated by all Qt objects in the application. The interface is not very convenient yet (it is poorly understood which instance of a certain type generated events, there are not enough grouping capabilities and the flexibility to search for the necessary objects). Nevertheless, with a certain dexterity, it allows you to quickly see the sequence of events, so to speak, "grasp the big picture."
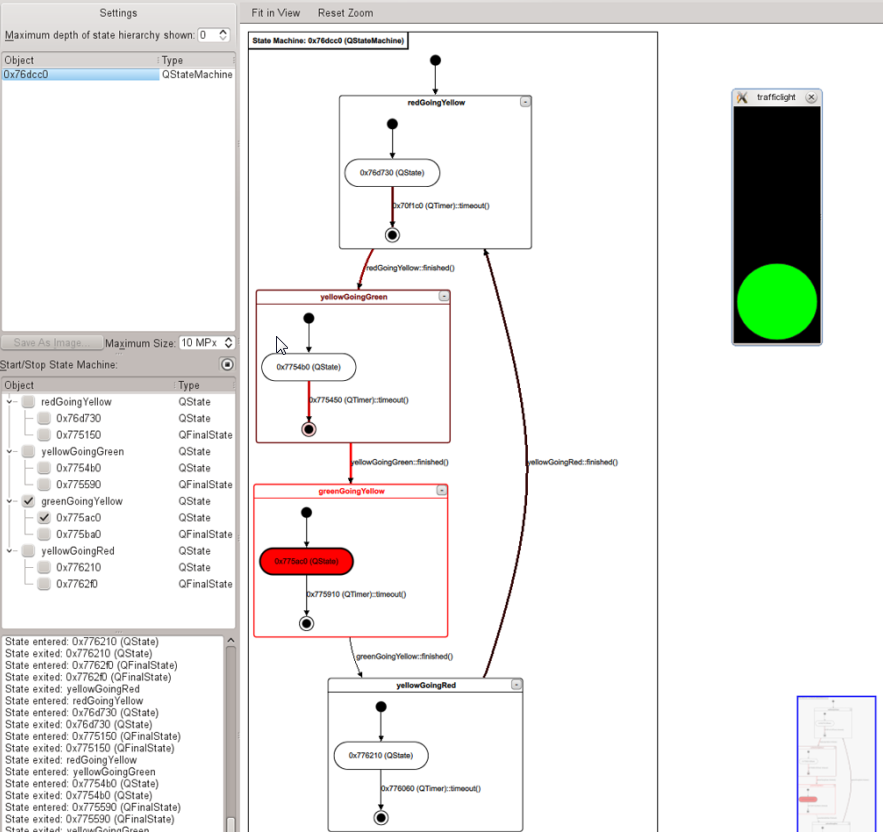
Visualization of finite state machines. It shows the machine in general, the current state, the history of transitions between states - in general, very clearly.
The rest of the GammaRay tabs seemed less interesting to me, although hardly anyone needs anything: viewing fonts, locales, logs, meta-objects, meta-types, environment variables, component styles.
In general, GammaRay is a great utility that fits well with the Qt infrastructure and allows you to save a few minutes where they can really be easily saved.
Some of these problems can be solved in Qt Designer, but only a part. Qt Designer has several significant drawbacks: firstly, it incorrectly displays the position of Qt Quick components in case of active use of Javascript when calculating their coordinates and sizes, and secondly, in the designer we see the state of only the "empty" form, without data loaded into it. In general, something like a developer’s tools in any modern browser is really lacking: in order to be able to see the entire tree of components, find the one you need, see its position relative to others, properties, fix something on the fly, pick the color \ font \ size, see which handlers are hung on events, etc.
And such a tool appeared in the Qt world! Meet - GammaRay, Qt application introspection tool. GammaRay understands what Qt is, what your Qt application consists of, how the components interact in it, how they look, how events are generated and processed, etc. Let's see what GammaRay can do.
In fact, GammaRay is not one, but about 20 different tools collected in one application. Each tool is placed on its own tab. Not all tabs may be active. For example, the Quick Scenes tab is only active if the application uses Qt Quick components.
Assembly
There are no binaries for Windows. Sources here: https://github.com/KDAB/GammaRay . To build under Windows + Qt 5.4, I needed to fix the CMakeLists.txt file, adding the following lines to it with the paths to my folder with Qt 5.4:
set(Qt5Core_DIR "D:/Qt/5.4/msvc2010_opengl/lib/cmake/Qt5Core")
set(Qt5_DIR "D:/Qt/5.4/msvc2010_opengl/lib/cmake/Qt5")
set(QT_QMAKE_EXECUTABLE "D:/Qt/5.4/android_x86/bin/qmake.exe")
Otherwise, everything is going as it is written in the instructions (for Windows + Visual Studio):
mkdir build
cd build
cmake -G "NMake Makefiles" ..
nmake
nmake install
Launch
Now you need to build some Qt application, the examples from the standard Qt delivery are quite suitable. Next, you need to start gammaray, passing it the path to the executable of the controlled application:
gammaray.exe D:\Qt\Examples\Qt-5.4\quick\demos\build-stocqt-Desktop_Qt_5_4_0_MSVC2010_OpenGL_32bit-Debug\debug\stocqt.exe
Quick Scenes Tab
I'll start with the most interesting tab for me - Quick Scenes. It is she who is the Qt-analogue of the very same browser Developer Tools, about which I wrote above. In the upper left part of the tab, we see a tree of Qt Quick components, and not in its “original” form, but with all the objects created on runtime.
We can select the desired object in the tree - and it will be highlighted in the preview at the bottom of the window.
We can look at the properties of this object in the right part of the window, change them. Thus, it is convenient to select the sizes of elements, fonts, colors, and see how text of different lengths will fit in the boundaries allocated to it.
We can call a specific component method. For example, for MouseArea we can generate a “click”, which will lead to a call to the logic of its processing.
The preview window has several modes and, by the way, is “bidirectional” - i.e. the actions performed in it affect not only the preview, but also the application itself.
In addition, we can enable such a convenient mode of displaying content, which makes it easier to understand the relative position of the components.
Objects Tab
All Qt objects of your application are listed here. Functionality: listing properties, calling methods, viewing signal slots. It’s a little difficult to find a specific object, but there is a filter, sometimes it helps.
Models Tab
It should show the models used in the application (descendants of QAbstractListModel). In my case, the application crashed every time I open this tab. Perhaps an unstable version of GammaRay came across (I took it directly from GitHub).
Timers Tab
All application timers
Resources Tab
Allows you to view all the resources of a Qt application (pictures, sounds, shaders, QML code) and also export them if necessary. Not a very useful thing when working with your application (you see the same thing in the resource tree in Qt Creator), but it can help when analyzing someone else’s program.
Signals
Shows events generated by all Qt objects in the application. The interface is not very convenient yet (it is poorly understood which instance of a certain type generated events, there are not enough grouping capabilities and the flexibility to search for the necessary objects). Nevertheless, with a certain dexterity, it allows you to quickly see the sequence of events, so to speak, "grasp the big picture."
State machines
Visualization of finite state machines. It shows the machine in general, the current state, the history of transitions between states - in general, very clearly.
The rest of the GammaRay tabs seemed less interesting to me, although hardly anyone needs anything: viewing fonts, locales, logs, meta-objects, meta-types, environment variables, component styles.
In general, GammaRay is a great utility that fits well with the Qt infrastructure and allows you to save a few minutes where they can really be easily saved.