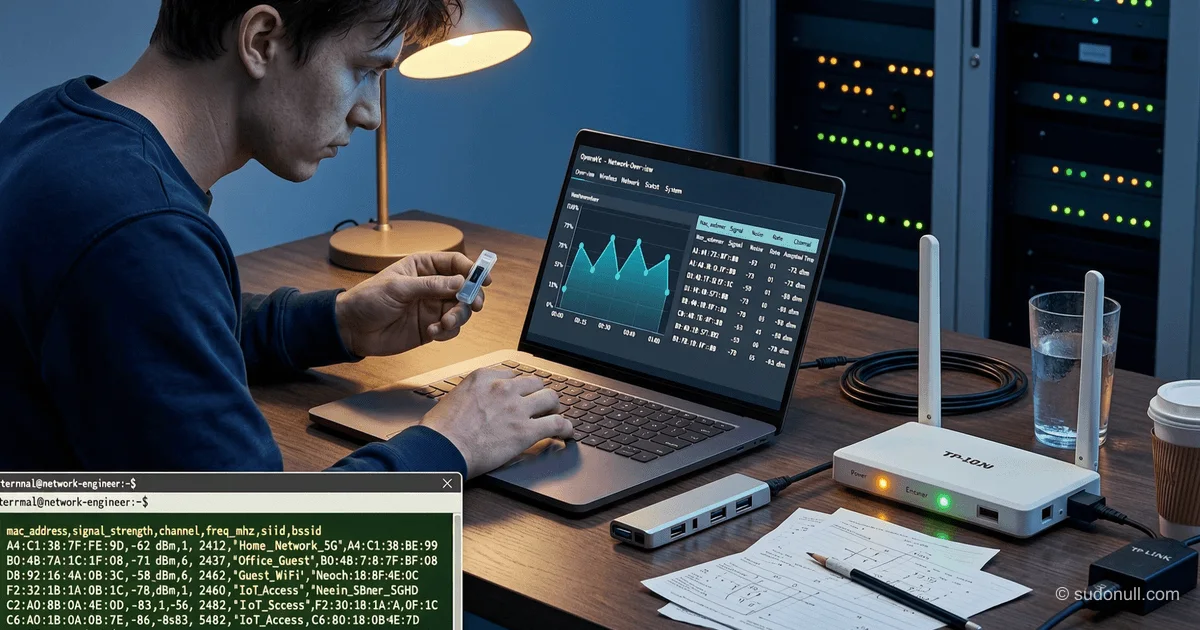
Professional Wi-Fi Spectrum Monitoring: A Technical Guide for Network Engineers
Monitoring the wireless spectrum is an essential part of a network engineer's job. This practice allows diagnosing issues, optimizing coverage, and collecting visitor analytics without breaking the law. In this article, we'll cover setting up a passive sniffer based on the TP-Link MR3020 router with OpenWrt, data collection tools, and traffic analysis methods.
Practical Applications of Wi-Fi Monitoring
Passive radio spectrum analysis solves tasks beyond standard network diagnostics. For owners of commercial spaces, it's a tool for collecting visitor data: the router in monitor mode captures unique MAC addresses of devices in the coverage area, forming foot traffic statistics without using cameras. Data is exported to CSV for building peak load graphs and staff planning.
In apartment buildings, channel utilization analysis helps avoid interference. Standard utilities show occupied channels but don't reveal traffic intensity. Long-term monitoring uncovers subtle interference—for example, when a neighbor's access point uses wide channel broadcasting amid weak signals. For engineers, this is critical when setting up WDS bridges or mesh networks.
MAC address randomization in modern OSes (iOS 14+, Android 10+) doesn't make the method useless. While identifying specific users is impossible, counting unique devices over a period remains accurate—virtual MACs change infrequently during active network use. The error margin is less than 5% with data collection intervals of 15 minutes or more.
Hardware and Software Setup
The TP-Link MR3020 router with OpenWrt 22.03+ is suitable for these tasks. The device acts as a passive sensor: the radio module is switched to monitor mode, and the interface doesn't participate in data transmission. Key components:
- Single-board computer with USB port
- External storage (minimum 4 GB) for logs
- Power via Power Bank for mobile use
First step—modify the wireless interface configuration. Edit /etc/config/wireless, adding a new section:
config wifi-iface
    option device 'radio0'
    option mode 'monitor'
    option ifname 'mon0'
    option hidden '1'
After applying wifi reload, check for the interface with ifconfig mon0. Successful setup is confirmed by output containing mon0: flags=40960<POINTOPOINT,MULTICAST> mtu 1500.
Traffic Capture and Analysis Tools
We use two tools for packet capture depending on the task. Airodump-ng (from the aircrack-ng package) provides real-time analytics:
airodump-ng -w /mnt/usb/capture --output-format csv mon0The utility generates two types of reports:
- CSV: structured data for statistics (BSSID, channel, signal level, clients)
- PCAP: raw frames for in-depth analysis in Wireshark
Tcpdump is preferred for long-term monitoring due to minimal overhead:
tcpdump -i mon0 -s 0 -W 10 -G 3600 -C 100 -w /mnt/usb/capture_%Y%m%d_%H%M%S.pcapKey parameters:
-W 10: cyclic recording (maximum 10 files)-G 3600: rotation every 60 minutes-C 100: file size limit 100 MB
802.11 frame breakdown:
- Beacon: access point beacons (estimate number of APs on the channel)
- Probe Request: client connection requests (detect hidden SSIDs)
- Data/ACK: user traffic and acknowledgments (activity indicator)
- CTS/RTS: control frames (collision signals in the air)
- BlockAck: aggregated acknowledgments (802.11n/ac mode)
Metrics analysis:
- Channel utilization: Data to ACK ratio close to 1:1 indicates efficient transmission
- Hidden stations: abnormally high CTS with low Data traffic
- Interference: sharp signal level spikes without BSSID changes
Automation and Integration
For continuous data collection, set up autostart via /etc/rc.local:
#!/bin/sh
sleep 60
MOUNT_POINT="/root"
OUTPUT_FILE="${MOUNT_POINT}/wifi_24_capture"
killall airodump-ng
airodump-ng mon0 -w "$OUTPUT_FILE" --output-format csv --write-interval 60
Important: the sleep 60 delay ensures radio interface initialization. For processing CSV logs, a Python script with the pandas library is recommended—it aggregates data by hour and detects anomalies using Z-scores.
When working with PCAP files, use tshark for filtering:
tshark -r capture.pcap -Y "wlan.fc.type_subtype == 0x08" -T fields -e wlan.bssidThis extracts BSSID from Beacon frames, forming a list of active access points.
Key Points
- Passive monitoring is legal as long as there's no traffic decryption (only header capture required)
- For foot traffic analysis, data collection intervals must exceed 15 minutes due to MAC randomization
- In multi-channel systems (802.11ac/ax), channel width (20/40/80 MHz) is critical when assessing utilization
- Tcpdump is preferred for resource-constrained devices—uses 40% less CPU than airodump-ng
- For commercial use, information about data collection must be posted (banners in coverage area)
— Editorial Team










No comments yet.