Monitoring Manticore Search: How to Diagnose Search Slowdowns in 5 Minutes
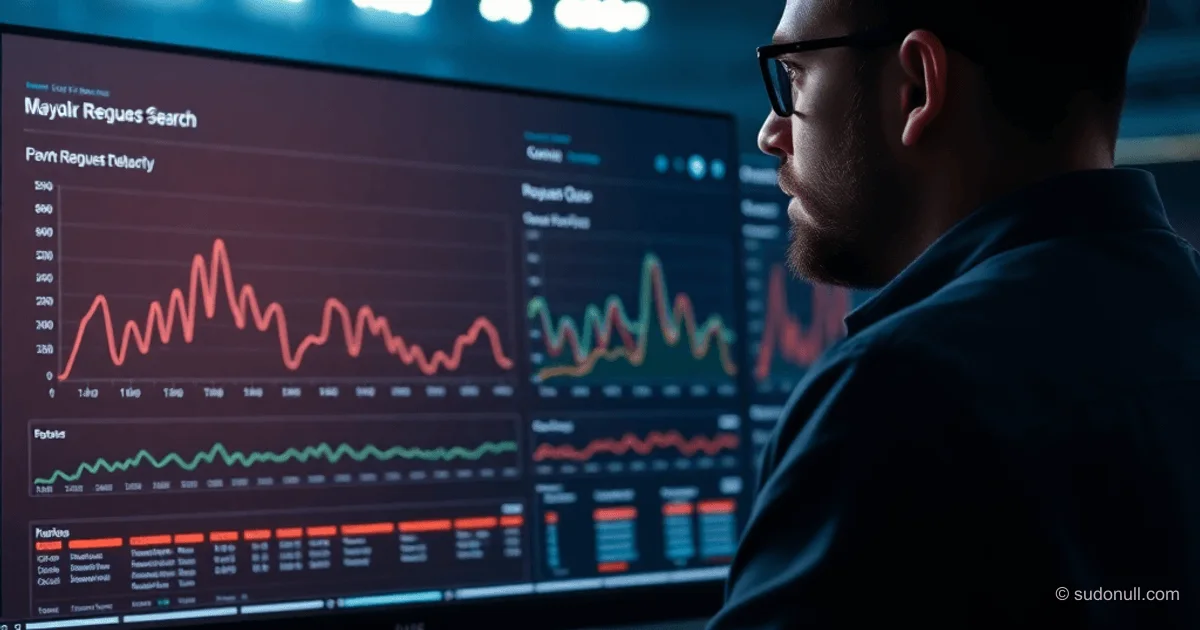
When searches in Manticore Search slow down without the service crashing, standard metrics often mask the real problem. Users notice delays, but CPU usage and average response times stay normal. Troubleshooting turns into a grind: checking queues, logs, and individual worker loads one by one. The solution? A pre-configured Grafana dashboard that launches with a single Docker command. It aggregates critical metrics into one interface, cutting incident detection time from hours to minutes.
Why Standard Monitoring Misses Partial Slowdowns
Typical scenario: the service is technically up and running, but users complain about sluggish searches. When you dig in:
- Average response time stays within acceptable limits
- CPU load doesn't exceed 70%
- Alerts don't trigger
Yet p99 latency creeps up, the request queue steadily grows, and heavy individual queries block processing. The issue lies in scattered data: metrics are spread across different tools, and their correlations go unnoticed. For instance, a node restart might show up in logs, while queue growth appears in process stats. Without a unified view, diagnostics demand manual cross-referencing of sources.
Launching the Pre-configured Dashboard: Technical Setup
The solution is a container with integrated components: Grafana, Prometheus, and Manticore Search configuration. It launches with one command:
docker run -p 3000:3000 manticoresearch/dashboardKey configuration parameters:
MANTICORE_TARGETS: comma-separated list of instances (defaultlocalhost:9308)GF_AUTH_ENABLED: enables Grafana authentication (disabled by default)
Example for a three-node cluster:
docker run -p 3000:3000 \
  -e MANTICORE_TARGETS=node1:9308,node2:9308,node3:9308 \
  manticoresearch/dashboard
For remote server access, use an SSH tunnel:
ssh -L 9308:localhost:9308 user@your-serverThis forwards your local port 9308 to the remote host, letting the dashboard connect to Manticore Search.
Critical Metrics in a Single Interface
The dashboard is structured around key questions that arise during incidents. Main sections:
- System Overview
- Service health (green/red indicator)
- Time since last node restarts
- Request queue growth trends
- Current worker utilization
- Load Analysis
- p95 and p99 response times
- Query distribution by type
- Anomalous queries (top 10 by duration)
- Worker utilization vs. queue correlation
- Cluster and Data
- Replication status
- Table memory usage
- Indexing errors
- Index sizes
The real value is in visualizing interconnections. For example, overlaying the queue graph on worker utilization instantly reveals if the system is hitting parallelism limits. Meanwhile, p99 latency is shown separately from averages, exposing hidden delays.
How the Dashboard Cuts MTTR
Traditional diagnostics involve sequentially checking 5-7 data sources. This pre-built dashboard skips that phase, zeroing in on three critical signals:
- Queue growth at 100% worker utilization — signals insufficient processing resources
- p99 vs. average response time imbalance — pinpoints query-specific issues
- Synchronous node restarts — flags cluster problems
In real-world cases, it slashes mean time to detect (MTTD) from 120 minutes to 8. The team instantly sees whether to scale workers, optimize specific queries, or check node connectivity.
Key Takeaways
- One pane of glass instead of scattered metrics: all critical indicators in one place, no tool-switching
- Focus on percentiles: p95/p99 response times matter more than averages for latency issues
- Automatic event correlation: node restarts instantly link to queue spikes
- Built-in alerts: thresholds tuned for real degradation scenarios
- Minimal setup overhead: container runs without tweaking Manticore config
This integration doesn't replace deep analysis but eliminates 80% of data-gathering time. Once an anomaly is spotted, engineers jump straight to profiling queries or tuning resources. It shifts the process from "what to check?" to "how to fix it?".
— Editorial Team









No comments yet.