Intel® Graphics Technology. Part III: Effective Chart Computing
In the comments to the last post , a very important question was raised - will there really be a performance gain from uploading calculations to integrated graphics, compared to performing only on a CPU? Of course, it will, but you need to follow certain programming rules for efficient computing on the GFX + CPU.
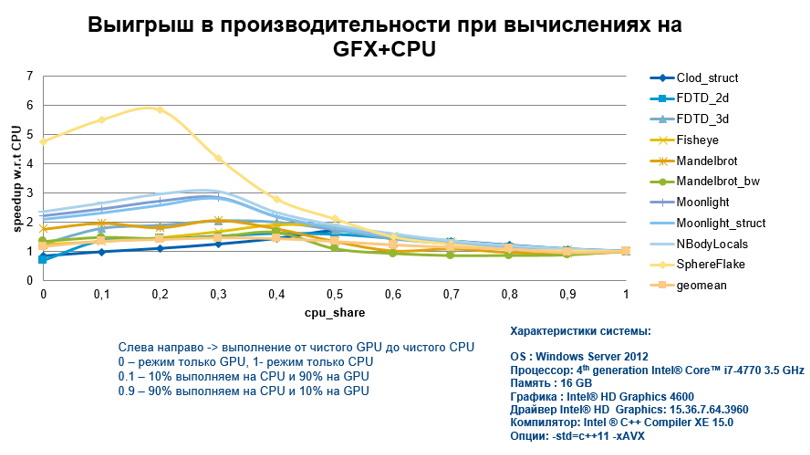
In confirmation of my words, I will immediately present the acceleration graph obtained by performing calculations on the integrated graph for various algorithms and with a different degree of CPU involvement. At KDPV we see that the gain is more than significant.
Many will say that it’s not at all clear what kind of algorithms these are and what they did with this code to get such results.
Therefore, we will consider how to achieve such impressive results for efficient execution on GFX.
To begin with, let's try to bring all the features and methods together, taking into account our knowledge about the specifics of the hardware itself, and then move on to implementation using a specific example using Intel Graphics Technology. So what to do to get high performance:
- We increase the iterative space due to the use of nested cilk_for. As a result, we have a larger resource for concurrency and more threads on the GPU can be used.
- To vectorize the code (yes, for the GPU it is just as important as for the CPU), which will be offline, use the pragma simd directive or the Intel®Cilk ™ Plus array notation.
- We use the keywords __restrict__ and __assume_aligned () so that the compiler does not create different versions of the code (code paths). For example, it can generate two versions for working with aligned and not aligned memory, which will be checked in runtime and execution will go on the desired "branch".
- Do not forget that the pin in the pragma offload directive allows you to avoid overhead from copying data between DRAM and card memory and allows you to use shared memory for the CPU and GPU.
- We prefer working with 4-byte elements than 1- or 2-byte ones, because gather / scatter operations with this size are much more efficient. For the case of 1.2 bytes, they are much slower.
- Even better is to avoid gather / scatter instructions. To do this, use the SoA (Structure of Arrays) data structure instead of AoS (Array of Structures). Everything is extremely simple here - it is better to store data in arrays, then access to the memory will be consistent and efficient.
- One of the strengths of GFX is its 4 KB register file for each stream. If local variables exceed this size, you will have to work with much slower memory.
- When working with the int buf [2048] array selected in the register file (GRF), indexed access to the register will be performed in a loop of the form for (i = 0.2048) {... buf [i] ...}. In order to work with direct addressing, we do a loop unrolling using the pragma unroll directive.
Now let's see how it all works. I did not take the simplest example of matrix multiplication, but modified it a bit, using Cilk Plus array notation for vectorization and cache blocking optimization .
I decided to honestly change the code and watch how performance changes.
void matmul_tiled(float A[][K], float B[][N], float C[][N])
{
	for (int m = 0; m < M; m += TILE_M) {                 // iterate tile rows in the result matrix
		for (int n = 0; n < N; n += TILE_N) {             // iterate tile columns in the result matrix
			// (c) Allocate current tiles for each matrix:
			float atile[TILE_M][TILE_K], btile[TILE_N], ctile[TILE_M][TILE_N];
			ctile[:][:] = 0.0;                            // initialize result tile
			for (int k = 0; k < K; k += TILE_K) {         // calculate 'dot product' of the tiles
				atile[:][:] = A[m:TILE_M][k:TILE_K];      // cache atile in registers;
				for (int tk = 0; tk < TILE_K; tk++) {     // multiply the tiles
					btile[:] = B[k + tk][n:TILE_N];       // cache a row of matrix B tile
					for (int tm = 0; tm < TILE_M; tm++) { // do the multiply-add
						ctile[tm][:] += atile[tm][tk] * btile[:];
					}
				}
			}
			C[m:TILE_M][n:TILE_N] = ctile[:][:];  // write the calculated tile to back memory
		}
	}
}
The advantages of such an algorithm with block work with matrices are understandable - we are trying to avoid a cache problem, and for this we resize TILE_N, TILE_M and TILE_K. Having collected this example, the Intel compiler with optimization and the size of the matrices M and K equal to 2048, and N - 4096, I launch the application. The rendering time is 5.12 seconds. In this case, we used only vectorization by means of Cilk (and, moreover, a set of SSE default instructions). We need to implement and parallelism in tasks. You can use cilk_for for this:
cilk_for(int m = 0; m < M; m += TILE_M)
...
We rebuild the code and run it again. Expectedly, we get almost linear acceleration. On my system with 2 core processors, the time was 2.689 seconds. It's time to enable offload on the schedule and see what we can win in performance. So, using the pragma offload directive and adding the nested cilk_for loop, we get:
#pragma offload target(gfx) pin(A:length(M)) pin(B:length(K)) pin(C:length(M))
	cilk_for(int m = 0; m < M; m += TILE_M) {
		cilk_for(int n = 0; n < N; n += TILE_N) {
...
The application with the offload took 0.439 seconds, which is pretty good. In my case, additional modifications with unrolling cycles did not show a significant increase in performance. But the key role was played by the matrix algorithm. The sizes TILE_M and TILE_K were chosen to be 16, and TILE_N to 32. Thus, sizeof (atile) was 1 KB, sizeof (btile) was 128 B, and sizeof (ctile) was 2 KB. I think it’s clear why I did all this. That's right, the total size of 1 KB + 2 KB + 128 B turned out to be less than 4 KB, which means we worked with the fastest memory (register file) available to each thread on GFX.
By the way, the usual algorithm worked much longer (about 1.6 seconds).
For the sake of experiment, I turned on the generation of AVX instructions and a few more accelerated execution only on the CPU up to 4.098 seconds, and the version with Cilk for tasks - up to 1.784. Nevertheless, it was offload on GFX that significantly increased productivity.
I was not too lazy, and decided to see what VTune Amplfier XE could profile in a similar application.
I collected code with debug information and launched Basic Hotspot analysis with a checkmark 'Analyze GPU usage':

Interestingly, for OpenCL there is a separate option. Having collected the profile and climbed the Vtune tabs, I found the following information:
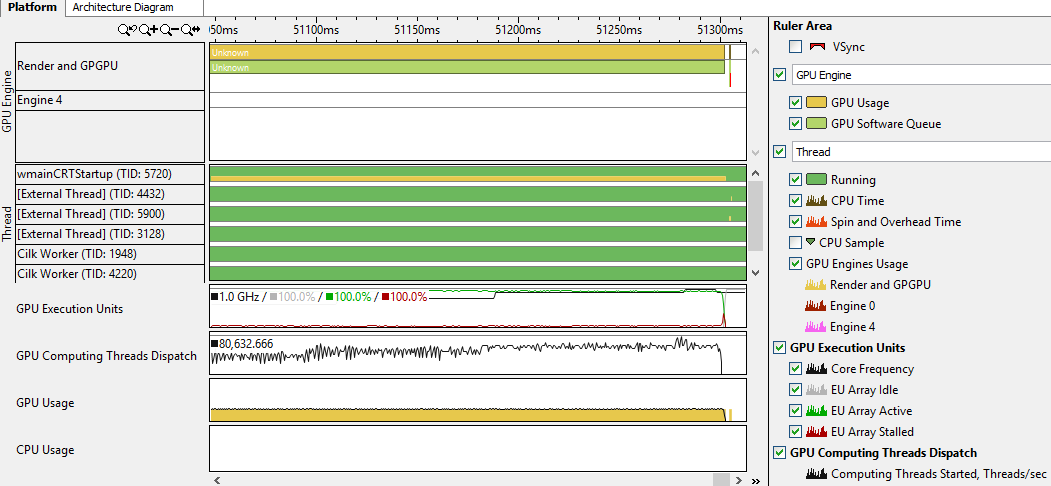
I can’t say that I learned a lot from this. Nevertheless, I saw that the application uses the GPU, and even noticed on the timeline the moment when the offline started. In addition, it is possible to determine how efficiently (in percent) all the cores on the graph (GPU EU) were used over time, and generally evaluate the use of GPUs. I think that if necessary it’s worth digging here longer, especially if the code was not written by you. Colleagues assured that you can still find a lot of useful things with VTune when working with the GPU.
In the end, it is worth saying that there is a gain from using the offload on the integrated graphics in the processor, and it is very significant, subject to certain code requirements, which we talked about.