Building Charts and Graphs in Doxygen
This article is part of the resulting series of articles on the Doxygen documentation system:
- Documenting code efficiently with Doxygen
- Documentation at Doxygen
- Building Charts and Graphs in Doxygen
She completes a series of articles on the Doxygen documentation system . This time, the article is devoted to the construction of various diagrams and graphs in Doxygen. In it, we will consider their main types, various ways of setting them up and design, as well as give a number of examples and tips for their use.
Introduction
Doxygen allows you to automatically build on the basis of the source code a fairly large number of various diagrams and graphs designed to illustrate certain elements of the source code, while any graph can also serve as a way to navigate through the code and documentation, since Doxygen automatically puts links on top of the graph itself sections of the documentation. You can see the result of his work live, for example, here and here (in the last example they are folded for compactness).
The main types of diagrams and graphs that can be built using it are:
- Class inheritance diagram
- Class Cooperation Diagram
- Class hierarchy diagram
- Call graph
- Calling Function Graph
- Dependency graph (forward and reverse)
Next, we will consider each of these types in detail, but first we will make a number of general remarks and talk about the main settings that will be useful to us in their construction. In general, much of what will be described can be found in the corresponding section of the documentation .
Fundamentals of building diagrams and graphs
By default, the capabilities of Doxygen for constructing various kinds of diagrams and graphs are very limited (only a class inheritance diagram is available), an example of such a diagram is given below:

In order to build more advanced diagrams and graphs, Graphviz, a special open source software designed to build various kinds of graphs, is required counts. You can download it here .
After installing it, you need to make some changes to the Doxygen settings file. To do this, use the following commands:
| Command | Appointment |
| HAVE_DOT | Shows that you need to use Graphviz to generate charts and graphs (disabled by default) |
| DOT_PATH | Specifies the path to the executable file "dot.exe" (by default it is assumed that the path to it is in the path variable ; as a rule, it is). |
| Command | Appointment |
| DOT_GRAPH_MAX_NODES | Sets the maximum number of nodes to be displayed in the graph. If the number of nodes becomes greater than the set value, the graph will be truncated, as a result of which the parent node whose child nodes were hidden will be highlighted in red (if the number of nodes was set less than the number of children of the root node, it will not be shown at all) |
| MAX_DOT_GRAPH_DEPTH | Sets the maximum depth of the graph (the depth is equal to the number of faces from the most distant node of the graph to the root node). Again, if the depth of the graph exceeds this value, then it will be cut off, as a result of which the parent node, whose child nodes were hidden, will become highlighted in red |
| DOT_IMAGE_FORMAT | Specifies the format in which charts and graphs will be created (“png”, “jpg”, “svg”, “gif” are supported) |
| DOT_FONTNAME | Sets the headset used to display text on graphs and charts. |
| DOT_FONTSIZE | Indicates the size (letter height, measured in points) for text in graphs and charts. |
| DOT_FONTPATH | Specifies the path to the folder with font files |
| HTML_DYNAMIC_SECTIONS | If this option is set, Doxygen will collapse certain elements of the HTML documentation (for example, columns), which the user can subsequently expand |
Class inheritance diagram
The class inheritance diagram (class graph) is designed to graphically display inheritance relationships between classes (both "up" and "down").
In order to generate such a diagram for all documented classes (in this case, if the EXTRACT_ALL option is set in the settings file, for example, all classes belong to documented classes), you must set the following option in the settings file:
CLASS_GRAPH = YES
The following is an example of constructing such a diagram for a test case (it is taken from the legend created by Doxygen), illustrating the different types of relations between classes:
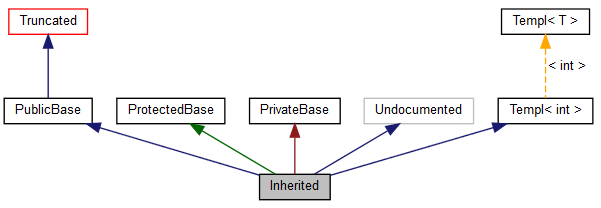
Sample source code and settings used
Changed Settings:
Source code of an example:
CLASS_GRAPH = YES
MAX_DOT_GRAPH_DEPTH = 2
TEMPLATE_RELATIONS = YES
Source code of an example:
/*! Invisible class because of truncation */
class Invisible { };
/*! Truncated class, inheritance relation is hidden */
class Truncated : public Invisible { };
/*! Class that is inherited using public inheritance */
class PublicBase : public Truncated { };
/*! A template class */
template class Templ { };
/*! Class that is inherited using protected inheritance */
class ProtectedBase { };
/*! Class that is inherited using private inheritance */
class PrivateBase { };
/*! Class that is used by the Inherited class */
class Used { };
/*! Super class that inherits a number of other classes */
class Inherited : public PublicBase,
                  protected ProtectedBase,
                  private PrivateBase,
                  public Undocumented,
                  public Templ
{
  public:
    Used *m_usedClass;
};
Now consider what these or other conventions mean.
 | Root node |
 | Normal node corresponding to a documented class |
 | Node corresponding to an undocumented class |
 | A parent node whose child nodes were hidden (for example, due to a limit on the number of nodes in the graph or its depth) |
 | Indicates Open Inheritance |
 | Indicates Secure Inheritance |
 | Indicates Closed Inheritance |
 | Indicates that the class is a specialization of some template class, while the signature next to the arrow indicates which template parameter was specified during the specialization |
| Option | Value | Default |
| HIDE_UNDOC_RELATIONS | Shows whether it is necessary to hide the connection with some class if it is undocumented or not a class. | Yes |
| TEMPLATE_RELATIONS | Sets whether to display a relationship indicating that one class is a specialization of another | NO |
Class Cooperation Diagram
The class collaboration diagram is intended for graphical display of inheritance relations between classes (only “up”, that is, only parent classes will be shown), as well as the interaction between them, which in this case means what one class contains among the attributes an object of another class.
To enable the class inheritance diagram, you must set the COLLABORATION_GRAPH command:
COLLABORATION_GRAPH = YES
Below is a diagram of class cooperation for the same example that was considered earlier:

It should be noted that in this case, the difference from the class inheritance diagram is only that the relationship between the Inherited and Used classes is displayed , which is expressed in the fact that the first class has an attribute that is an instance of the second class. The designation for this relationship is as follows:
 | Indicates that one class contains an attribute that is an instance of another class, and the signature next to the arrow indicates the name of the corresponding attribute |
Class hierarchy diagram
The graphical hierarchy diagram is intended only to show inheritance relationships between many different classes. In fact, it is a graphical representation of the text description of the class hierarchy, which is generated by default:

Call graph
Before proceeding to the description of this type of graph, we agree that everything said below is true for functions and class methods, but for brevity we will use the word "functions". So, the call graph illustrates which functions are called inside the body of the documented function, as well as in all nested functions (the depth can be adjusted by setting the maximum depth of the graph in the settings file).
In order to build a graph of function calls, two approaches can be used: setting an option that will cause building graphs of calls for all functions, and using a special command that is added to the function description (the latter may be preferable if you need to illustrate a specific function or your the project is very large).
For the first approach, you must set the following option:
CALL_GRAPH = YES
For the second approach, the following command is used:
\callgraph
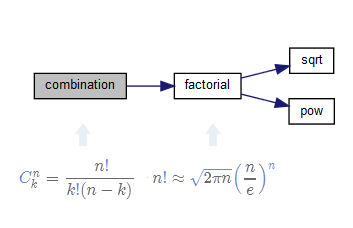
An example of a call graph is shown below. The formulas in the image below are given as an example (the combination function calculates the number of combinations, and uses the Stirling formula to calculate the factorial):
Calling Function Graph
The graph of calling functions (caller graph), illustrates the chain of calls of various functions as a result of which the documented function is called (the depth of such a chain can be adjusted by setting the maximum depth of the graph in the settings file).
Again, there are two ways to construct such graphs. The first way is to install the corresponding option in the settings file:
CALLER_GRAPH = YES
The second way is to use a special command:
\callergraph
A simple example of a graph of calling functions is given below:

Let us briefly explain it: to calculate the factorial using the Stirling formula, we use the function of raising to the power ( pow ), this function is also used to calculate the exponential, and the calculation of the exponent can be used to calculate the values of hyperbolic functions.
Dependency graph
The dependency graph is ideologically close to the call graph, but it does not illustrate calls, but the dependencies between the various source code files.
Direct dependency graph
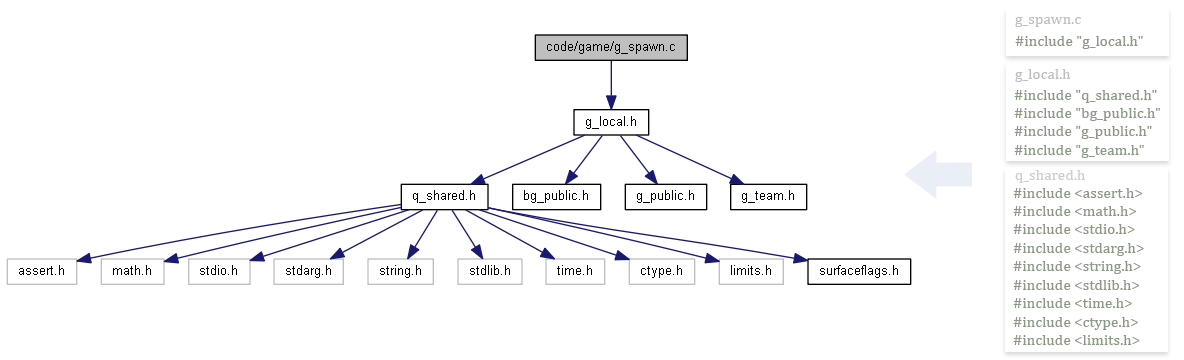
A direct dependency graph (include graph) illustrates a chain of dependencies up to the documented file, i.e. which files were connected to the document file, then which files, in turn, were connected to those files, etc.
To build such graphs, you need to set the following option in the settings file:
INCLUDE_GRAPH = YES
An example is given below:
Inverse Dependency Graph
An inverse dependency graph (included by graph) illustrates a chain of dependencies on the document being documented, i.e. which files include the documented file, then which files include these files, etc.
To build such graphs, you need to set the following option in the settings file:
INCLUDED_BY_GRAPH = YES
An example is given below:

Directory Count
The directory graph is a graphical representation of the directory in question. To build such a graph, use the following option:
DIRECTORY_GRAPH = YES
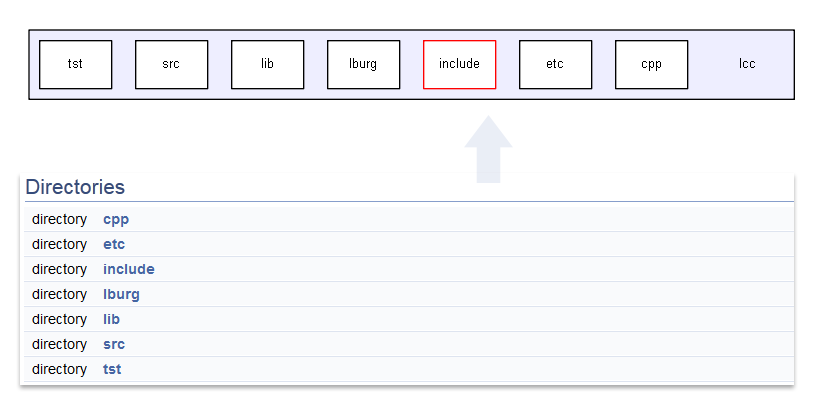
Pay attention to the fact that one of the graph elements has a red stroke, which means that other directories are embedded in this directory.
UML and Doxygen
Doxygen allows you to create charts "in a style similar to the Unified Modeling Language." Developers are very accurately expressed in this regard, since this feature does not imply that an accurate and competent UML scheme will be built on the basis of the code, other tools should be used for this task, and they often fail, because UML is primarily expressed an idea, albeit sometimes quite close to a specific implementation.
So, in order to build diagrams in the UML style, you need to set the following option:
UML_LOOK = YES
Let us again turn to the example used earlier, just supplement it with open, closed and protected attributes and methods:

Unfortunately, Doxygen is often not able to reflect many more complex concepts, if only because you cannot specify which specific classes you need to include in the diagram. Therefore, in cases where it is necessary to illustrate, for example, the applied design pattern or some other solution, it is sometimes easier and more efficient to build a circuit in another editor and simply import it. Fortunately, for one of the very common specialized PlantUML editors , Doxygen has built-in support (to use it, you must specify the path to the option).
First of all, you need to make sure that Java is installed on your computer and configured correctly and then specify the correct path to the jar file using the appropriate option:
PLANTUML_JAR_PATH = путь_к_jar_файлу
After that, to insert the PlantUML diagram, you need to use the corresponding \ startuml and \ enduml commands :
\startuml [{file}] ["caption"] [=]
 ...
\enduml
All parameters in this case are optional. The file parameter specifies the name for the generated file; if not specified, it will be selected automatically; the caption parameter sets the signature to the scheme; the last parameter is used to indicate the size of the circuit.
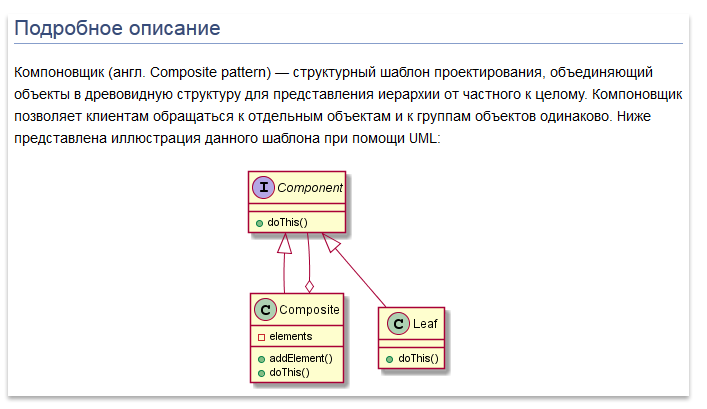
Now let's go directly to the example (the diagram for the “layout” design template is shown below):
/*! \file
Компоновщик (англ. Composite pattern) — структурный шаблон проектирования, объединяющий объекты в древовидную структуру для представления иерархии от частного к целому. Компоновщик позволяет клиентам обращаться к отдельным объектам и к группам объектов одинаково. Ниже представлена иллюстрация данного шаблона при помощи UML:
\startuml
    interface Component {
       +doThis()
    }
    class Composite {
       -elements
       +addElement()
       +doThis()
    }
    class Leaf {
       +doThis()
    }
    Component <|-- Leaf
    Component<|-- Composite
    Composite  o-- Component
\enduml
*/
The result is presented below:
Conclusion
Finally, it should be noted that the schemes can be built in any editor you prefer or using other generators, and then import the result into Doxygen. In general, it all depends on your requirements and the tasks that confront you; in some cases, the opportunities that Doxygen provides you with are enough, and then I hope this article will be a pleasant find for you; and sometimes they may not be enough and then the use of other tools and other solutions will be required.
Thanks for attention!