How to prepare TCP
- Tutorial

When someone or something becomes ill, it takes more than just a statement of this fact.
The first is diagnosing the problem, identifying the causes of the failure.
Take and measure pressure, palpate, check the oil level in the engine and so on, and so on.
But what if problems arose when transferring data to the Internet / Intranet?
Here, apparently, special diagnostic tools will be required.
In particular, tools that allow statistical analysis of a large amount of data will be useful.
There are many different tools.
Some of them can be found in such a wonderful program as Wireshark.
The Wireshark Statistics menu offers a wealth of functionality.
Moreover, the results can be presented not only in general, but also in graphical form.
Just about the graphic form and I want to talk.
Talk about a set of five TCP StreamGraph statistics graphs.
Allow easy and efficient analysis and diagnostics of TCP connections.
But before we start talking about graphs, for a better understanding of them, let us consider the basics of TCP theory.
Minimum Required for Understanding TCP StreamGraph
- TCP ( Transmission Control Protocol ) is a transport layer protocol responsible for the guaranteed delivery of data from one network node to another. On top of TCP, application-level protocols such as HTTP , FTP , SMTP , TELNET and others work.
- Guaranteed delivery to TCP is achieved through the use of acknowledgment and retry mechanisms.
After a portion of the data is transferred, the sender waits for confirmation from the recipient of the delivery. If confirmation does not arrive, resending is performed. - The data to be sent at the TCP level is represented by a stream of bytes, where each byte is sequentially numbered. TCP divides the stream into parts - segments - and transfers them to a lower (network) level for sending to the recipient. The segment header indicates its number ( Sequence number , Seq) - the number of the first byte of the segment in the general stream.
- The receiver receives the segments and collects from them an initial continuous stream of bytes, sends acknowledgments.
The header indicates the confirmation number (Ack) - the serial number of the next segment expected from the sender. Ack means that the entire continuous sequence of bytes from the first to Ack-1 is received successfully. According to the specification, confirmation for each segment is not required. One confirmation can be sent to several received segments at once. - The recipient not only confirms the incoming data, but also controls the intensity of their receipt.
The confirmation header indicates the size of the receive window ( Window , Win).
The sender sends segments with data whose size does not exceed the size of Win.
If the receiver reports zero Win, data transfer is suspended until a larger size is specified. - Data transfer between two network applications is preceded by a TCP connection.
Upon completion of the exchange, the connection is closed.
A connection is uniquely identified by a pair of host IP address values, the port number of the application.
The application initiating the connection (client) each time receives an arbitrary port number in the OS and releases it after the data transfer session is completed.
An application waiting for connections (server) always uses a constant port number until it shuts down.
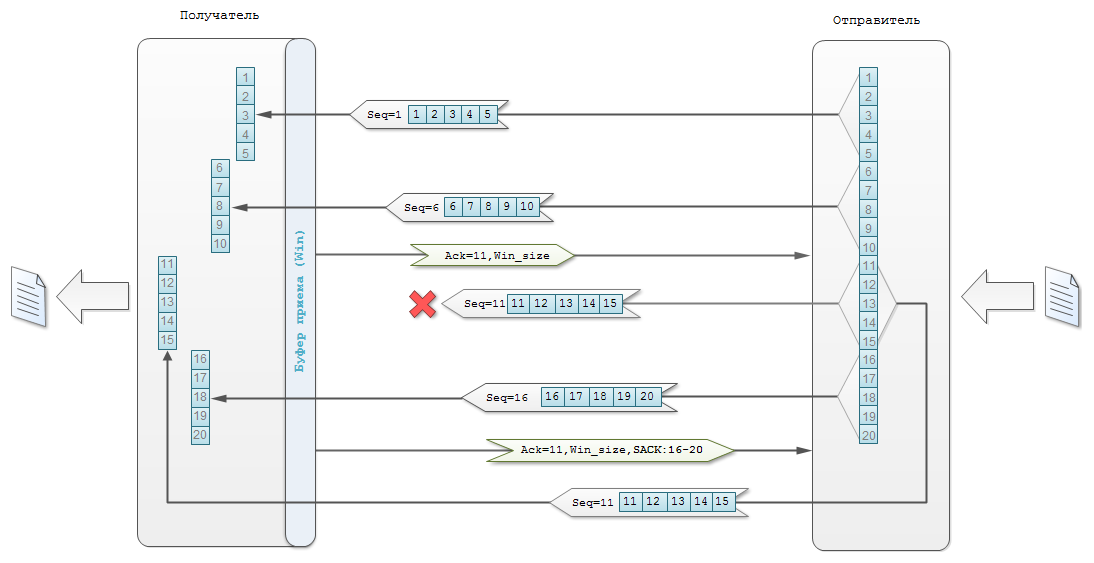
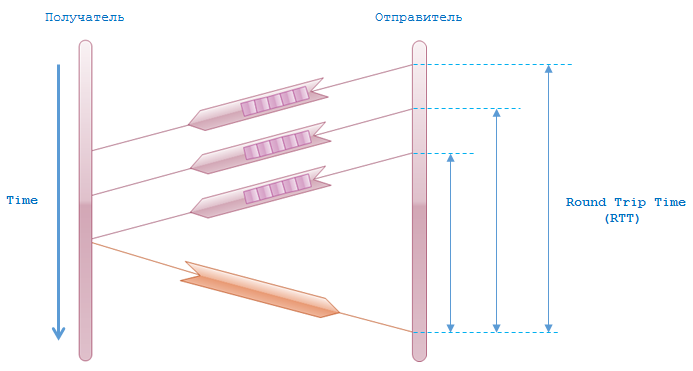
Below is a picture with a special case of TCP data exchange.
It should be considered as a simplified option.
In the example, the segment numbering starts with one.
Although in reality this is not entirely true.
However, Wireshark also shows the same in default settings.
The sender sends two segments (Seq = 1 and Seq = 6) containing five bytes of data each.
The receiver replies that all bytes up to 10 were received successfully and the next 11th segment is expected (Ack = 11).
The sender transmits two more (Seq = 11 and Seq = 16), one of which is lost in the network (Seq = 11).
The recipient states that a gap has occurred in the stream of received data.
It reports that starting from the first byte, only 10 bytes are continuously received and it is still waiting for the 11th segment (Ack = 11).
However, at the same time, it indicates SACK ( Selective acknowledgment in the confirmation segment)., selective confirmation) block, with a range of bytes received after the break. Thanks to SACK, the sender will retransmit only the missing segment (Seq = 11). Without SACK, you would need to repeat Seq = 16 too. Use of SACK must be supported by both parties to the exchange.
Now consider the process of transferring data in a TCP connection through a TCP StreamGraph in Wireshark.
However, in order not to describe the graphs just like that, I will do it on a simple and understandable example.
I’ll upload the file from the test server to my computer using the HTTP protocol.
To do this, I will use the curl utility, and not a web browser.
curl will help to create some problems that we will see on the graphs.
Problems arise because the download will be directly to the console, and not to the file.
So, I launch Wireshark, turn on traffic capture.
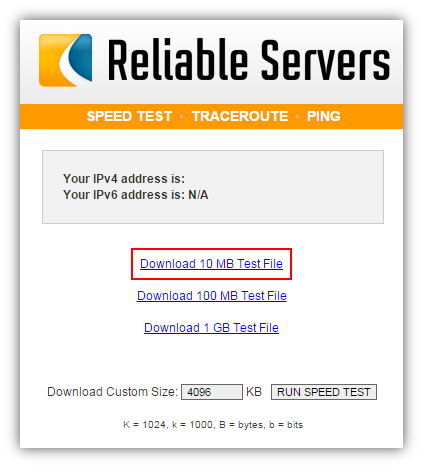
I load the curl utility with a test file of size 10 MB from the server v4.speedtest.reliableservers.com (10MBtest.bin).
curl 'http://v4.speedtest.reliableservers.com/10MBtest.bin'
Stop traffic capture.
In the received Wireshark network dump, I look for an HTTP packet with a GET request for the 10MBtest.bin file and determine the number of the TCP connection in which it was loaded. Or look for tcp contains "10MBtest.bin" filter .
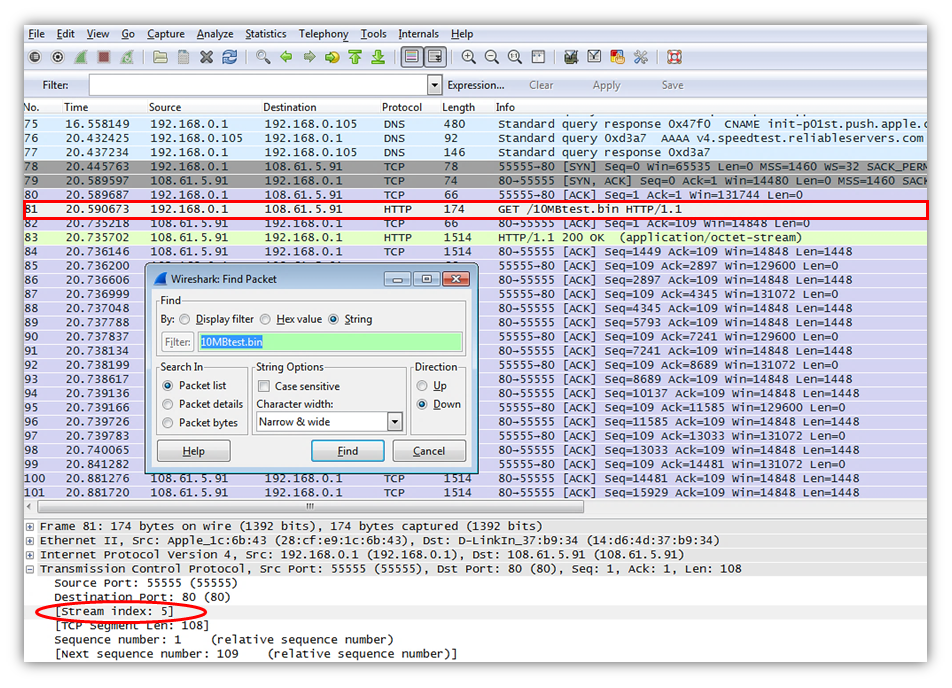
I filter all traffic by the TCP connection number in which the test file tcp.stream == 5 was loaded .

And now we are watching TCP StreamGraph.
It is important to know that all graphs from TCP StreamGraph are built on the same TCP connection and are directional.
The direction indicates in which direction the analyzed data stream moved from the client to the server or vice versa.
The direction and connection is determined by the package selected in the Wireshark interface.
In the case of the above example, I select any package from the connection in which the test file 10MBtest.bin was loaded.
The direction was from server to client, so the Source of the packet must match the IP address of the server.
All graphs are in the Wireshark menu Statistics -> TCP StreamGraph.
Time-Sequence Graph (Stevens)

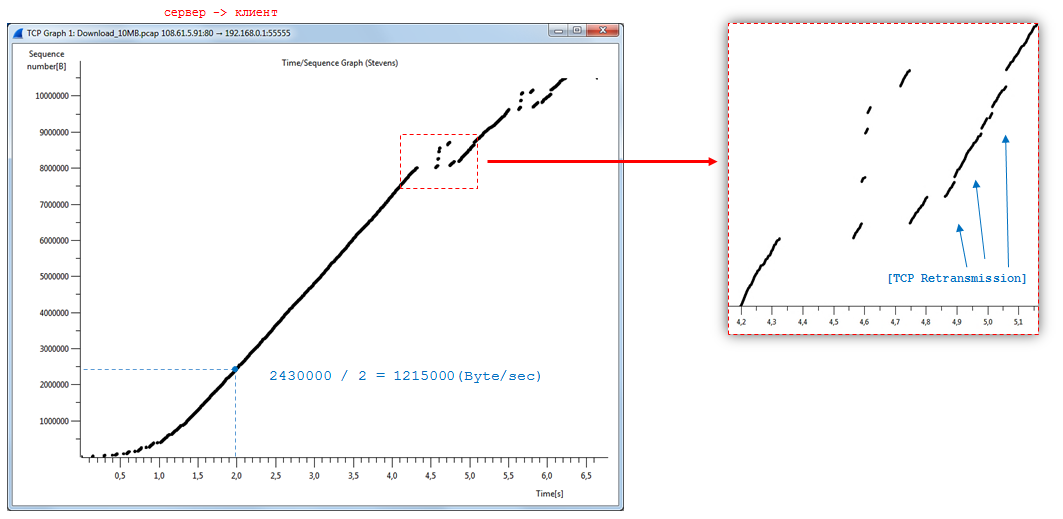
Time-Sequence Graph (Stevens) looks like an oblique curve made up of dots.
The coordinates of each point in the graph are the Sequence number of the TCP segment (Y axis - Bytes) and its capture time (X axis - seconds).
Accordingly, as mentioned earlier, only segments with data of one TCP connection moving in a certain direction, from server to client (download, download) or vice versa (upload, upload), are taken into account.
According to the Sequence number theory, this is the number of the first byte of segment data in the general data stream.
Therefore, we can say that the graph shows the dynamics of loading / unloading data bytes in a TCP connection over time.
On any site, the data transfer rate is easily calculated (Sequence number divided by Time, we get Byte / sec).
As a result, changes in the slope of the sections of the curve can be used to judge changes in the data transfer rate.
Under ideal conditions, the graph looks like a diagonal line with a large angle of inclination.
However, in practice this is not always the case.
By anomalies in the graph curve, it is possible to detect delays in data transmission, loss of segments and their retransmission (Retransmission).
In the example graph below, during file upload, there were two similar problems with stopping data transfer and losing segments.
Keyboard shortcuts in Windows (quick reference):
Step-by-step increase or decrease of the graph scale is carried out via the i / o keys or by direct selection of the area with the mouse. Return to the original scale, Home key.
Spacebar - turns the cursor into a crosshair with vertical and horizontal auxiliary lines.
Number keys 1 to 5 - select another chart from the set.
Ctrl + right mouse button - a window appears with an enlarged image of a plot of the graph from under the cursor.
A mouse click on any point on the graph leads to a transition in the Wireshark interface to the corresponding TCP packet.
Time-Sequence Graph (tcptrace)

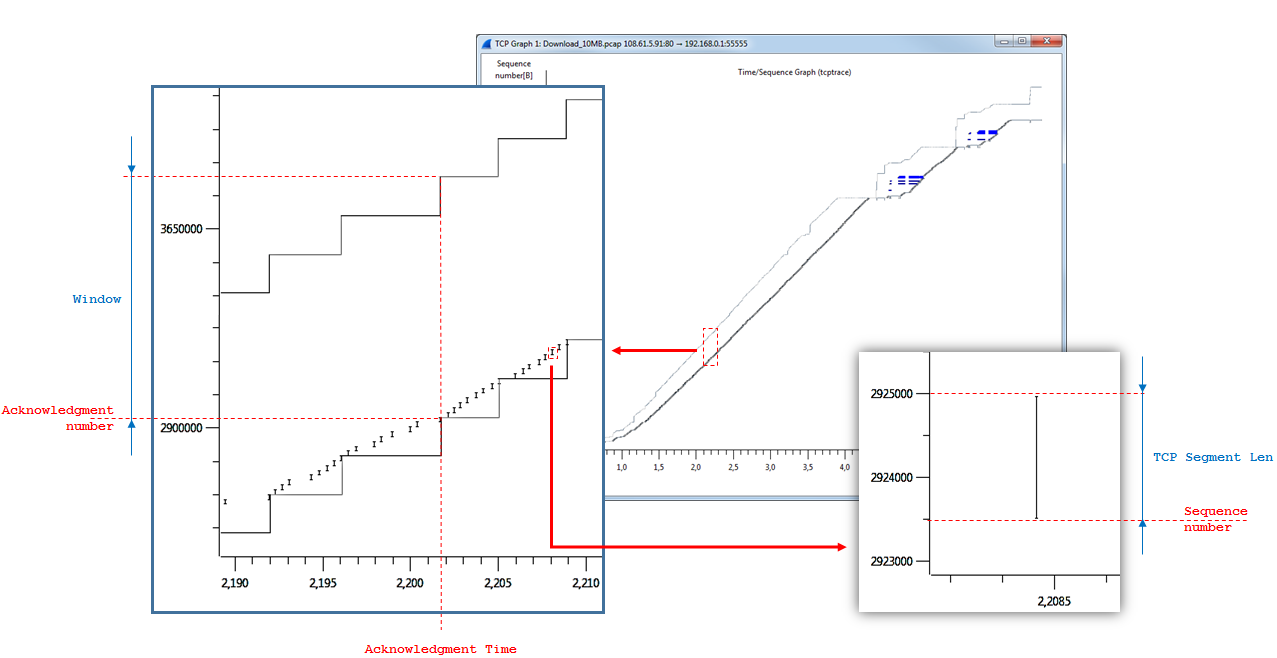
In appearance, the Time-Sequence Graph (tcptrace) resembles the previous graph and is intended for a more complete analysis of possible problems. It still displays the Sequence number of the data stream segments on the timeline.
However, another segment attribute was added - its size (TCP Segment Len).
Therefore, segments are no longer displayed as dots, but as vertical lines with serifs at the ends, like the English letter I - “ay.” The base of the segment is the Sequence number, and the length is the size of the segment in bytes.
The chart also displays information from the reverse flow of confirming segments, Window (Win), Acknowledgment number (Ack) and SACK. Ack values are displayed as a step curve below the data segments.
Each step, its top is a point in time of receipt of confirmation of the total number of continuously received bytes by the recipient.
Similarly, the size of the window of the receiving side of Win is displayed “stepwise”.
The curve runs above the data stream.
The top of the step is the sum of the Ack and Win values of the acknowledgment segment.
Blue vertical lines represent SACK blocks.
SACK may be present in the confirmation if gaps occurred in the continuous stream of received data.
The blue line is the range of bytes received after the break.
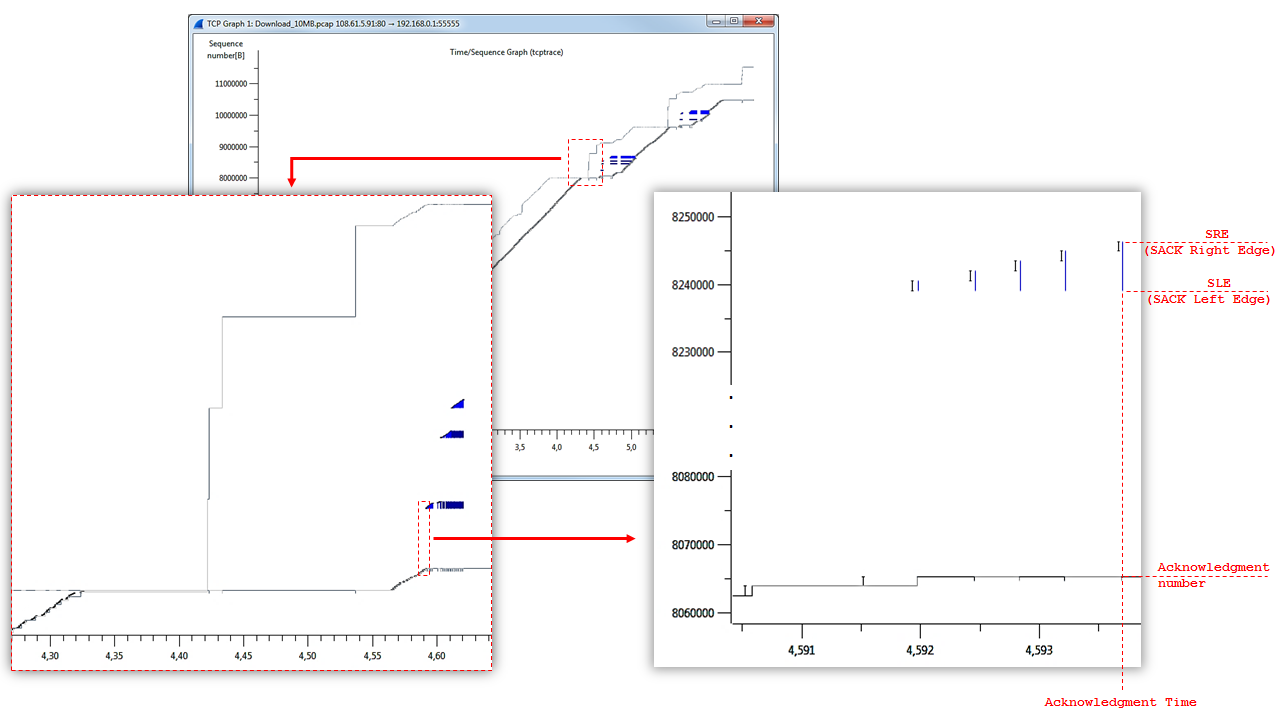
In general terms, the graph represents a “corridor” of two step curves, inside which segments with data move. The narrowing of the "corridor" indicates a decrease in the size of the reception window (Win), the extension indicates the opposite.
In the previous chart, two problems with stopping data transfer were detected.
Time-Sequence Graph (tcptrace) clarified the reasons for what happened.
The size of the window (Win) on the receiving side has decreased.
The sender transmitted the maximum allowed number of data segments so as not to overflow the window, and stopped.
After the recipient reported an increase in window size (Window Update), data transfer resumed.

Throughput graph
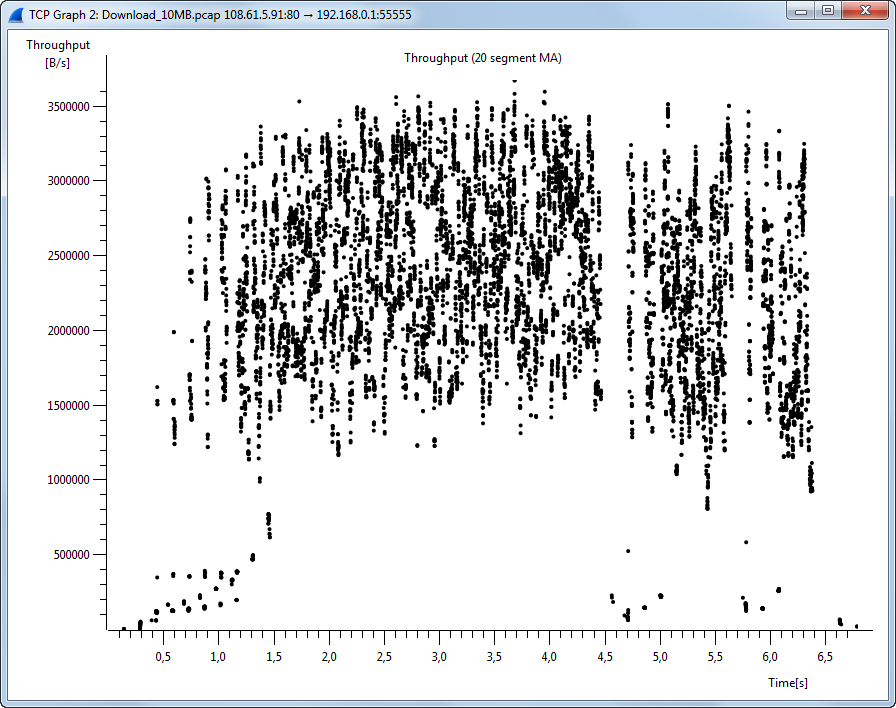
Throughput Graph looks like a lot of points, sometimes located very randomly.
The coordinates of each point are the estimated speed of the segment moving in the data stream (Y axis - Bytes / sec) and its capture time (X axis - seconds).
To be precise, to smooth out fluctuations on the graph, not real, but averaged velocity values are recorded.
The averaging function of the Moving Average (MA) is used by 20 values for the previous period.
According to Wireshark, the average speed of the Nth segment is the sum of the lengths of all segments from N to N-20, divided by the delta in time between their capture.
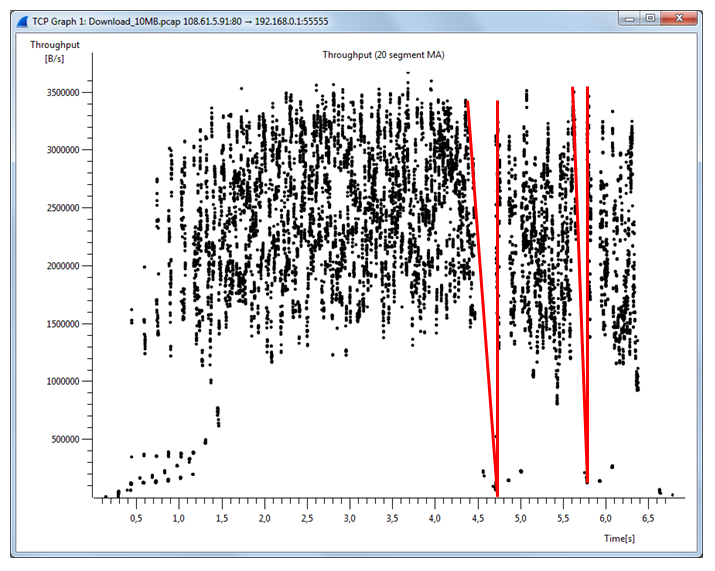
As a result, two delays in data transmission caused by a decrease in window size (Win) led to a drop in Throughput at problematic times. The rest of the time, the download speed varied within the range from 1.4 to 3.4 MB.
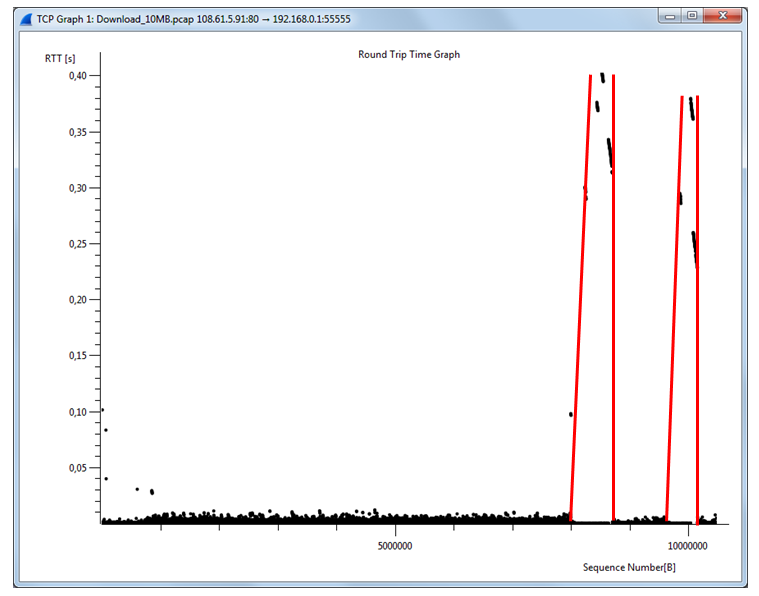
Round trip time graph
Round Trip Time (RTT) is the time elapsed between sending a data segment and receiving confirmation of its successful delivery.
The Round Trip Time Graph shows the RTT (Y-axis - seconds) for each segment from the data stream.
The segment identifier is its Sequence number (X axis - Bytes).
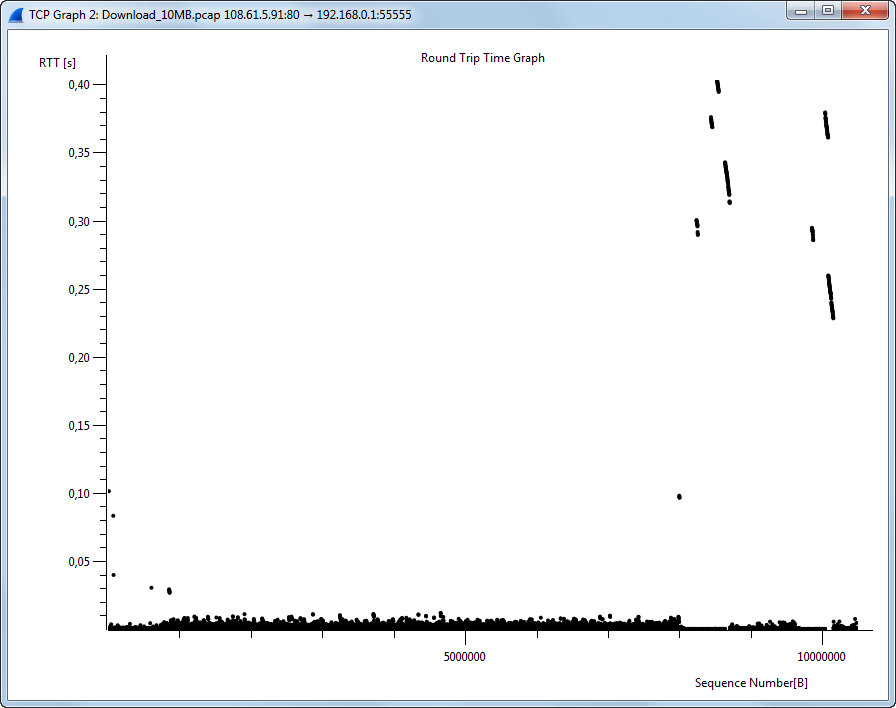
Under normal conditions, most of the points are concentrated at the bottom of the graph.
In the example, RTT almost all the time does not exceed 0.1 sec., With the exception of problematic moments when RTT jumped to 0.4 sec.
All graphs are linked by the formula Throughput = Window size / RTT
Window scaling graph

The coordinates of each point of the Window Scaling Graph is the size of the Windowsize window (Y axis - Bytes) of the segment at the time it was captured (X axis - seconds).
In the current graph, the orientation has been changed to the reverse data flow (client -> server). It only analyzes confirmatory segments.
The Window Scaling Graph provides information on two problematic cases of reducing the size of the window to critical sizes.
This is fully confirmed by the readings on the Time-Sequence Graph.

Conclusion
Well, that seems to be all. What I wanted - said.
There is much more information on the topic. The article outlined only the basics that help to better understand the graphs from TCP StreamGraph, Wireshark.
These graphs are very useful in their practical application and allow you to do a comprehensive review of any TCP connection, identify network problems.
Of course, there are other tools like TCP StreamGraph, for example, tcptrace , captcp .
Do not forget about the IO Graph of the same Wireshark. It has more extensive functionality that goes far beyond TCP StreamGraph.
I hope this article will be useful to everyone who is interested in networking or is learning the TCP protocol.