Monitoring for the poor or SAR + MySQL + Gnuplot
Why exactly SAR?
I’ve been monitoring for quite some time. Therefore, by the nature of my activity, I often encounter unusual situations when I have to come up with various “bicycles” in order to monitor the host. For example, we will consider the situation when we have a server (virtual machines or VDS), which is very limited in resources.
There are many good monitoring systems like Zabbix, Nagios, Cacti, etc. But for all of our situation, they are not suitable, for obvious reasons - they themselves consume resources, which we don’t have so many. The question immediately arises, what to do? And here SAR hurries to help us.
Install and configure SAR
SAR (System Activity Report) is a very powerful utility for collecting statistical information about system performance. Included in sysstat package. Therefore, if you do not yet have the sysstat package on the server, install it. For example, for Debian:
# apt-get install sysstat
Then we need to configure the SAR itself. We include sysstat, for this we correct the file:
# vim /etc/default/sysstat
And change the line ENABLED = "false" to ENABLED = "true". Then we need to fix the task in cron.
# vim /etc/cron.d/sysstat
I collect data every minute, so on my system it looks like this (you might have a slightly different one):
# Activity reports every 1 minutes everyday
* * * * * root command -v debian-sa1 > /dev/null && debian-sa1 1 1
# Additional run at 23:59 to rotate the statistics file
59 23 * * * root command -v debian-sa1 > /dev/null && debian-sa1 60 2
Restarting the sysstat service:
# service sysstat restart
This completes the setup.
Using SAR
I will not describe in detail how to use SAR. To do this, there are many articles on the Internet, and the SAR itself provides quite extensive documentation. All you need is a man sar, and there, I think, you’ll figure it out.
Learn SAR to upload reports in MySQL
Yes, yes, you read it right. Of course, we can use the SAR for its intended purpose, call it from the console and receive reports in this form:
$ sar -s 07:00:00 -e 07:10:00
Linux 3.2.0-4-amd64 (mind-x)    02.03.2015      _x86_64_        (1 CPU)
07:00:01        CPU     %user     %nice   %system   %iowait    %steal     %idle
07:01:01        all      0,64      0,00      0,15      0,10      0,00     99,11
07:02:01        all      0,03      0,00      0,02      0,00      0,00     99,95
07:03:01        all      0,03      0,00      0,02      0,00      0,00     99,95
07:04:01        all      0,03      0,00      0,02      0,02      0,00     99,93
07:05:01        all      0,05      0,00      0,03      0,00      0,00     99,92
07:06:01        all      0,63      0,00      0,17      0,10      0,00     99,11
07:07:01        all      0,03      0,00      0,02      0,00      0,00     99,95
07:08:01        all      0,02      0,00      0,02      0,00      0,00     99,97
07:09:01        all      0,03      0,00      0,02      0,00      0,00     99,95
Среднее:     all      0,17      0,00      0,05      0,02      0,00     99,76
But you must admit, I don’t feel like looking at these numbers after a long working day, my eyes hurt, etc. What to do? How to work with such important information?
I admit, I spent the whole evening thinking about this problem. All decisions seemed strange to me. Perhaps the solution I came up with is also strange, but why did I want to make friends with SAR MySQL? I will try to explain further.
If you carefully read the SAR tuning part, then you probably noticed that the SAR rotates its logs after midnight. This is done specifically to break magazines by day. I wanted to receive data continuously (because we will build graphs on them later) so that I can only select the column I need, for a certain time, etc. And then I thought, why not upload all these reports to the database? Since the server already had MySQL, the choice became obvious.
So, friends of SAR and MySQL
I searched the whole Internet about this, but there is practically no information, just a couple of articles, the result of reading which was a script. But before we disassemble it, let's prepare the base.
Create the sysstat database:
CREATE DATABASE `sysstat`;
We create the user sysstat (you can give this user any other rights).
CREATE USER 'sysstat'@'localhost' IDENTIFIED BY 'some_pass';
GRANT ALL PRIVILEGES ON sysstat.* TO 'sysstat'@'localhost';
We create tables, it looks something like this for me:
CREATE TABLE `host_health_cpu` (
  `datetime` datetime NOT NULL DEFAULT '0000-00-00 00:00:00',
  `pct_user` decimal(10,2) DEFAULT NULL,
  `pct_nice` decimal(10,2) DEFAULT NULL,
  `pct_system` decimal(10,2) DEFAULT NULL,
  `pct_iowait` decimal(10,2) DEFAULT NULL,
  `pct_steal` decimal(10,2) DEFAULT NULL,
  `pct_idle` decimal(10,2) DEFAULT NULL
) ENGINE=InnoDB DEFAULT CHARSET=utf8;
CREATE TABLE `host_health_memory` (
  `datetime` datetime NOT NULL DEFAULT '0000-00-00 00:00:00',
  `kbmemfree` int(11) DEFAULT NULL,
  `kbmemused` int(11) DEFAULT NULL,
  `per_memused` decimal(10,2) DEFAULT NULL,
  `kbbuffers` int(11) DEFAULT NULL,
  `kbcached` int(11) DEFAULT NULL,
  `kbcommit` int(11) DEFAULT NULL,
  `per_commit` decimal(10,2) DEFAULT NULL,
  `kbactive` int(11) DEFAULT NULL,
  `kbinact` int(11) DEFAULT NULL
) ENGINE=InnoDB DEFAULT CHARSET=utf8;
CREATE TABLE `host_health_la` (
  `datetime` datetime NOT NULL DEFAULT '0000-00-00 00:00:00',
  `runq_sz` int(11) DEFAULT NULL,
  `plist_sz` int(11) DEFAULT NULL,
  `ldavg_1` decimal(10,2) DEFAULT NULL,
  `ldavg_5` decimal(10,2) DEFAULT NULL,
  `ldavg_15` decimal(10,2) DEFAULT NULL
) ENGINE=InnoDB DEFAULT CHARSET=utf8;
CREATE TABLE `host_health_net` (
  `datetime` datetime NOT NULL DEFAULT '0000-00-00 00:00:00',
  `iface` varchar(7) DEFAULT NULL,
  `rxpck_persec` decimal(10,2) DEFAULT NULL,
  `txpck_persec` decimal(10,2) DEFAULT NULL,
  `rxbyt_persec` decimal(10,2) DEFAULT NULL,
  `txbyt_persec` decimal(10,2) DEFAULT NULL,
  `rxcmp_persec` decimal(10,2) DEFAULT NULL,
  `txcmp_persec` decimal(10,2) DEFAULT NULL,
  `rxcst_persec` decimal(10,2) DEFAULT NULL
) ENGINE=InnoDB DEFAULT CHARSET=utf8;
Everything, now everything is ready, in order to upload reports to MySQL.
Parse the script
In the script, we will use the sadf utility , which can display data collected by SAR in various formats, for example, in CSV, JSON, XML. We will need a CSV. The script itself is not very large and not difficult to understand, I will only add that I remove the first 2 columns from the sadf output, they contain information about the host and the interval between data readings. There is only one host in our case, and I already know the interval, so I do not need this information.
#!/bin/bash
#Инициализируем переменные
WORKDIR=/var/cache/sar
FMATDIR=/var/cache/sar_data
SADF=`which sadf`
HEAD=`which head`
AWK=`which awk`
#Копируем последний журнал в рабочую директорию
cd ${WORKDIR}
COPY=`which cp`
SAR_LOG=/var/log/sysstat
cd ${SAR_LOG}
LATEST_DATA=`ls -tlr ${SAR_LOG} | tail -1 | awk '{print $9}'`
${COPY} ${LATEST_DATA} ${WORKDIR}
for file in *;
do
#Выбираем репорты за последние 6 минут. Для этого создаем переменную $TIME
UNIXTIME=$((`date +%s`-300))
TIME=`date -d@${UNIXTIME} +%H:%M:%S`
#Статистика по CPU
${SADF} -d ${file} -s ${TIME} -t | cut -d ';' -f3,5- > "${FMATDIR}"/"${file}"-host_health_cpu.csv
#Сетевая статистика
${SADF} -d ${file} -s ${TIME} -t -- -n DEV | cut -d ';' -f3- > "${FMATDIR}"/"${file}"-host_health_net.csv
#Размеры очередей и LA
${SADF} -d ${file} -s ${TIME} -t -- -q | cut -d ';' -f3- > "${FMATDIR}"/"${file}"-host_health_la.csv
#Статистика по использованию памяти
${SADF} -d ${file} -s ${TIME} -t -- -r | cut -d ';' -f3- > "${FMATDIR}"/"${file}"-host_health_memory.csv
done
#Заливаем данные в MySQL
cd ${FMATDIR}
MYSQL=`which mysql`
USER='user'
PASS='some_pass'
HOST='localhost'
DB='sysstat'
for file in *.csv;
do
${MYSQL} -u${USER} -p${PASS} -h${HOST} -D${DB} -e "LOAD DATA LOCAL INFILE '${FMATDIR}/${file}' INTO TABLE `echo ${file} | sed 's/.csv//g' | awk -F'-' '{print $2}'` FIELDS TERMINATED BY ';' IGNORE 1 LINES;"
done
#Удаляем временные файлы
rm -fr ${FMATDIR}/*.csv
rm -fr ${WORKDIR}/sa*
In general, such a script. In order for the filling to begin, add it to cron. We will call once every 5 minutes.
*/5 * * * * bash /usr/local/sbin/sar.sh
An interesting feature of SAR is that when we call it as sar -s, indicating the start time, this time itself is not included in the report, so when we call the sar script in the last 6 minutes, we get the report in 5 minutes in the output. This must be taken into account. Otherwise there will be "holes" or duplicates in MySQL.
As a result, you will get something like the following:
mysql> SELECT * FROM host_health_memory WHERE datetime > NOW() - INTERVAL 10 MINUTE;
+---------------------+-----------+-----------+-------------+-----------+----------+----------+------------+----------+---------+
| datetime            | kbmemfree | kbmemused | per_memused | kbbuffers | kbcached | kbcommit | per_commit | kbactive | kbinact |
+---------------------+-----------+-----------+-------------+-----------+----------+----------+------------+----------+---------+
| 2015-03-02 08:36:01 |   1381896 |    679396 |       32.00 |    104044 |   155520 |   803420 |      38.00 |   484244 |  142688 |
| 2015-03-02 08:37:01 |   1377476 |    683816 |       33.00 |    104068 |   155668 |   810284 |      39.00 |   487632 |  142808 |
| 2015-03-02 08:38:01 |   1377476 |    683816 |       33.00 |    104096 |   155672 |   810284 |      39.00 |   487668 |  142804 |
| 2015-03-02 08:39:01 |   1377476 |    683816 |       33.00 |    104120 |   155680 |   810524 |      39.00 |   487832 |  142804 |
| 2015-03-02 08:40:01 |   1372416 |    688876 |       33.00 |    104160 |   155684 |   819104 |      39.00 |   490708 |  142816 |
| 2015-03-02 08:41:01 |   1377104 |    684188 |       33.00 |    104276 |   155700 |   810524 |      39.00 |   488008 |  142808 |
| 2015-03-02 08:42:01 |   1379228 |    682064 |       33.00 |    104288 |   155708 |   816640 |      39.00 |   486392 |  142632 |
| 2015-03-02 08:43:01 |   1378980 |    682312 |       33.00 |    104328 |   155708 |   816744 |      39.00 |   486680 |  142628 |
| 2015-03-02 08:44:01 |   1378608 |    682684 |       33.00 |    104356 |   155716 |   816932 |      39.00 |   486936 |  142636 |
| 2015-03-02 08:45:01 |   1371564 |    689728 |       33.00 |    104392 |   155720 |   827704 |      40.00 |   491912 |  142648 |
+---------------------+-----------+-----------+-------------+-----------+----------+----------+------------+----------+---------+
What to do with this data?
You can do anything with them. I wrote a little higher that based on this data we will draw graphs. This can be done in any way possible. It all depends on your imagination.
Gnuplot
My choice fell on Gnuplot . This is a pretty convenient tool for building graphs, charts, etc. There is a lot of documentation on Gnuplot on his home site , so we will skip the part about its features and how to use it.
I wrote this script:
#!/bin/bash
sleep 10
# Параметры по умолчанию
width="640"
high="480"
outfile="graph.svg"
format="svg"
NO_ARGS=0
E_OPTERROR=65
if [ $# -eq "$NO_ARGS" ] # Сценарий вызван без аргументов?
then
echo "Скрипт запущен без параметров!
Для правильной работы используйте параметры:
-o Указывает имя файла графика (по умолчанию \"graph.svg\")
-f Указывает формат файла графика (по умолчанию \"svg\")
-w Ширина файла (по умолчанию \"640\")
-h Высота файла (по умолчанию \"480\")
-t Тип графика
Повторите вашу попытку."
exit $E_OPTERROR
fi
#Выбираем необходимые параметры
while getopts ":h:w:t:f:o:" Option
do
case $Option in
h) high="$OPTARG";;
w) width="$OPTARG";;
f) format="$OPTARG";;
o) outfile="$OPTARG";;
t) type="$OPTARG";;
esac
done
shift $(($OPTIND - 1))
#Записываем результат во временный файл /tmp/datatmp
if [ ${type} == 'cpu' ]
then
#Создаем заголовок графика
title="Распределение нагрузки на CPU, %"
QUERY="select time(datetime), pct_idle as idle, pct_iowait as iowait, pct_system as system, pct_user as user from host_health_cpu where now() - interval 1 hour < datetime;"
format_y='set format y "%.0f%%";'
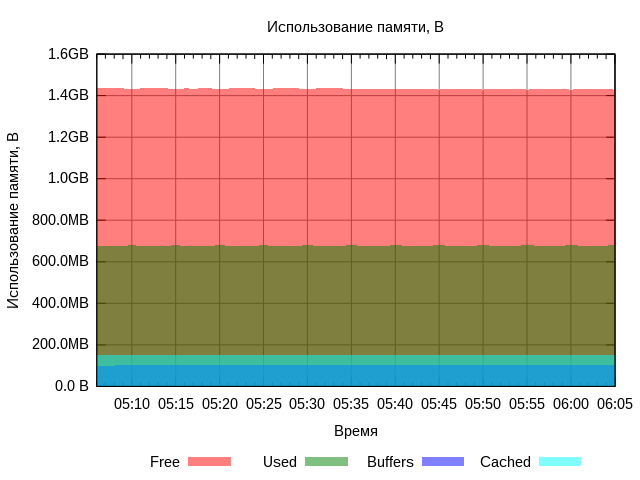
elif [ ${type} == 'mem' ]
then
title="Использование памяти, B"
QUERY="select time(datetime),(kbmemfree * 1024) as Free,(kbmemused * 1024) as Used,(kbbuffers * 1024) as Buffers,(kbcached * 1024) as Cached from host_health_memory where now() - interval 1 hour < datetime;"
format_y="set format y '%.1s%cB'"
elif [ ${type} == "net" ]
then
title="Входящий и исходящий трафик, B/s"
QUERY='select time(datetime), (rxbyt_persec * 1024) as Rx, (txbyt_persec * 1024) as Tx from host_health_net where now() - interval 1 hour < datetime and iface="eth0";'
format_y="set format y '%.1s%cB/s'"
elif [ ${type} == "la" ]
then
title="Load Average"
QUERY="select time(datetime),ldavg_1 as LoadAvg1, ldavg_5 LoadAvg5,ldavg_15 as LoadAvg15 from host_health_la where now() - interval 1 hour < datetime;"
format_y="set format y '%.2f'"
fi
#Делаем выборку из базы и сохраняем во временный файл
MYSQL=`which mysql`
USER="user"
PASS="some_pass"
DB="sysstat"
${MYSQL} -u${USER} -p${PASS} -D${DB} -B -r -e "${QUERY}" >> /tmp/datatmp_${type}
#Подсчитываем количество столбцов в файле.
cols=`awk '{print NF}' /tmp/datatmp_${type} | sort -nu | tail -n 1`
#Определяем временные промежутки
hour_ago=`${MYSQL} -u${USER} -p${PASS} -D${DB} -N -e "select time(datetime) from host_health_cpu where now() - interval 1 hour < datetime limit 1;"`
now=`${MYSQL} -u${USER} -p${PASS} -D${DB} -N -e "select time(datetime) from host_health_cpu where now() - interval 1 hour < datetime order by datetime desc limit 1;"`
#Рисуем график
gnuplot << EOP
#Указываем формат файла и его размер
set terminal ${format} size ${width},${high}
#Указываем выходной файл
set output ${outfile}
#Рисуем легенды
set key autotitle columnhead
set key outside center bottom
set key horizontal
#Рисуем заголовок
set style fill transparent solid 0.5 noborder
set title "${title}"
#Делаем ось Х в формате отображения дат
set xdata time
set timefmt "%H:%M:%S"
set xrange ["${hour_ago}":"${now}"]
set xtics format "%H:%M"
#Указываем имена осей
set xlabel "Время"
set ylabel "${title}"
set grid
set yrange [0:*]
${format_y}
#Получаем конечный результат.
plot for [i=2:${cols}] "/tmp/datatmp_${type}" using 1:i smooth unique with filledcurve x1
EOP
#Удаляем временный файл.
rm /tmp/datatmp_${type}
echo "Image write to \"${outfile}\""
exit 0;
Run it like this:
$ sar-plot.sh -t mem -o /path/to/memory.svg
The result is such a schedule in 1 hour.
If you add this script to cron and call it, for example, once every 5 minutes, then we will always have fresh graphs. For example, I did it like this:
*/5 * * * *     bash /usr/local/sbin/sar-plot.sh -t cpu -o /path/to/images/cpu.svg
*/5 * * * *     bash /usr/local/sbin/sar-plot.sh -t mem -o /path/to/images/memory.svg
*/5 * * * *     bash /usr/local/sbin/sar-plot.sh -t net -o /path/to/images/network.svg
*/5 * * * *     bash /usr/local/sbin/sar-plot.sh -t la -o /path/to/images/la.svg
Further, these images can be added to the HTML page, to make it automatically updated. Thus, we can monitor host performance in almost real time (with a delay of 5 minutes). What is enough for us in principle.
Conclusion
SAR is a very convenient tool, indispensable in the work of the system administrator. The monitoring method described by me is well suited for those who are very limited in resources, do not want to raise Zabbix on the server or for various other reasons.
You can develop this solution for yourself:
- Add other metrics that are not described in the article, for example, you can add statistics on the activity of the disk subsystem.
- You can draw graphics in any other way, for example, using Javascript libraries.
- You can modify the system so that when any critical values are reached, alerts are displayed on your web page, and, for example, messages are sent to your mail.
It all depends on your desire. Good luck