IT company management: breaking the theory from practice
Practice is when everything works, but no one understands how. Theory is when nothing works, but everyone knows exactly why. But we came to a combination of theory and practice: nothing works - and no one understands why.
In the functioning of any growing business - not only in IT, but also in other areas - there comes a time when it is impossible to ignore problems abandoned into the far corner and having already managed to cover themselves with a noble patina. Their consequences are felt in the most unexpected situations. There are more than a dozen methods to deal with problems and make the business work, but you always have to start with the same thing: an analysis of the root causes of these same problems. And today Robots would like to talk about it - not only translating the articlehow to find the root causes of IT business coach and Agile, Scrum and Kanban specialist Henrik Kniberg - but also about how Robots fixed several of their own failures.

Henrik Kniberg. The purpose of this article is
cause-effect diagrams - a simple and convenient way to perform root cause analysis. I have been using these charts for many years, helping businesses recognize and solve a wide range of problems - both technical and organizational. The purpose of the article is to show how cause-effect diagrams work and teach the reader how to build them for their own needs.
Troubleshoot problems, not symptoms
The key to effective problem solving is to first make sure that you understand the problem you are trying to solve. Why does it require a solution, how to determine when it will be solved, and what is the root cause of this problem.
Often, “symptoms” appear in one place, although the true cause of the problem is in a completely different place. If you simply deal with the symptoms, without trying to assess the situation more deeply, it is likely that the problem will come back to light later, but in a different form.
Problem: Smoke in the bedroom.
Bad decision: Open the window and go to bed again.
Good decision:Find the source of smoke and deal with it. Oops! And there’s a fire in the basement! Further actions - put out the fire; to understand why it even appeared; set a fire alarm so that the next time you learn about the problem earlier.
Problem: Hot forehead, fatigue.
Bad decision: Put ice on your forehead to cool it. Eat sugar for energy. Continue work.
Good solution: Measure the temperature. Yes, I have a fever! Further action is to go home to rest.
Problem: Memory leak on the server.
Bad decision: Buy memory.
Good solution: Find and fix the source of a memory leak. Test to avoid future leaks.
... and so on.
Most of the problems in organizations are systemic. The system (business) fails, and the failure must be fixed. Until the root cause of this failure is clear, most attempts to deal with the problem will be ineffective or even counterproductive.
Thinking in A3 format and a lean approach to solving problems.
One of the fundamental principles of lean thinking is Kaizen - continuous process improvement. One of the most successful companies in the world, Toyota, associates a significant share of success with its high discipline in its approach to solving problems. Sometimes this approach is called “thinking in A3 format” (the knowledge gained during each “session” on problem solving is recorded on sheets A3).
Here is an example and template:
www.crisp.se/gratis-material-och-guider/a3-template
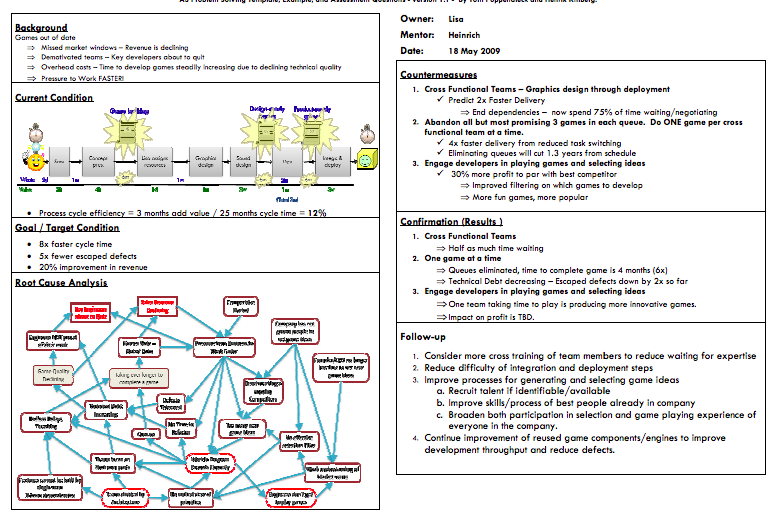
With the “A3 approach”, a significant part of the time (the left side of the sheet) is devoted to the analysis and visualization of the analysis of the root cause of the problem and precedes the development of any solutions . Cause and effect diagrams are not the only root cause analysis method. There are others: for example, the systematization of the value stream mapping and the construction of the Ishikawa diagram, or, as it is also called, the diagram of a fish bone. Sample A3 above contains a value stream map (top left) and a causal chart (bottom left).
Cause-effect diagrams are good for their intuitiveness and lack of need for additional explanations (especially in comparison with fish-bone diagrams). Another advantage is the ability to illustrate repeated vicious cycles , which is extremely useful from the point of view of systemic thinking. Next, we will talk about how to effectively create and use such diagrams.
How to use cause and effect diagrams
The basic process is as follows:
The next step is follow up. If countermeasures work, congratulations! If not, do not despair. Analyze why they did not work, update the chart adjusted for your knowledge, and try other countermeasures.
In fact, countermeasures are not a solution, but an experiment . Your hypothesis is that countermeasures will solve (or minimize) the problem, but you can never be completely sure. In fact, you “poke a sharp stick” into your system, checking how it reacts. Therefore, follow up is important.
A mistake, in fact, means that your system sends you signals that are worth listening to. The only real mistake is the inability to learn from mistakes!
Example 1: lack of pair programming
One client asked to help him find out why his business does not use XP techniques such as pair programming and development through testing (TDD). “We know we must do this, but we don’t,” said the client.

Is the lack of TDD and pair programming real problem? As usual, often the things that we call problems are not, they are simply symptoms.
Q: What are the consequences of ignoring pair programming and TDD?
A: We believe that using these practices would improve the quality of the code.
Q: What are the consequences of poor code quality? Have you encountered real problems caused by poor quality code?
A: Yes, we had a demo flying out. Demo is a key element of our business, so this is a real problem.
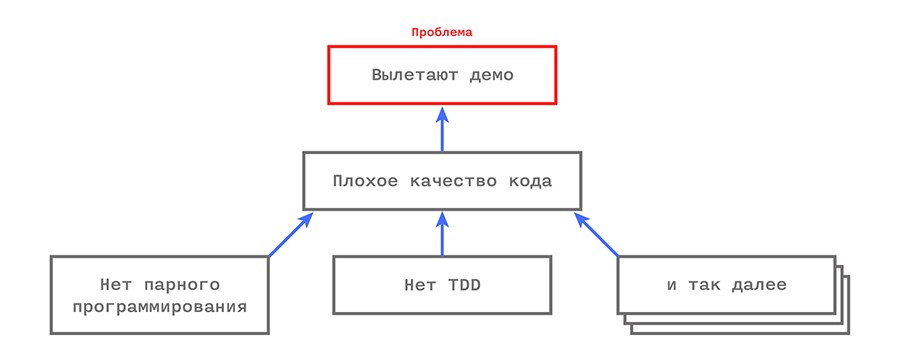
OK, consider one of the elements and check if we can build a connection to the very “foundation”.
Q: Why do not you practice pair programming?
A: Because many are afraid that it will not work and we will waste time. We have no evidence that it works.
Q: What evidence do you need?
A: Well, we have seen studies that show that it is effective. But in our company no one actually tried to implement such practices, so we are not sure of success.
Here is the first loop:

They do not want to introduce new practices because they are not sure whether they will work. And they don’t know if they work, because they have not tried to implement them ...
Q: Why did you at least not make an attempt to use pair programming as an experiment?
A: We do not have time for experiments.
Q: Why?
A: Because we do not have a temporary reserve. Every hour is accountable. And customers continue to flood us with work.
Q: Why do customers not give you the opportunity to independently manage their time and consider it possible to pile on you with work at any convenient time?
A: They do not trust us to independently allocate time.
Lack of trust also leads to fear of failure in general, which, of course, reduces the likelihood of experimental use of new techniques such as pair programming without guarantees that they will work.
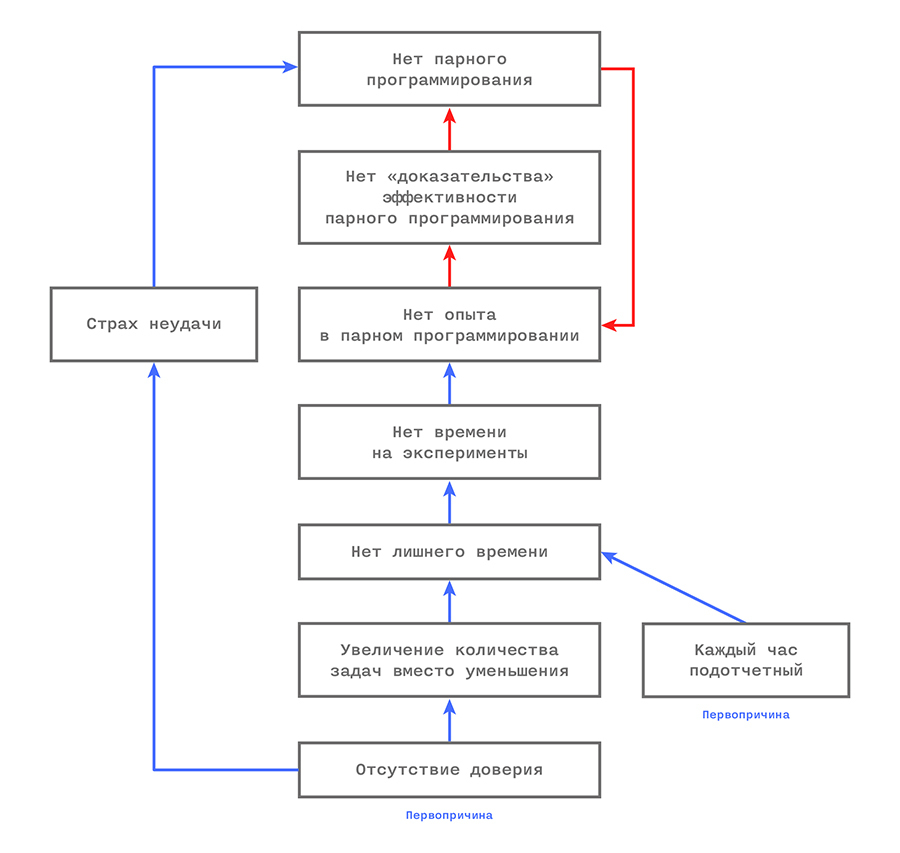
It turns out that there are two global root causes: a lack of trust and a managerial attitude toward accounting for every hour. Now back to the big picture.
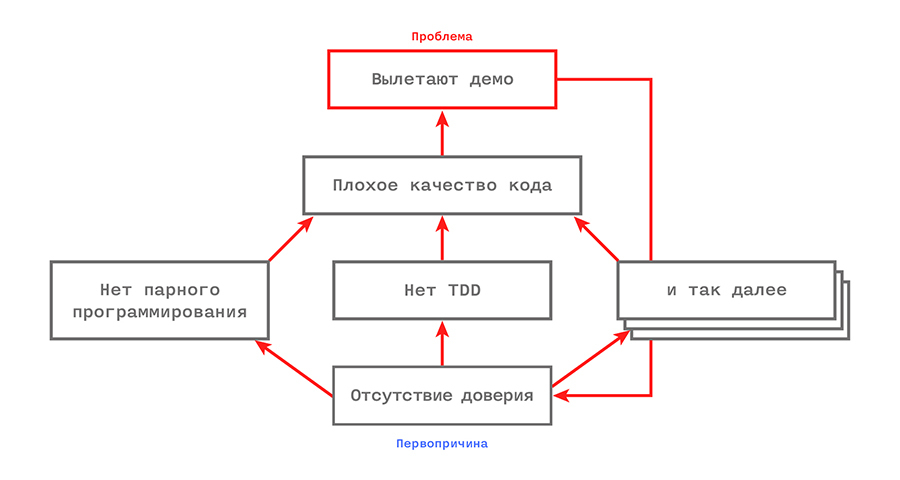
The lack of trust between the client and the customer was the primary reason that XP practices, such as TDD and pair programming, were not implemented. This entails poor quality, because of which demos fly out. And you will never guess: the flying demos will reduce mutual trust even more. This is a vicious circle!
Interestingly, we performed this analysis during a two-day workshop with approximately 25 people. At first, we talked mainly about technical things - how to get started with TDD and pair programming. This approach was not particularly effective, instead we divided into groups and decided that each group chooses its own problem and begins to build a causal diagram and formulate a solution to the problem on sheets A3. Interestingly, several groups that analyzed different problems at first glance came to the same root cause: lack of trust. The chart above is just one example that illustrates this.
Thus, by the end of the master class, the conversation was already about how to increase the degree of trust between the client and the developer. It was an unexpected turn of the workshop. To begin with, we agreed that the next time we would invite “them” (clients) to the workshop, which should reduce the frequency of the opposition “we” and “they”.
Example 2: a long release cycle.
Suppose we have a problem: we always break deadlines. More precisely, our releases always come out later than planned.

A problem is a problem only if it prevents you from achieving your goal. Therefore, first of all, it is worth determining the goal and thinking about the consequences of the problem directly in the context of your goal. This will help the question “So what?”, Which must be asked until it is possible to identify the obvious damage.
Assume that the goal is to make customers happy and get maximum revenue. A dialogue might look something like this:
Q: “What is the negative effect of postponing releases? What could be the consequences? ”
A:“ Delays make our release cycles long ”
Q:“ So what? ”
A:“ This delays the receipt of revenue and negatively affects the speed of money in the company. We also lose customers because of this, because they are impatient. ”
In the process of dialogue, we add cells and causal arrows to the diagram. Usually I try to move “upstream” from the originally stated problem, “mapping” its consequences. But this is not a strict rule.
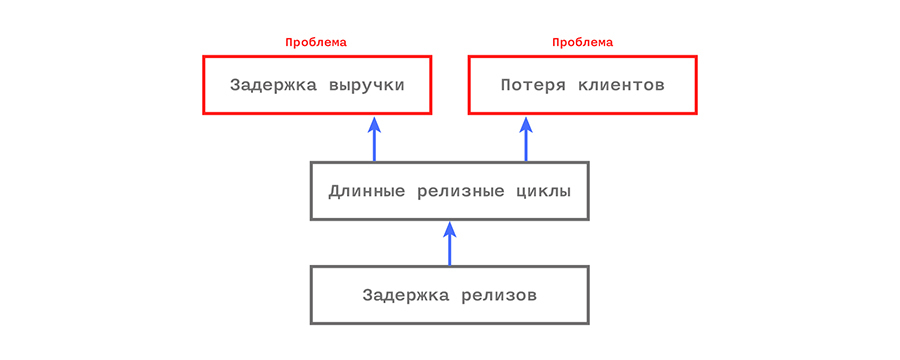
That is, it turns out that delaying releases is actually not a problem. Trueproblems are delayed revenue and loss of customers. At this stage, you need to consider three points:
Are there other factors leading to loss of customers and delayed revenue? If so, is it possible to assume that the blame for the release is to blame or should we turn our attention to something else? Can the problem be quantified? How much money have we lost? How many customers did it take? These data will help us evaluate the amount of effort that justifies itself in solving the indicated problem.
How do we understand that we have solved the problem? Suppose a happy consultant bursts into the office and proudly declares: “I solved the problem!” How to determine that this is not a bluff?
After analyzing the consequences of the problem, it’s time to dig deep into the root cause.
And then the questions “Why” come to the rescue. Yes, there is a “five why” technique that you could hear about if you were studying lean thinking.
Q: “Why are releases delayed?”
A: “Because the volume of work is growing.”
Q: “Why?”
A: “Because customers are inventing more and more features and insist that they should be added to the current release, refusing exclude low priority features from it. ”
Q:“ Why? Why not postpone adding new features to new releases? ”
A:“ Because the release cycle is so long that new requirements arise before the next release ”
There are so far only three“ Why. ” But you understood the principle. The dialogue allows you to form the following picture:
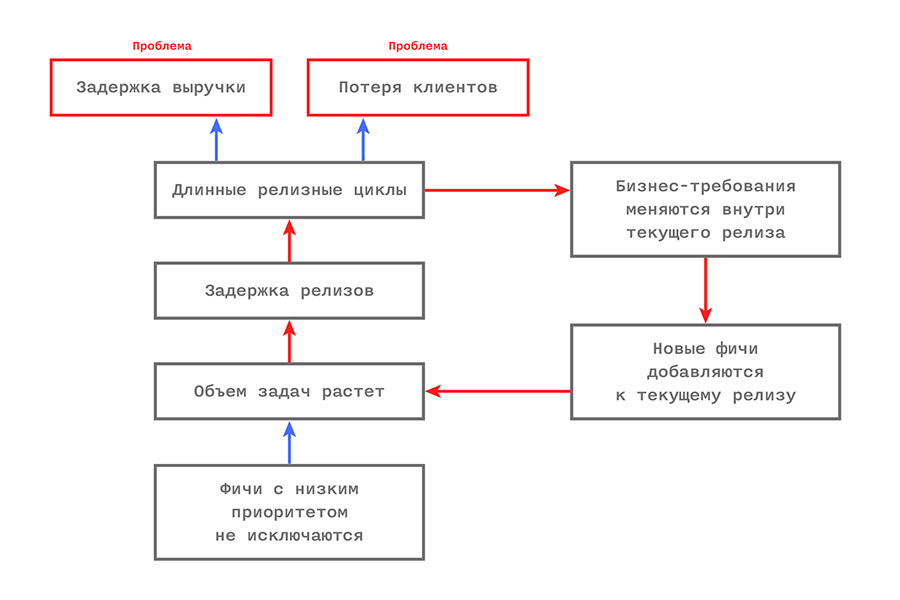
The vicious cycle is marked by red arrows. Repetitive problems almost always include such “loops”, but it takes some time to identify them. If you find such a loop, then the chances of a successful and irrevocable solution to the problems increase significantly!
Our goal is to identify the root cause of this problem so that we can achieve maximum effect with minimal effort. At the first stage, you can easily overlook important reasons, so let's go back and ask a few more questions.
Q: “Why is the release cycle long? Is
delayed releases the only reason? ” A:“ Well, actually, even without delays, our planned release cycles are long enough. ”
Q:“ How long is your planned release cycle? ”
A:“ Once a quarter. ”
Q. “But why is it so long?”
A: “Because releases are an expensive and complicated thing.”
Q: “Why?”
A: “Because every release has a lot of details and also because it is manual labor.”
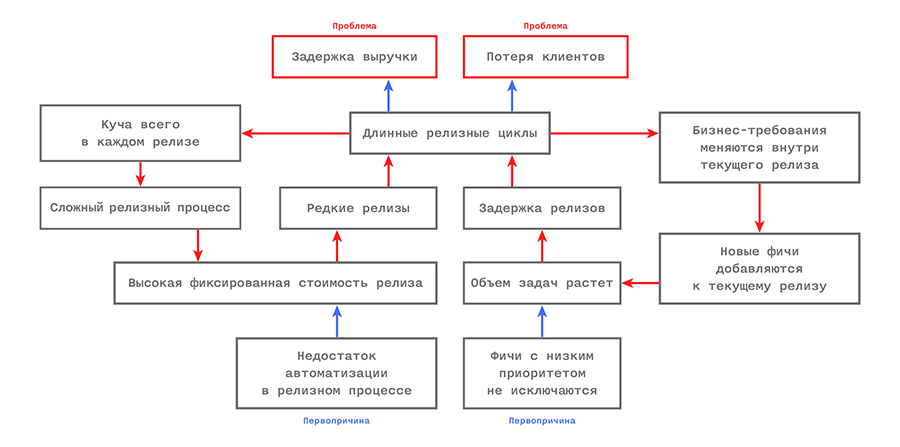
On the left side, we see another vicious cycle (red arrows)! The long release interval means that each new version includes a large number of updates, which makes the release of the product a complex and expensive process. Because of this, we do not want to make releases often.
As you noticed, here I decided to note two root causes. And now - countermeasures: The
root cause
Lack of automation in the process of preparing releases
Countermeasure
Automate the process of preparing releases
Root cause
Low-priority features are not excluded from
Countermeasure releases.
Agree with the client that new features can be added to the release only if the same number of low-priority features
are excluded from it. There is no strict rule saying what reason is the root cause, but there are some signs:
The technique of “five why” is called so because usually about five questions separate us from the root cause. There is a tendency to stop prematurely. You don’t have to do this: keep digging!
It is worth taking into account that the initially posed problem - delayed releases - in fact, was not a problem and not the root cause. It was just a symptom. We used it as an excuse in order to build a causal relationship in ascending order to identify the true problem, and then in descending order to determine the root cause. This allows you to develop effective countermeasures with all knowledge of the matter.
Without an analysis of this type, there is a risk of reaching hasty conclusions and making ineffective and counterproductive changes. For example, by hiring additional employees, although the essence of the problem does not lie in the amount of labor. Or by changing the incentive system (by encouraging people to do the work on time, and punishing late work), although the existing incentive system had nothing to do with the problem.
Example 3: defects in the production cycle
Imagine that we have problems with the defective code that runs in production.

Q: And what?
A: Defects make our customers angry

Q: Why are defects triggered in production?
A: Because they did not pass the necessary testing before release.
Q: Why was there no testing?
Etc.
And this is what we get:
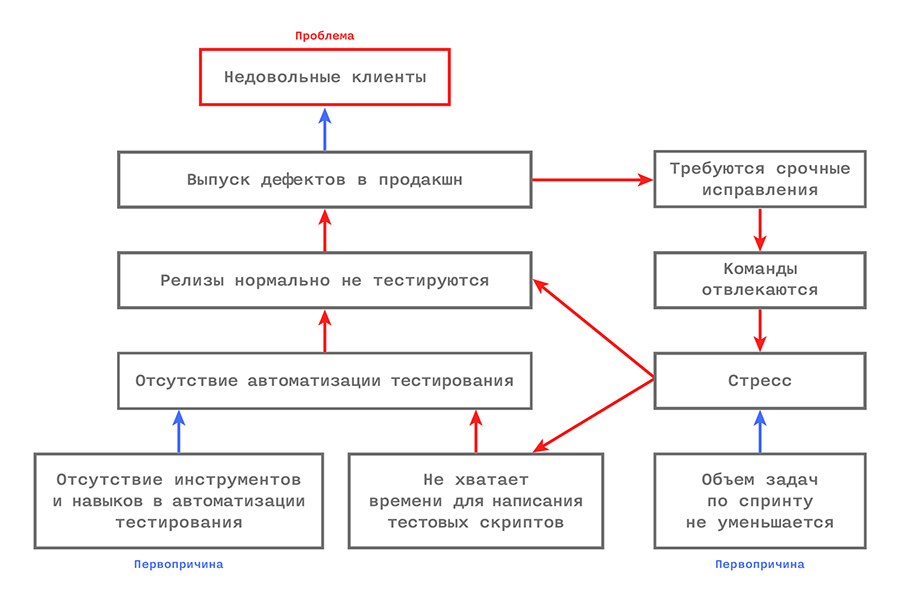
Two vicious cycles! Look at the red arrows.
Loop 1 (inner loop): Defects in the product force you to make urgent changes, which distracts the team from working. Since employees are not relieved of the bulk of the tasks, they are stressed and do not have time to properly test new releases. Which, of course, leads to an even greater number of defects at the level of the entire production.
Loop 2 (outer loop):Since employees are under stress, they also do not have time to write automatic test scripts. The consequence is a general lack of automation in testing, which complicates the regression testing of new releases more and more. This, of course, leads to production defects and the need to make urgent changes. And as a result - to even more stress.
But that's not all!
Teams hate being distracted. The process of work disrupts and ultimately kills motivation. This may be the explanation for the high staff turnover! Thus, solving the root problem (defects in production), we get an additional bonus in the form of reducing staff turnover.
This is another benefit of cause and effect analysis. Typically, the root cause is the cause of more than one problem (which is why it is called “root” —main or root).
Causal analysis: Robot experience
Boris Ryabchikov, project manager:
Example 4: A whole bunch of problems.
And here is a larger example. The organization used the Scrum methodology, but ran into some problems. As a result of several interviews and workshops, a causal diagram was born that showed that the team actually used Scrum incorrectly, which caused problems.

It became obvious to everyone that many of the root causes could be eliminated by the correct use of Scrum (for example, reorganization into cross-functional teams, the belief that each team has a product owner). This served as an impetus for organizational changes, which eventually eliminated many of the root causes (green stars). The next step was to improve test automation.
Of course, Scrum is not a panacea. In fact, sometimes Scrum itself is a problem and then other techniques, such as Kanban , are required to solve .
Practical questions - how to create and maintain diagrams
Work alone
When I make diagrams alone, the most convenient tools seem to me to be Visio or Powerpoint. They allow you to quickly move items, resize cells and quickly back up while working on the image.
Work in small groups (2 - 8 people)
Gather around a board or flipchart. Instead of cells, use stickers, connecting them with hand-drawn arrows. The board is preferable, as you can erase and redraw the arrows on it as the stickers move. Let all the members of the group participate, and not just one person. It is important not to forget to take a clear photo of what happened, and send it to all participants after the meeting.
Work in larger groups (9 - 30 people)
Let the members of the group break into small teams, each of which will focus on a specific problem. Working with several teams on the same problem is useful: you can come to the same or different conclusions, and both results will be interesting. Each team works with a separate flipchart / board and stickers. Periodically, teams should come together for short joint discussions and share experiences.
Working with a chart in perspective
Let the chart remain in the program you used: Visio or Powerpoint. If you decide to return to it again as part of the workshop, determine its purpose: to demonstrate the chart or to update it. If this is an update, repeat it on the board / flipchart with the help of stickers and arrows so that the workshop participants can effectively work together on the chart. After the meeting, “synchronize” the results with electronic tools.
This type of synchronization is time consuming, but often worth it. For collaboration, nothing surpasses real tools: a board and stickers.
Dangers
Too many arrows and cells
It happens that the diagram becomes so chaotic that it can not be disassembled. Then it needs to be simplified. Here are some techniques:
Simplicity
This is a simplified type of cause-and-effect diagrams - this is what is specially intended. It does not replace personal interaction. If you require more advanced or formalized techniques, refer to the literature on systems thinking. For example, “ The Fifth Discipline” by Peter Senge . But keep in mind: even a “perfect” diagram has no special value if only a doctor of science can understand it.
Transition to personalities
Avoid personal accusations of this type:
Problems are solved in the most efficient way, if we assume that they are all systemic. Of course, there are clumsy people. But even if this gives us significant inconvenience, the problem is still systemiccharacter: there is a system in which clumsy people are not considered to be such, or a system that lets terribly clumsy people inside, but does not help them become less awkward, and so on. It should be emphasized: treat all problems as systemic.
In the functioning of any growing business - not only in IT, but also in other areas - there comes a time when it is impossible to ignore problems abandoned into the far corner and having already managed to cover themselves with a noble patina. Their consequences are felt in the most unexpected situations. There are more than a dozen methods to deal with problems and make the business work, but you always have to start with the same thing: an analysis of the root causes of these same problems. And today Robots would like to talk about it - not only translating the articlehow to find the root causes of IT business coach and Agile, Scrum and Kanban specialist Henrik Kniberg - but also about how Robots fixed several of their own failures.
Henrik Kniberg. The purpose of this article is
cause-effect diagrams - a simple and convenient way to perform root cause analysis. I have been using these charts for many years, helping businesses recognize and solve a wide range of problems - both technical and organizational. The purpose of the article is to show how cause-effect diagrams work and teach the reader how to build them for their own needs.
Troubleshoot problems, not symptoms
The key to effective problem solving is to first make sure that you understand the problem you are trying to solve. Why does it require a solution, how to determine when it will be solved, and what is the root cause of this problem.
Often, “symptoms” appear in one place, although the true cause of the problem is in a completely different place. If you simply deal with the symptoms, without trying to assess the situation more deeply, it is likely that the problem will come back to light later, but in a different form.
Problem: Smoke in the bedroom.
Bad decision: Open the window and go to bed again.
Good decision:Find the source of smoke and deal with it. Oops! And there’s a fire in the basement! Further actions - put out the fire; to understand why it even appeared; set a fire alarm so that the next time you learn about the problem earlier.
Problem: Hot forehead, fatigue.
Bad decision: Put ice on your forehead to cool it. Eat sugar for energy. Continue work.
Good solution: Measure the temperature. Yes, I have a fever! Further action is to go home to rest.
Problem: Memory leak on the server.
Bad decision: Buy memory.
Good solution: Find and fix the source of a memory leak. Test to avoid future leaks.
... and so on.
Most of the problems in organizations are systemic. The system (business) fails, and the failure must be fixed. Until the root cause of this failure is clear, most attempts to deal with the problem will be ineffective or even counterproductive.
Thinking in A3 format and a lean approach to solving problems.
One of the fundamental principles of lean thinking is Kaizen - continuous process improvement. One of the most successful companies in the world, Toyota, associates a significant share of success with its high discipline in its approach to solving problems. Sometimes this approach is called “thinking in A3 format” (the knowledge gained during each “session” on problem solving is recorded on sheets A3).
Here is an example and template:
www.crisp.se/gratis-material-och-guider/a3-template
With the “A3 approach”, a significant part of the time (the left side of the sheet) is devoted to the analysis and visualization of the analysis of the root cause of the problem and precedes the development of any solutions . Cause and effect diagrams are not the only root cause analysis method. There are others: for example, the systematization of the value stream mapping and the construction of the Ishikawa diagram, or, as it is also called, the diagram of a fish bone. Sample A3 above contains a value stream map (top left) and a causal chart (bottom left).
Cause-effect diagrams are good for their intuitiveness and lack of need for additional explanations (especially in comparison with fish-bone diagrams). Another advantage is the ability to illustrate repeated vicious cycles , which is extremely useful from the point of view of systemic thinking. Next, we will talk about how to effectively create and use such diagrams.
How to use cause and effect diagrams
The basic process is as follows:
- Choose a problem — anything that bothers you — and write it down.
- Track its “upward movement” to assess the business implications, the “obvious damage” your problem is causing.
- Follow her “downward movement” to identify the root cause (or root cause).
- Define and emphasize vicious cycles.
- Repeat the above steps several times to adjust the chart.
- Decide which of the root causes you will decide on, what methods you will do (what countermeasures you can take).
The next step is follow up. If countermeasures work, congratulations! If not, do not despair. Analyze why they did not work, update the chart adjusted for your knowledge, and try other countermeasures.
In fact, countermeasures are not a solution, but an experiment . Your hypothesis is that countermeasures will solve (or minimize) the problem, but you can never be completely sure. In fact, you “poke a sharp stick” into your system, checking how it reacts. Therefore, follow up is important.
A mistake, in fact, means that your system sends you signals that are worth listening to. The only real mistake is the inability to learn from mistakes!
Example 1: lack of pair programming
One client asked to help him find out why his business does not use XP techniques such as pair programming and development through testing (TDD). “We know we must do this, but we don’t,” said the client.
Is the lack of TDD and pair programming real problem? As usual, often the things that we call problems are not, they are simply symptoms.
Q: What are the consequences of ignoring pair programming and TDD?
A: We believe that using these practices would improve the quality of the code.
Q: What are the consequences of poor code quality? Have you encountered real problems caused by poor quality code?
A: Yes, we had a demo flying out. Demo is a key element of our business, so this is a real problem.
OK, consider one of the elements and check if we can build a connection to the very “foundation”.
Q: Why do not you practice pair programming?
A: Because many are afraid that it will not work and we will waste time. We have no evidence that it works.
Q: What evidence do you need?
A: Well, we have seen studies that show that it is effective. But in our company no one actually tried to implement such practices, so we are not sure of success.
Here is the first loop:
They do not want to introduce new practices because they are not sure whether they will work. And they don’t know if they work, because they have not tried to implement them ...
Q: Why did you at least not make an attempt to use pair programming as an experiment?
A: We do not have time for experiments.
Q: Why?
A: Because we do not have a temporary reserve. Every hour is accountable. And customers continue to flood us with work.
Q: Why do customers not give you the opportunity to independently manage their time and consider it possible to pile on you with work at any convenient time?
A: They do not trust us to independently allocate time.
Lack of trust also leads to fear of failure in general, which, of course, reduces the likelihood of experimental use of new techniques such as pair programming without guarantees that they will work.
It turns out that there are two global root causes: a lack of trust and a managerial attitude toward accounting for every hour. Now back to the big picture.
The lack of trust between the client and the customer was the primary reason that XP practices, such as TDD and pair programming, were not implemented. This entails poor quality, because of which demos fly out. And you will never guess: the flying demos will reduce mutual trust even more. This is a vicious circle!
Interestingly, we performed this analysis during a two-day workshop with approximately 25 people. At first, we talked mainly about technical things - how to get started with TDD and pair programming. This approach was not particularly effective, instead we divided into groups and decided that each group chooses its own problem and begins to build a causal diagram and formulate a solution to the problem on sheets A3. Interestingly, several groups that analyzed different problems at first glance came to the same root cause: lack of trust. The chart above is just one example that illustrates this.
Thus, by the end of the master class, the conversation was already about how to increase the degree of trust between the client and the developer. It was an unexpected turn of the workshop. To begin with, we agreed that the next time we would invite “them” (clients) to the workshop, which should reduce the frequency of the opposition “we” and “they”.
Example 2: a long release cycle.
Suppose we have a problem: we always break deadlines. More precisely, our releases always come out later than planned.
A problem is a problem only if it prevents you from achieving your goal. Therefore, first of all, it is worth determining the goal and thinking about the consequences of the problem directly in the context of your goal. This will help the question “So what?”, Which must be asked until it is possible to identify the obvious damage.
Assume that the goal is to make customers happy and get maximum revenue. A dialogue might look something like this:
Q: “What is the negative effect of postponing releases? What could be the consequences? ”
A:“ Delays make our release cycles long ”
Q:“ So what? ”
A:“ This delays the receipt of revenue and negatively affects the speed of money in the company. We also lose customers because of this, because they are impatient. ”
In the process of dialogue, we add cells and causal arrows to the diagram. Usually I try to move “upstream” from the originally stated problem, “mapping” its consequences. But this is not a strict rule.
That is, it turns out that delaying releases is actually not a problem. Trueproblems are delayed revenue and loss of customers. At this stage, you need to consider three points:
Are there other factors leading to loss of customers and delayed revenue? If so, is it possible to assume that the blame for the release is to blame or should we turn our attention to something else? Can the problem be quantified? How much money have we lost? How many customers did it take? These data will help us evaluate the amount of effort that justifies itself in solving the indicated problem.
How do we understand that we have solved the problem? Suppose a happy consultant bursts into the office and proudly declares: “I solved the problem!” How to determine that this is not a bluff?
After analyzing the consequences of the problem, it’s time to dig deep into the root cause.
And then the questions “Why” come to the rescue. Yes, there is a “five why” technique that you could hear about if you were studying lean thinking.
Q: “Why are releases delayed?”
A: “Because the volume of work is growing.”
Q: “Why?”
A: “Because customers are inventing more and more features and insist that they should be added to the current release, refusing exclude low priority features from it. ”
Q:“ Why? Why not postpone adding new features to new releases? ”
A:“ Because the release cycle is so long that new requirements arise before the next release ”
There are so far only three“ Why. ” But you understood the principle. The dialogue allows you to form the following picture:
The vicious cycle is marked by red arrows. Repetitive problems almost always include such “loops”, but it takes some time to identify them. If you find such a loop, then the chances of a successful and irrevocable solution to the problems increase significantly!
Our goal is to identify the root cause of this problem so that we can achieve maximum effect with minimal effort. At the first stage, you can easily overlook important reasons, so let's go back and ask a few more questions.
Q: “Why is the release cycle long? Is
delayed releases the only reason? ” A:“ Well, actually, even without delays, our planned release cycles are long enough. ”
Q:“ How long is your planned release cycle? ”
A:“ Once a quarter. ”
Q. “But why is it so long?”
A: “Because releases are an expensive and complicated thing.”
Q: “Why?”
A: “Because every release has a lot of details and also because it is manual labor.”
On the left side, we see another vicious cycle (red arrows)! The long release interval means that each new version includes a large number of updates, which makes the release of the product a complex and expensive process. Because of this, we do not want to make releases often.
As you noticed, here I decided to note two root causes. And now - countermeasures: The
root cause
Lack of automation in the process of preparing releases
Countermeasure
Automate the process of preparing releases
Root cause
Low-priority features are not excluded from
Countermeasure releases.
Agree with the client that new features can be added to the release only if the same number of low-priority features
are excluded from it. There is no strict rule saying what reason is the root cause, but there are some signs:
- A cell has only outgoing arrows, but no incoming
- There is a feeling that from now on, digging deeper (asking additional “Why?”) Makes no sense
- The cell “has a solution” and, possibly, will have a significant positive impact on the problem.
The technique of “five why” is called so because usually about five questions separate us from the root cause. There is a tendency to stop prematurely. You don’t have to do this: keep digging!
It is worth taking into account that the initially posed problem - delayed releases - in fact, was not a problem and not the root cause. It was just a symptom. We used it as an excuse in order to build a causal relationship in ascending order to identify the true problem, and then in descending order to determine the root cause. This allows you to develop effective countermeasures with all knowledge of the matter.
Without an analysis of this type, there is a risk of reaching hasty conclusions and making ineffective and counterproductive changes. For example, by hiring additional employees, although the essence of the problem does not lie in the amount of labor. Or by changing the incentive system (by encouraging people to do the work on time, and punishing late work), although the existing incentive system had nothing to do with the problem.
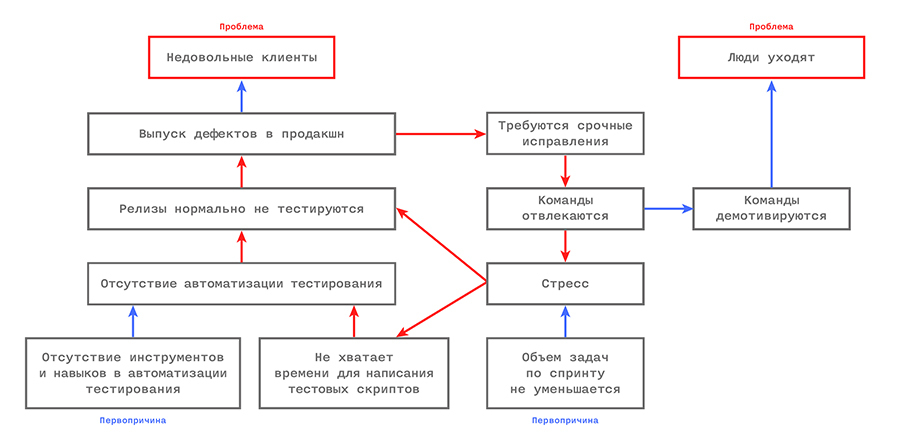
Example 3: defects in the production cycle
Imagine that we have problems with the defective code that runs in production.
Q: And what?
A: Defects make our customers angry
Q: Why are defects triggered in production?
A: Because they did not pass the necessary testing before release.
Q: Why was there no testing?
Etc.
And this is what we get:
Two vicious cycles! Look at the red arrows.
Loop 1 (inner loop): Defects in the product force you to make urgent changes, which distracts the team from working. Since employees are not relieved of the bulk of the tasks, they are stressed and do not have time to properly test new releases. Which, of course, leads to an even greater number of defects at the level of the entire production.
Loop 2 (outer loop):Since employees are under stress, they also do not have time to write automatic test scripts. The consequence is a general lack of automation in testing, which complicates the regression testing of new releases more and more. This, of course, leads to production defects and the need to make urgent changes. And as a result - to even more stress.
But that's not all!
Teams hate being distracted. The process of work disrupts and ultimately kills motivation. This may be the explanation for the high staff turnover! Thus, solving the root problem (defects in production), we get an additional bonus in the form of reducing staff turnover.
This is another benefit of cause and effect analysis. Typically, the root cause is the cause of more than one problem (which is why it is called “root” —main or root).
Causal analysis: Robot experience
Boris Ryabchikov, project manager:
My task was to track down the problems in the company. We identified the main production problem in advance. The hypothesis was as follows: we do not deliver projects on time, and, as a result, the company has a low money rate. A number of reasons were also excluded at the start: we assumed that the planning is carried out correctly, and the problem is somewhere else. The remaining problems were considered through this prism, and everything that was not relevant to the topic was simply thrown out. We wanted to deal with the main problem and built a map based on this.
The production process was graphically indicated: where we are and where we lose time and money.
To begin with, it was necessary to choose sources of information. In practice, it turned out that the most effective way is to collect problems individually with each employee. In retrospectives and standard reports, things usually appear that employees already voice with the whole team - at general meetings, with superiors. If a company has several divisions, they often compete with each other and “throw” problems to each other. When all employees come together, decency, as a rule, prevails and no one blames each other in the face. That is, problems can be hushed up. With individual interviews, they come to the surface.
I had to communicate with people in an informal setting - in a smoking room, expensive for the subway. Some problems were formulated precisely in such conversations. As it turned out, the “five why method” does not always work well in practice. Often people are nervous about the many “whys” and some immediately include protection. That is, in each case, an individual approach is required.
The data obtained were gradually collected and entered into a diagram, which turned out to be quite large. Based on the results of the analysis, I prepared a short report in which four root causes and one main problem were identified. All of them were grouped by competence centers in the company.
They began to work with several root causes at the same time. With this approach, there is a risk of not understanding which of the root causes was the main one. But in this case, he is justified.
Countermeasures were developed to eliminate the root causes and criteria for the success of their elimination were identified. The next step is the analysis of the intermediate result and the preparation of a new adjusted report. Often the final solution to problems becomes a rather lengthy process.
Example 4: A whole bunch of problems.
And here is a larger example. The organization used the Scrum methodology, but ran into some problems. As a result of several interviews and workshops, a causal diagram was born that showed that the team actually used Scrum incorrectly, which caused problems.
It became obvious to everyone that many of the root causes could be eliminated by the correct use of Scrum (for example, reorganization into cross-functional teams, the belief that each team has a product owner). This served as an impetus for organizational changes, which eventually eliminated many of the root causes (green stars). The next step was to improve test automation.
Of course, Scrum is not a panacea. In fact, sometimes Scrum itself is a problem and then other techniques, such as Kanban , are required to solve .
Practical questions - how to create and maintain diagrams
Work alone
When I make diagrams alone, the most convenient tools seem to me to be Visio or Powerpoint. They allow you to quickly move items, resize cells and quickly back up while working on the image.
Work in small groups (2 - 8 people)
Gather around a board or flipchart. Instead of cells, use stickers, connecting them with hand-drawn arrows. The board is preferable, as you can erase and redraw the arrows on it as the stickers move. Let all the members of the group participate, and not just one person. It is important not to forget to take a clear photo of what happened, and send it to all participants after the meeting.
Work in larger groups (9 - 30 people)
Let the members of the group break into small teams, each of which will focus on a specific problem. Working with several teams on the same problem is useful: you can come to the same or different conclusions, and both results will be interesting. Each team works with a separate flipchart / board and stickers. Periodically, teams should come together for short joint discussions and share experiences.
Working with a chart in perspective
Let the chart remain in the program you used: Visio or Powerpoint. If you decide to return to it again as part of the workshop, determine its purpose: to demonstrate the chart or to update it. If this is an update, repeat it on the board / flipchart with the help of stickers and arrows so that the workshop participants can effectively work together on the chart. After the meeting, “synchronize” the results with electronic tools.
This type of synchronization is time consuming, but often worth it. For collaboration, nothing surpasses real tools: a board and stickers.
Dangers
Too many arrows and cells
It happens that the diagram becomes so chaotic that it can not be disassembled. Then it needs to be simplified. Here are some techniques:
- Get rid of irrelevant cells (cells that don't add extra meaning to the chart).
- Take on the principle of “first in depth” instead of “first in breadth”. Do not try to fix each cause of a problem, write down only one or two of the most important, and then move deeper.
- Accept imperfections. Such a diagram will never be perfect. “All models are wrong, but some of them are useful,” said George Box.
- Maybe your problem area is too wide: try to limit yourself to a more narrowly defined problem.
- Divide the chart into parts, as I demonstrated in Example 3 above.
Simplicity
This is a simplified type of cause-and-effect diagrams - this is what is specially intended. It does not replace personal interaction. If you require more advanced or formalized techniques, refer to the literature on systems thinking. For example, “ The Fifth Discipline” by Peter Senge . But keep in mind: even a “perfect” diagram has no special value if only a doctor of science can understand it.
Transition to personalities
Avoid personal accusations of this type:
Problems are solved in the most efficient way, if we assume that they are all systemic. Of course, there are clumsy people. But even if this gives us significant inconvenience, the problem is still systemiccharacter: there is a system in which clumsy people are not considered to be such, or a system that lets terribly clumsy people inside, but does not help them become less awkward, and so on. It should be emphasized: treat all problems as systemic.