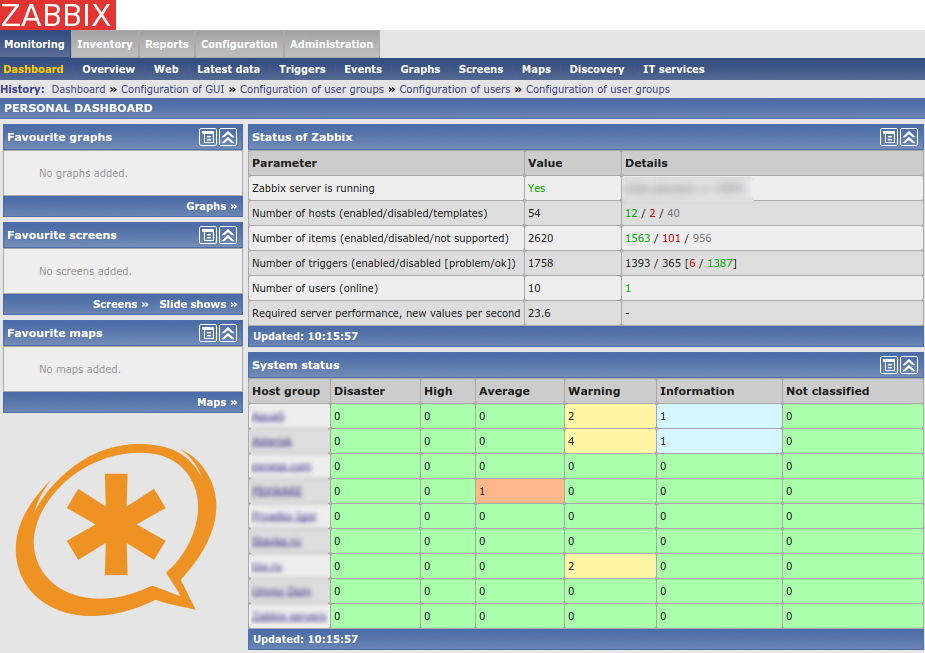
A universal way to monitor Asterisk with Zabbix

Good afternoon, Khabrovsk residents.
In this post, I would like to talk about how we monitor Asterisk servers. Of course, there are already posts on using Zabbix to monitor Asterisk on the hub, we got a lot of interesting information in them and added a number of necessary things, in our opinion.
What came of it - you can see under the cut.
Telephony is a critical service in the work of the company. The most important task after the deployment and configuration of the telephone infrastructure is its monitoring. Timely notification of persons responsible for the operation of the telephone network can save the company a huge amount of time and money and minimize downtime of the telephone exchange.
Initially, to monitor the Asterisk server, you need to choose the tool that will be monitored. Of course, there are a lot of self-written scripts on the network that allow superficial monitoring of the server, but they are often not very functional, require deep linux knowledge and naturally do not have a GUI.
To monitor the status of telephony servers, we chose the Zabbix monitoring system. Zabbix is a fairly powerful monitoring tool that has a large number of templates for monitoring hosts and processes and allows you to embed custom ones. For the normal functioning of the Asterisk server, we identified the following components that need to be monitored and wrote python scripts for them, which we will port to Zabbix:
- CPU, RAM, HDD usage (graphs, reports and notifications)
- Network traffic on each interface
- Process and memory monitoring for Asterisk
- Process and memory analysis for mysql
- Process and memory monitoring for Apache
- Fail2ban process tracking
- Registration and status of SIP providers
- The status of each SIP player (peer)
- Number of ongoing calls in Asterisk
- Queue Monitoring
- Queue Call Tracking
- Queue Agent Monitoring
If problems arise with one of the above parameters, Zabbix sends a notification (notification options: notifications by e-mail, jabber, SMS) to the PBX administrator or any other responsible person for taking measures to quickly fix the problem.
Zabbix architecture includes:
- directly the monitoring server itself, receiving and processing data, as well as launching alert scripts
- Database
- web interface
- Zabbix agent installed on the monitored server.
Consider the process of installing a zabbix agent.
Initially, the following dependencies should be satisfied on your server:
- python 2.7+
- python-all-dev
- Zabbix 2.4+
- asterisk 1.8+
- argparse 1.2.1+
- pexpect 3.3+
- posix-ipc 0.9.9+
- wsgiref 0.1.2+
Install the Zabbix agent directly:
aptitude install zabbix-agent
Install python modules to execute our custom Zabbix scripts:
aptitude install python-pip python-all-dev
pip install argparse pexpect posix-ipc wsgiref
Download the scripts we need (for convenience, we collected them on bitbucket):
cd /etc/zabbix/
git clone https://pbxware@bitbucket.org/pbxware/asterisk-zabbix-py.git
cd asterisk-zabbix-py
Change settings.py in accordance with our Asterisk settings:
vim setting.py
# coding=utf-8
HOST = "localhost" - адрес, на котором работае наш сервер Asterisk
PORT = "5038" - порт AMI из manager.conf
USERNAME = "zabbix" - пользователь AMI
PASSWORD = "zabbixpasswordami" - пароль пользователя AMI
DEFAULT_TIMEOUT = 3
AMI_VERSION = "1.3" - версия AMI, чтобы узнать наберите в терминале telnet localhost 5038
Add the following lines at the end of the /etc/asterisk/manager.conf configuration file:
[zabbix] ; username from settings.py
secret=zabbixpasswordami ; password from settings.py
deny=0.0.0.0/0.0.0.0
permit=127.0.0.1/255.255.255.0
read = system,call,log,verbose,agent,user,config,dtmf,reporting,cdr,dialplan
write = system,call,agent,user,command,reporting,message
allowmultiplelogin = yes
displayconnects = no
writetimeout = 100
After completing these steps, restart Asterisk:
service asterisk restart
Next, in the configuration file of the zabbix agent /etc/zabbix/zabbix_agentd.conf, add at the very bottom:
Include=/etc/zabbix/asterisk-zabbix-py/userparameter_asterisk.conf
and reboot the zabbix agent:
/etc/init.d/zabbix-agent restart
Available teams:
- channel - CoreShowChannels
- member - SIP member
- peer - SIP peers
- queue - SIP queue
- registry - SIP registrations
Options:
./run.py -a Discovery.
./run.py -f
./run.py -f
./run.py -v Verbose
Examples:
sudo -u zabbix /etc/zabbix/asterisk-zabbix-py/run.py registry -a Return all SIP Registrations
sudo -u zabbix / etc / zabbix / asterisk -zabbix-py / run.py peer -a Return all SIP Peers
sudo -u zabbix /etc/zabbix/asterisk-zabbix-py/run.py peer -f Address-IP -p 101 Return ip address peer 101
sudo -u zabbix /etc/zabbix/asterisk-zabbix-py/run.py peer -f Status -r "(\ d +)" -p 101 Return Qualify user 101
Module description
Asterisk polling module works through AMI.
settings.py - settings of the
userparameter_asterisk.conf module - zabbix commands and parameters passed to the
zasterisk / ami.py module - connection to AMI using pexpect
commands / - the command folder
The module is universal, and if there is no parameter you can easily add it. For example, you need to get the context of sip-peer 101:
sudo -u zabbix /etc/zabbix/asterisk-zabbix-py/run.py peer -f Context -p 101
we get the response from-users (my context name)
or, for example, find out the codecs used:
sudo -u zabbix /etc/zabbix/asterisk-zabbix-py/run.py peer -f Codecs -p 101
we get the answer (g722 | ulaw | alaw | g729)
For more detailed information output to the commands, you can add the "-v" option.
If we need additional commands, then, by analogy with the files from the commands, we add our own, for example iax2.py, which will monitor IAX peers:
# coding=utf-8
from zasterisk.base import DiscoveryFieldCommand
class Command(DiscoveryFieldCommand):
    help = '''
        IAX2 peers
    '''
    def discovery(self, ami):
        def callback(connect, timeout):
            events = self.parse_events(connect)
            return self.create_discovery(events.get("PeerEntry"), "{#USERNAME}", "ObjectName")
        return ami.execute("IAXpeers", {}, callback)
    def get_field(self, ami, field_name, param):
        return ami.execute("IAXpeers", {"Peer": param}, lambda connect, timeout: self.expect_field(
            connect, field_name, timeout))
    def count(self, ami):
        return 0
As a result, we will be able to monitor the IAX peer parameters:
sudo -u zabbix /etc/zabbix/asterisk-zabbix-py/run.py iax2 -v -f IPaddress -p demo
result: 216.207.245.47
In conclusion, I would like to note that we have cited only some processes that are important in our opinion for monitoring. Using this module for Zabbix, you can monitor other processes you need. I hope this topic can get you more detailed information about the "life" of your Asterisk and minimize downtime as much as possible :)
