Reporting and analysis during software development using the example of HP ALM 12.01
- Tutorial
Report: a document containing information about the actions taken, the results of the work performed
Wiktionary The
work of the manager consists of a huge number of reports that require constant analysis of the data. Compiling them can take a lot of time, require huge resources, and an error in the report can lead to the collapse of the entire project. How, given all these factors, you can quickly, accurately, in time get the current status of the product, so that there is time for team management, planning, etc.
The most logical answer would be to use any software that automates most operations and minimizes manual work.
Let's see how this can be done with HP Application Lifecycle Management (ALM).
A small digression. What is HP ALM, which distinguishes it from the list of competing products on the market.
So, the main goal of HP ALM is to manage the software development life cycle.
HP ALM allows planning and control at all stages of development and opens up unprecedented opportunities for data analysis and reporting, right out of the box, and the ability to create customizable reports for demanding users with the ability to save in a variety of formats: html, doc (x), xls (s), pdf.
Let us dwell on the most interesting types of reports and see how easy it is to get and visualize the necessary data.
So, you are a manager and you need to receive operational information about how many tests have been performed and in what condition they are, to draw conclusions about the status.
For this purpose Live Analysis is suitable for us . You can configure one or 2 graphs, which will be available in the Live Analysis tab for all folders of the TestLab module.

In addition, we can access quick reports from the Analysis menu of the corresponding module.

With a few clicks of the mouse, we can create a graph showing the status of defects for each member of the testing team.

We can save all the results obtained for future use in the Dashboard module , using a convenient tree-like structure for presenting information, including the possibility of grouping into folders. You can save data both for personal use (Private), and available to other users (Public)

What to do if you need to prepare for a sudden meeting and provide not only numbers and graphs that visualize these results, but also a detailed report on entities, including detailed information, show used attachments, hierarchy, etc.
To do this, there is a report on the project ( by Project the Report ), allowing multiple levels of hierarchy of entities, the combination of different types of entities, the use of custom filters, etc.
For example, we can generate a report on the requirements of their test coverage (including detailed information on the tests), and also a graph with active defects detected during testing.


HP ALM has reports available in all modules, and there are specific reports specific to certain modules (for example, Age Defects, Coverage of requirements with tests, etc.). The most flexible reports available are those based on business presentations.
Business presentation ( Business the Views ) is a logical layer between the mechanism of forming reports and data directly. A business presentation allows you to create certain blanks with predefined query structures that provide the requirements for data confidentiality and usability necessary in a business environment.
A good example of demonstrating the possibility of representations is to build a report for entities between which there are no direct connections, and specific restrictions apply to the sample. For example, display a list of requirements, during testing of which critical defects were found last month and they were closed no later than 2 weeks after the discovery. At the same time, allow the unloading of only the listed columns and prevent the loading of all the data necessary for the calculation.
Here is an example of setting up a business view, available to the project administrator - you can see how easily you can create your own view or edit an existing one using the power of the DQL language.

After configuring the view, it will be available in MS Excel using the BV Excel Addin, which allows you to use all the features of MS Office to process the received data, or directly in ALM using BV Graphs.

ALM 12.01 added a very interesting ability to retrieve data from several projects, allowing you to link data and provide summary reports.


If you have several graphs that allow you to track the status, progress, dynamics of the process, etc. you are interested in, you can place them on one page using the Dashboards functionality

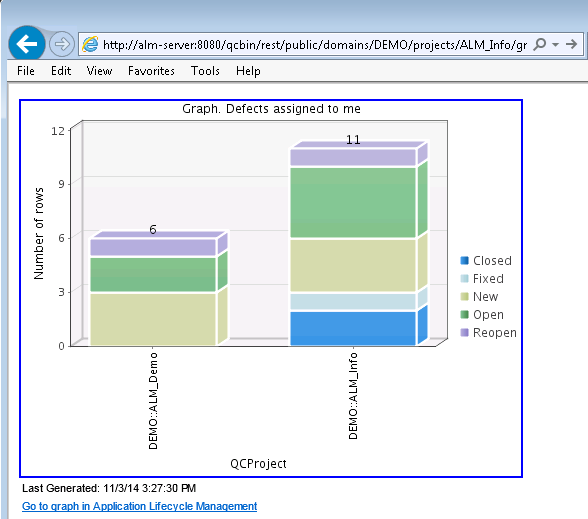
So, the reports have been made, the necessary graphs have been generated, and you need to share this with colleagues who do not use HP ALM or publish this data outside your organization - here the Shared Analysis functionality will be extremely convenient , which allows you to create a link to the generated reports and insert it into the correspondence or web -form for access to report resources from outside. (using ALM, you can organize both anonymous and authorized access to the generated reports when creating the link)

Here is what it will look like after the link is opened:
Another interesting feature of working with charts is getting detailed results directly from the viewing mode ( Drilldown) - simply by clicking on the graph you are interested in, you will receive a detailed report on what data makes up this graphical representation.

We looked at some of the types of reporting available out of the box with HP ALM. You can find more information in the HP ALM User Guide, or simply start using it and make sure that reporting is easy and convenient even for a person who does not have special skills.
Posted by Dmitry Chernov, Head of HP ALM Testing Team
Wiktionary The
work of the manager consists of a huge number of reports that require constant analysis of the data. Compiling them can take a lot of time, require huge resources, and an error in the report can lead to the collapse of the entire project. How, given all these factors, you can quickly, accurately, in time get the current status of the product, so that there is time for team management, planning, etc.
The most logical answer would be to use any software that automates most operations and minimizes manual work.
Let's see how this can be done with HP Application Lifecycle Management (ALM).
A small digression. What is HP ALM, which distinguishes it from the list of competing products on the market.
So, the main goal of HP ALM is to manage the software development life cycle.
HP ALM allows planning and control at all stages of development and opens up unprecedented opportunities for data analysis and reporting, right out of the box, and the ability to create customizable reports for demanding users with the ability to save in a variety of formats: html, doc (x), xls (s), pdf.
Let us dwell on the most interesting types of reports and see how easy it is to get and visualize the necessary data.
So, you are a manager and you need to receive operational information about how many tests have been performed and in what condition they are, to draw conclusions about the status.
For this purpose Live Analysis is suitable for us . You can configure one or 2 graphs, which will be available in the Live Analysis tab for all folders of the TestLab module.
In addition, we can access quick reports from the Analysis menu of the corresponding module.
With a few clicks of the mouse, we can create a graph showing the status of defects for each member of the testing team.
We can save all the results obtained for future use in the Dashboard module , using a convenient tree-like structure for presenting information, including the possibility of grouping into folders. You can save data both for personal use (Private), and available to other users (Public)
What to do if you need to prepare for a sudden meeting and provide not only numbers and graphs that visualize these results, but also a detailed report on entities, including detailed information, show used attachments, hierarchy, etc.
To do this, there is a report on the project ( by Project the Report ), allowing multiple levels of hierarchy of entities, the combination of different types of entities, the use of custom filters, etc.
For example, we can generate a report on the requirements of their test coverage (including detailed information on the tests), and also a graph with active defects detected during testing.
HP ALM has reports available in all modules, and there are specific reports specific to certain modules (for example, Age Defects, Coverage of requirements with tests, etc.). The most flexible reports available are those based on business presentations.
Business presentation ( Business the Views ) is a logical layer between the mechanism of forming reports and data directly. A business presentation allows you to create certain blanks with predefined query structures that provide the requirements for data confidentiality and usability necessary in a business environment.
A good example of demonstrating the possibility of representations is to build a report for entities between which there are no direct connections, and specific restrictions apply to the sample. For example, display a list of requirements, during testing of which critical defects were found last month and they were closed no later than 2 weeks after the discovery. At the same time, allow the unloading of only the listed columns and prevent the loading of all the data necessary for the calculation.
Here is an example of setting up a business view, available to the project administrator - you can see how easily you can create your own view or edit an existing one using the power of the DQL language.
After configuring the view, it will be available in MS Excel using the BV Excel Addin, which allows you to use all the features of MS Office to process the received data, or directly in ALM using BV Graphs.
ALM 12.01 added a very interesting ability to retrieve data from several projects, allowing you to link data and provide summary reports.
If you have several graphs that allow you to track the status, progress, dynamics of the process, etc. you are interested in, you can place them on one page using the Dashboards functionality
So, the reports have been made, the necessary graphs have been generated, and you need to share this with colleagues who do not use HP ALM or publish this data outside your organization - here the Shared Analysis functionality will be extremely convenient , which allows you to create a link to the generated reports and insert it into the correspondence or web -form for access to report resources from outside. (using ALM, you can organize both anonymous and authorized access to the generated reports when creating the link)
Here is what it will look like after the link is opened:
Another interesting feature of working with charts is getting detailed results directly from the viewing mode ( Drilldown) - simply by clicking on the graph you are interested in, you will receive a detailed report on what data makes up this graphical representation.
We looked at some of the types of reporting available out of the box with HP ALM. You can find more information in the HP ALM User Guide, or simply start using it and make sure that reporting is easy and convenient even for a person who does not have special skills.
Posted by Dmitry Chernov, Head of HP ALM Testing Team