Install and configure CA Infrastructure Management. Part one. Performance management
 Recently, articles related to monitoring have become increasingly common on the hub.
 Products such as MS SCOM, IBM Tivoli, products from HP, Zabbix and even The Dude are described, but for some reason I could not find a single description (and there are almost no references) of monitoring products from CA.
Well, not so long ago, one of their solutions for monitoring infrastructure fell into my hands, intended primarily for telecom and large CA Infrastructure Management organizations .
1. The composition of the decision.
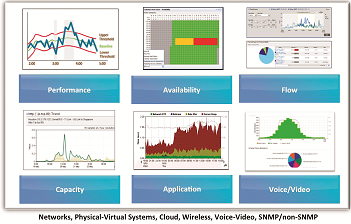
Infrastructure Management - consists of the following products:
CA Performance Management - is the main entry point into the system and is responsible for monitoring infrastructure performance.
CA Spectrum - is responsible for monitoring availability, monitoring equipment configurations, system response to events, alerting operators and integrating with Service desk systems.
CA Network Flow Analysis - is responsible for controlling network traffic passing through routers.
The following products can also optionally be integrated into the system:
CA Virtual Assurance for IM - designed for monitoring virtual infrastructure.
CA Unified Communications Monitor- engaged in monitoring voice and video telephony.
CA Application Delivery Analysis and CA Application Performance Management are responsible for monitoring applications.
Performance Management is built on the basis of two modules, namely: CA Performance Center and CA Data Aggregator .
The Performance Center is a web portal that is an “umbrella” for the monitoring products themselves, and is responsible for their integration into a single system, and it
is also a single entry point into the monitoring system.
Data Aggregator - is responsible for detecting equipment, adding this equipment to the monitoring circuit, polling the status and performance of equipment using the protocol
SNMP, as well as long-term storage of this data.
CA Data Aggregator consists of three components:
Data Collector - responsible for polling equipment and transferring this data to Data Aggregator.
Data Aggregator - is responsible for managing the Data Collector, aggregating the received data, transferring the received data to the Data Repository for storage and providing the requested data to the Performance Center.
Data Repository - responsible for the long-term storage of data.
2. Installation.
Performance Management should be installed in the following order:
- Data repository
- Data aggregator
- Data collector
- Performance center
The stand architecture will look as follows:

Red Hat Linux Enterprise 6.4-x86_x64 will be used as the OS (CentOS can be used as an alternative).
Performance Management version 2.3.4 will be installed.
Install Data Repository
- In terms of hardware requirements, the vendor recommends not using the Logical Volume Manager, and using the Standard Partition.
- Set a static IP address on the server.
- Indicate the names and addresses of all system servers in the / etc / hosts file.
10.161.80.150 DA 10.161.80.151 DR 10.161.80.152 PC 10.161.80.153 DC - Configure iptables to open the following ports:
- Port 22 (TCP protocol)
- Port 4033 (TCP and UDP protocol)
- Port 4803 (TCP and UDP protocol)
- Port 4804 (UDP protocol)
- Port 4805 (UDP protocol)
- Port 5444 (TCP protocol)
- Port 5450 (TCP protocol)
- Port 5433 (TCP protocol)
service iptables stop chkconfig iptables off - Transfer the installDR.bin file from the archive with the Data Aggregator distribution (GEN06092429M.tar.gz) to the server in the / tmp / DR / directory
- We set the execution rights
chmod u+x ./installDR.bin - We start unpacking the distribution kit
./installDR.bin - In the process of unpacking, we select the language, agree with the license agreement and specify the path to unpack (by default
/ opt / CA / IMDataRepository_vertica7). - We go to the folder where we unpacked the distribution and edit the file /opt/CA/IMDataRepository_vertica7/drinstall.properties
# Linux user created to serve as the database administrator DbAdminLinuxUser=dradmin # Home directory for database administrator Linux user # Make sure the parent directory of the home directory exists # before running dr_install.sh DbAdminLinuxUserHome=/export/dradmin # Location of Vertica's data directory DbDataDir=/data # Location of Vertica's catalog directory DbCatalogDir=/catalog # Comma-delimited list of hostnames for the Data Repository # === Do NOT place any spaces in the list of host names === DbHostNames=DR # Database name DbName=drdata # Database password DbPwd=dbpass - In accordance with the settings, create the necessary directories:
mkdir /export mkdir /data mkdir /catalog - Create a user and specify the home folder in accordance with the drinstall.properties configuration file
useradd dradmin -d /export/dradmin passwd dradmin - Then we can run the system preset script:
./dr_validate.sh -p ./drinstall.properties - Reboot the server.
- Once again, we start the preset script and check if all the items have worked.
- If something did not work out, we change these parameters manually, after which we repeat the previous paragraph.
- Next, run the installation script
./dr_install.sh -p ./drinstall.properties - After that, we check the installation:
su – dradmin
/opt/vertica/bin/adminTools
In the window that appears, select View Database Cluster State, look at the status of the database, and if everything is in order, go to the next server.
Install Data Aggregator
- Set the static IP address on the server.
- Specify the names and addresses of all system servers in the / etc / hosts file.
10.161.80.150 DA 10.161.80.151 DR 10.161.80.152 PC 10.161.80.153 DC - Configure iptables to open the following ports:
- Port 22 (TCP protocol)
- Port 8581 (TCP and UDP protocol)
- Port 61616 (TCP and UDP protocol)
Or disable iptables:service iptables stop chkconfig iptables off - Add the following lines to the /etc/security/limits.conf file:
# Added by Data Aggregator * soft nofile 65536 # Added by Data Aggregator * hard nofile 65536 - Transfer the installDA.bin file from the archive with the Data Aggregator distribution (GEN06092429M.tar.gz) to the server in the / tmp / DA / directory
- We set the execution rights
chmod a+x ./installDA.bin - We start the distribution installation
./installDA.bin –i console - In the process of unpacking, we select the language, agree with the license agreement and specify the path to unpack (by default / opt / IMDataAggregator).
- Specify the maximum amount of memory that Data Aggregator can use (Minimum 2G).
- Specify the maximum amount of memory that ActiveMQ can use (Minimum 500M).
- We indicate the IP address of the Data Repository server (On my stand 10.161.80.151).
- Specify the port for communication with the Data Repository (default is 5433).
- Specify the name of the Data Repository database (we specified it in the drinstall.properties file, in my case drdata).
- We set the username and password to connect to the database (I use dauser and dapass).
- We specify the username and password of the database administrator (we specified them in the drinstall.properties file, in my case dradmin and dbpass).
- Specify the port that will be used for REST requests to the Data Aggregator server (default 8581).
- Specify the port that will be used for SSH debugging ActiveMQ (default 8501).
- Check the installation through the web browser Data_AggregatorIP : port / rest / (in my case 10.161.80.150 : 8581 / rest / if something doesn’t work # service activemq status)
Install Data Collector
- Set the static IP address on the server.
- Specify the names and addresses of all system servers in the / etc / hosts file.
10.161.80.150 DA 10.161.80.151 DR 10.161.80.152 PC 10.161.80.153 DC - Download the Data Collector distribution
(in my case 10.161.80.150 : 8581 / dcm / InstData / Linux / VM / install.bin)wget http://Data_AggregatorIP:port/dcm/InstData/Linux/VM/install.bin - We set the execution rights
chmod a+x ./install.bin - We start the distribution installation
./install.bin –i console - In the process of unpacking, we select the language, agree with the license agreement and indicate the path to unpack (by default / opt / IMDataCollector).
- Specify the maximum amount of memory that the Data Collector can use (at least 1G).
- We indicate the IP address of the Data Aggregator server (on my stand 10.161.80.150).
Install Performance Center
- Set the static IP address on the server.
- Specify the names and addresses of all system servers in the / etc / hosts file.
10.161.80.150 DA 10.161.80.151 DR 10.161.80.152 PC 10.161.80.153 DC - Configure iptables to open the following ports:
- Port 22 (TCP protocol)
- Port 80 (TCP protocol)
- Port 3306 (TCP protocol)
- Port 8181 (TCP protocol)
- Port 8281 (TCP protocol)
- Port 8381 (TCP protocol)
- Port 8481 (TCP protocol)
- Port 8581 (TCP protocol)
- Port 8681 (TCP protocol)
Or disable iptables:service iptables stop [root@PC ~]# chkconfig iptables off - Turn on the time service
chkconfig ntpd on [root@PC ~]# service ntpd start - Add the following lines to the /etc/security/limits.conf file:
# Added by Data Aggregator
* soft nofile 65536
# Added by Data Aggregator
* hard nofile 65536
And enter the commandulimit -n 65536 - Transfer the file CAPerfCenterSetup.bin from the archive with the Performance Center distribution kit (GEN06092502M.tar.gz) to the server in the / tmp / PC / directory
- We set the execution rights
chmod +x ./CAPerfCenterSetup.bin - We start the distribution installation
./ CAPerfCenterSetup.bin –i console - In the process of unpacking, we select the language, agree with the license agreement and indicate the path to unpack (by default / opt / CA).
- Specify the maximum amount of memory that the Console can use (minimum 1312M).
- Specify the maximum amount of memory that Device Manager can use (minimum 1312M).
- Specify the maximum amount of memory that Event Manager can use (minimum 1968M).
- Specify the path to install MySQL (default / opt / CA / MySql / data).
3. The first launch.
After installation, we check the operability of the entire system.
- In a web browser, go to the server with the installed Performance Center (10.161.80.152:8181).
- We pass authorization (Login: admin; Password: admin).
- We pass to management of data sources (Admin-> Data Sources).

- And add our Data Aggregator as a data source.

- After that, go to the settings of the Data Aggregator and check the availability of the Data Collector.

- After checking the Data Collector, we try to create a new SNMP discovery profile.
(Admin -> SNMP Profiles). - And a new discovery profile (Admin -> Data Aggregator -> Monitored Inventory -> Discovery Profile).

- After the discovery is complete, go to Inventory -> Devices, and check the list of discovered devices.

Conclusion
Unfortunately, Performance Management itself, although it is a key module of Infrastructure Management, does not provide all the necessary data necessary for monitoring network infrastructure; for this, CA Spectrum and CA Network Flow Analysis must be included in the system. What I plan to do in the next part of the article.
In the meantime, information about the status of Routers and Servers: