GUI for xdebug trace files
Have you ever had to deal with confusing code without clear documentation? For example, what happens when a page is created in some CMS, or why and from where exactly does someone else’s code send an email, or does something else?
There are many tricks to dive into someone else's code. You can use var_dump (), for which you will have to run the same script many times. You can configure the debugger, but then you will have to enter (Step Into) many functions that are not relevant to what you are looking for, and if you miss (Step Over) some important call, you will have to start all over again. Modern IDEs provide good means of static code analysis, but with their support it can be difficult to understand what happens at runtime.
For a long time, I was attracted to the xdebug trace capabilities, but manually tracking something in a multi-megabyte log is completely unrealistic, and I did not find any intelligible GUI for * .xt files. Therefore, I decided to write my own visualizer, which I want to talk about.
Maybe I was looking badly and wasting my time on my own bike. If you know a good GUI for xdebug traces, then you can not read further, just do not forget to leave a link in the comments. I wrote my GUI in php as a web project. Ideally, this should be a plugin for PHPStorm, Eclipse, or another IDE, but I would not have mastered it. Immediately share the link to the source: github.com/vtk13/xdebug-trace-viewer . The GUI is quite resource intensive, so no online demo is provided. You will have to install it on your server if you want to try it live.
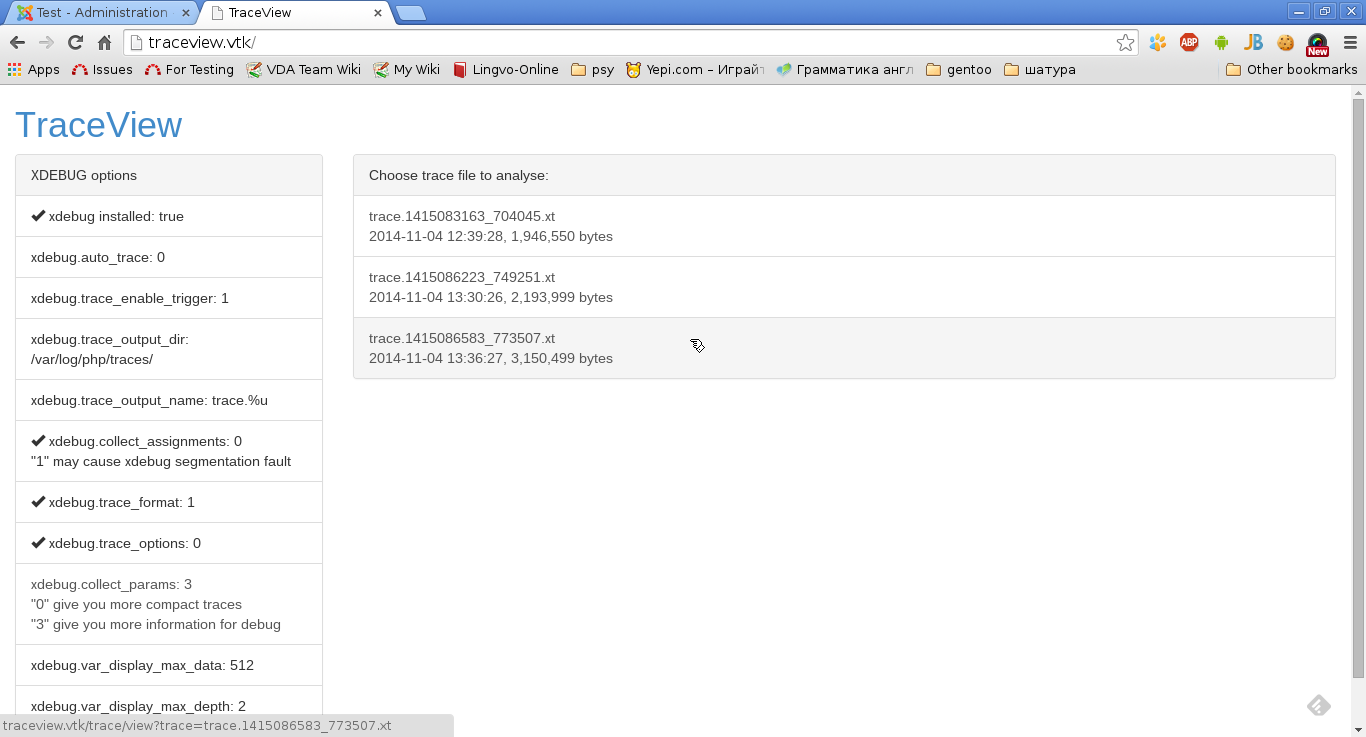
Here I will tell you what you can learn from the course on the example of Joomla. Suppose that you already know what xdebug is and how xdebug tracing differs from profiling . Otherwise, why do you need a similar GUI? Here are the recommended values for ini parameters:
So, let's say you write your extension for Joomla, which is supposed to create new articles and want to know how article creation works in Joomla. First, get the trace file. In the joomla admin panel, add & XDEBUG_TRACE = 1 in the action of the article creation form:

After creating the article in xdebug.trace_output_dir, you should get a * .xt file, which should also appear on the GUI main page:
Once we analyze the creation of the article, but it’s probably worth starting the study with mysql functions. We select the desired trace file and look for “mysql” by the names of the executed functions:
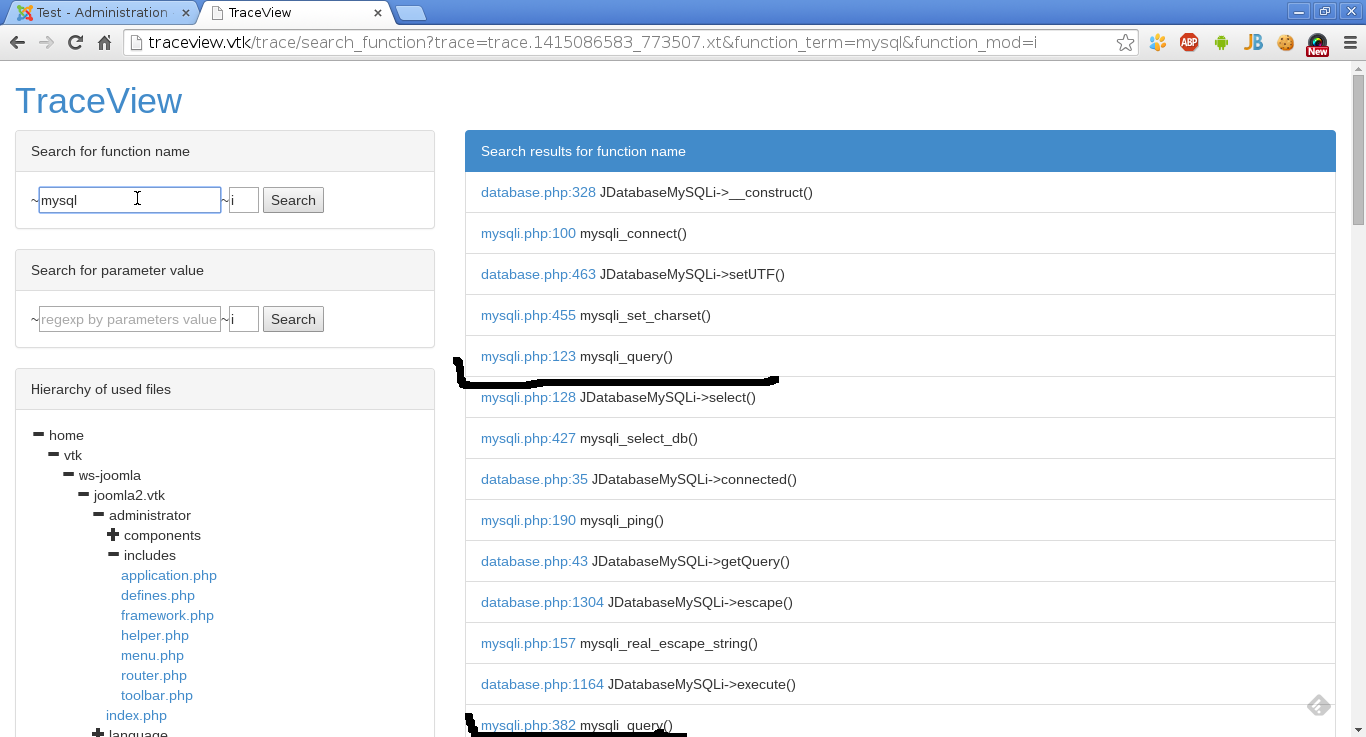
In our example, in the results there are two places with the mysqli_query () function call: mysqli.php: 123 and mysqli.php: 382. Each of the calls can be executed many times during the execution of the script, but in this case only information about the lines that are executed is displayed. I must say right away that one of the calls (in the mysqli.php file line 123) is executed only once upon connection and is not of interest. But the second search result - “mysqli.php: 382 mysqli_query ()” - is more interesting.
Using the link "mysqli.php: 382" in the search results, you can proceed to display the source code:
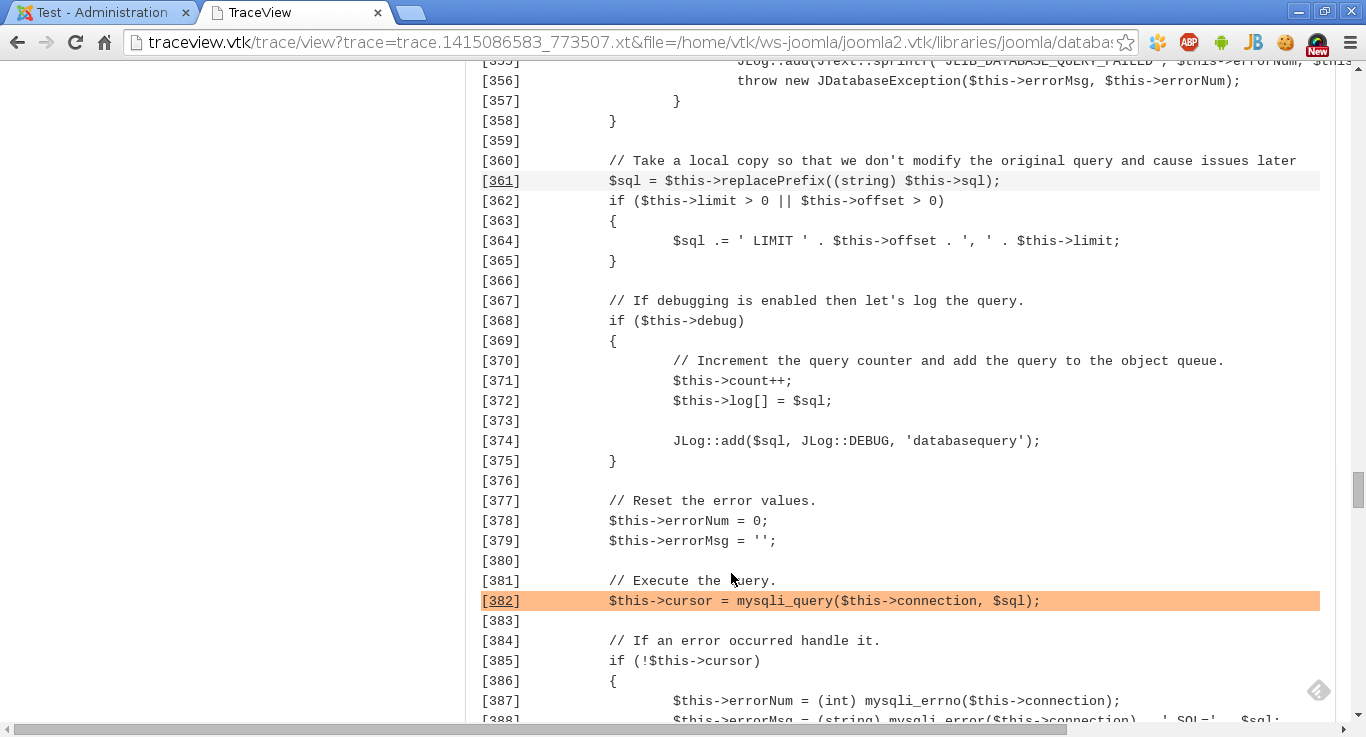
In the source code, the lines that were executed are highlighted. It is worth saying that not all executed lines are highlighted. Xdebug writes only calls to functions to trace, therefore strings, for example, with assignment of variables are absent in the trace file, and therefore they are not highlighted in the GUI.
A small menu is attached to each executed line, accessible by clicking on the line number:

In our example, I am interested in all calls to the mysqli_query () function, for which I need to click on the “View all calls” link in the 382nd line menu. In the list of all calls to the mysqli_query function, you can find 2 calls with an INSERT request:
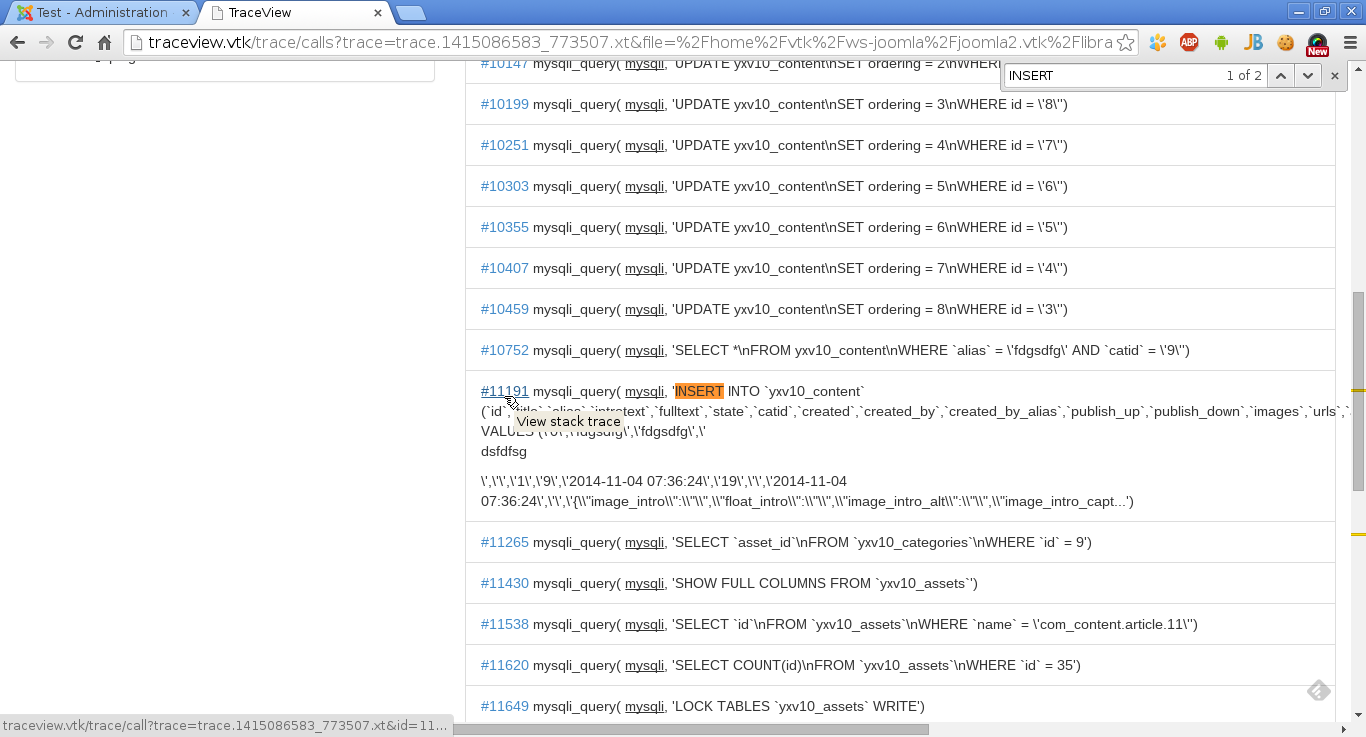
Just two INSERTs for creating an article does not look bad - in the worst case, your plug-in will be able to create an article directly in the database if you can’t find any internal API for this. But it’s too early to despair. Using the link # 11191 in the line with INSERT, you can open stacktrace for this call (the numbers in the link are not of particular interest, this is the id of the function call from the * .tx file):
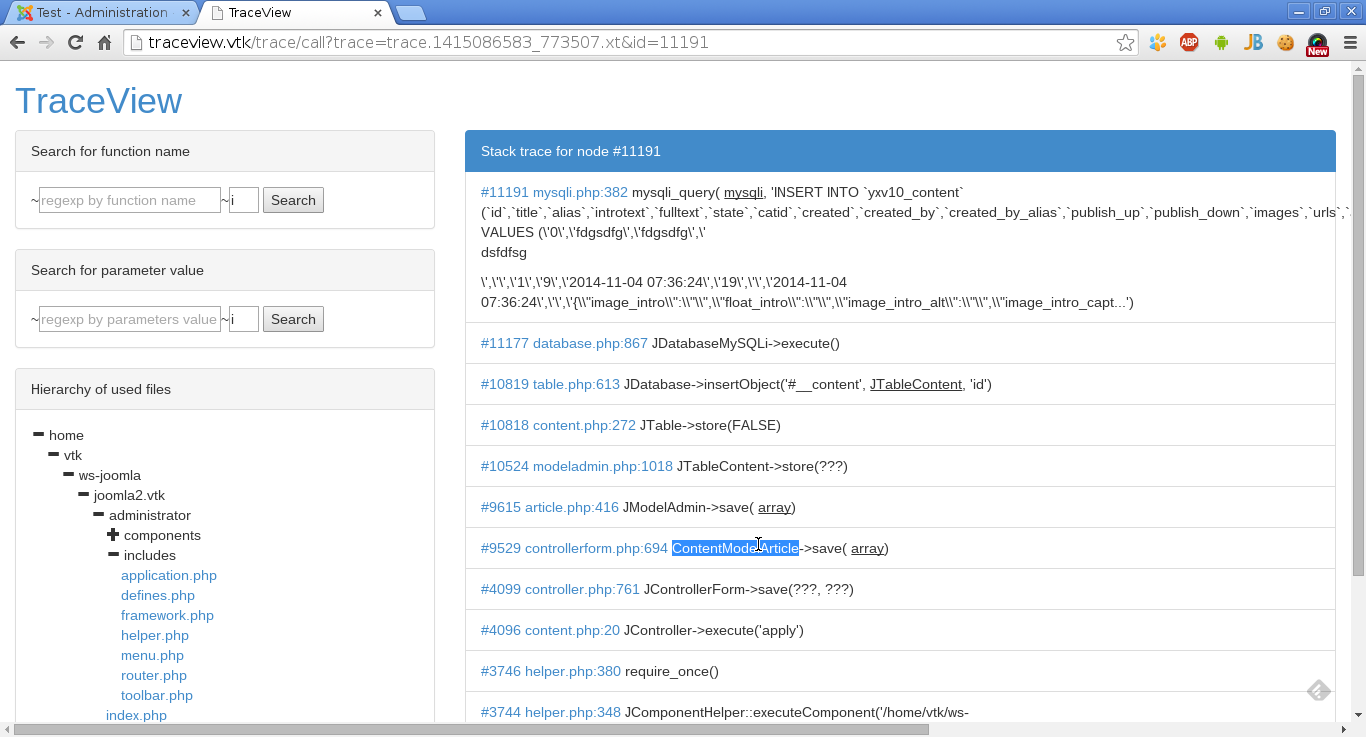
The call to ContentModelArticle-> save () appears in the received stacktrace. Will it be possible to use this class in its extension? This is a completely different story. Nevertheless, this is already a good clue.
There are many tricks to dive into someone else's code. You can use var_dump (), for which you will have to run the same script many times. You can configure the debugger, but then you will have to enter (Step Into) many functions that are not relevant to what you are looking for, and if you miss (Step Over) some important call, you will have to start all over again. Modern IDEs provide good means of static code analysis, but with their support it can be difficult to understand what happens at runtime.
For a long time, I was attracted to the xdebug trace capabilities, but manually tracking something in a multi-megabyte log is completely unrealistic, and I did not find any intelligible GUI for * .xt files. Therefore, I decided to write my own visualizer, which I want to talk about.
Maybe I was looking badly and wasting my time on my own bike. If you know a good GUI for xdebug traces, then you can not read further, just do not forget to leave a link in the comments. I wrote my GUI in php as a web project. Ideally, this should be a plugin for PHPStorm, Eclipse, or another IDE, but I would not have mastered it. Immediately share the link to the source: github.com/vtk13/xdebug-trace-viewer . The GUI is quite resource intensive, so no online demo is provided. You will have to install it on your server if you want to try it live.
Here I will tell you what you can learn from the course on the example of Joomla. Suppose that you already know what xdebug is and how xdebug tracing differs from profiling . Otherwise, why do you need a similar GUI? Here are the recommended values for ini parameters:
- xdebug.auto_trace = "0" - I think it’s worth turning off the tracing of all scripts in a row so as not to clutter up the folder with trace files very much.
- xdebug.trace_enable_trigger = "1" - with this option you can only trace requests that interest you using the GET parameter XDEBUG_TRACE = 1
- xdebug.trace_output_dir = "..." - as you wish
- xdebug.collect_assignments = "0" - in case of "1" xdebug has a segmetation fault.
- xdebug.trace_format = "1" is the only parameter that must be set for xdebug to create trace files in CSV format.
- xdebug.collect_params = "3" - for more information, I advise you to write parameter values to the log. If the GUI does not cope with the trace file, you should first reduce xdebug.var_display_max_data, xdebug.var_display_max_depth, xdebug.var_display_max_children, and if this does not help, then set xdebug.collect_params = "0". In my experience, the GUI can handle dozens of megabyte trace files.
So, let's say you write your extension for Joomla, which is supposed to create new articles and want to know how article creation works in Joomla. First, get the trace file. In the joomla admin panel, add & XDEBUG_TRACE = 1 in the action of the article creation form:
After creating the article in xdebug.trace_output_dir, you should get a * .xt file, which should also appear on the GUI main page:
Once we analyze the creation of the article, but it’s probably worth starting the study with mysql functions. We select the desired trace file and look for “mysql” by the names of the executed functions:
In our example, in the results there are two places with the mysqli_query () function call: mysqli.php: 123 and mysqli.php: 382. Each of the calls can be executed many times during the execution of the script, but in this case only information about the lines that are executed is displayed. I must say right away that one of the calls (in the mysqli.php file line 123) is executed only once upon connection and is not of interest. But the second search result - “mysqli.php: 382 mysqli_query ()” - is more interesting.
Using the link "mysqli.php: 382" in the search results, you can proceed to display the source code:
In the source code, the lines that were executed are highlighted. It is worth saying that not all executed lines are highlighted. Xdebug writes only calls to functions to trace, therefore strings, for example, with assignment of variables are absent in the trace file, and therefore they are not highlighted in the GUI.
A small menu is attached to each executed line, accessible by clicking on the line number:
In our example, I am interested in all calls to the mysqli_query () function, for which I need to click on the “View all calls” link in the 382nd line menu. In the list of all calls to the mysqli_query function, you can find 2 calls with an INSERT request:
Just two INSERTs for creating an article does not look bad - in the worst case, your plug-in will be able to create an article directly in the database if you can’t find any internal API for this. But it’s too early to despair. Using the link # 11191 in the line with INSERT, you can open stacktrace for this call (the numbers in the link are not of particular interest, this is the id of the function call from the * .tx file):
The call to ContentModelArticle-> save () appears in the received stacktrace. Will it be possible to use this class in its extension? This is a completely different story. Nevertheless, this is already a good clue.