How we reworked bad prediction for a little more good (continued)
In the last article I described how for the purposes of forecasting revenue, people built a large and complex excel file ( you can read here ). We decided to intervene in this shame and offered to alter the forecast model so that there were fewer errors, easier operation, flexibility in customization.
What are the key problems in the described model:
- Data, model and views are mixed into one entity. Because of this, a change in at least one of the elements destroys this whole monolith.
- Excessive manual processing, which produces errors and typos in huge quantities.
What we suggested:
- In the initial model, the initial data on which it was built did not appear anywhere. We offered to enter this data in the format of the 2nd normal form into the Excel file itself on 2 separate sheets (sales and number of customers). Fortunately, the sales data in our aggregation by months is just tens of thousands of rows, not millions. We also configured to get this data using Power Query directly from the database.
- We have created a simulation sheet, which consists of 3 blocks:
- Revenue summary table
- Summary table of clients
- Calculated table of average checks
Each summary is a summary table built on the source data in the necessary for the current modeling detailing by departments and divisions, in the necessary detailing by periods (months).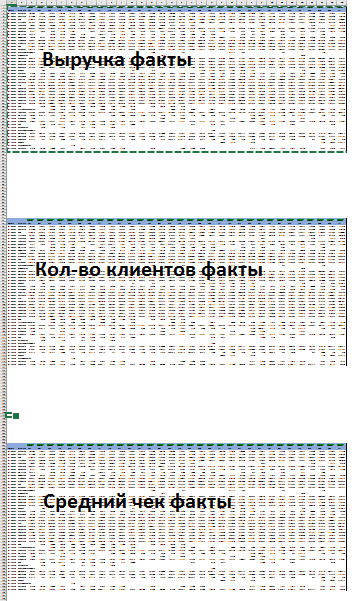
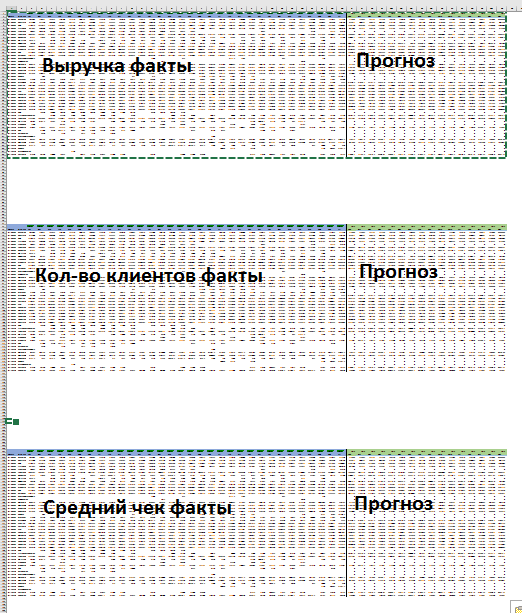
- In the Modeling Sheet, we built simple forecasting models based on historical time series. We extended the number of clients and the average bill, and the total projected revenue was considered as the product of these values. After reviewing the data, we came up with 3 prediction models: the median for past periods, exponential triple smoothing and zeroing (when we need 0 prediction).
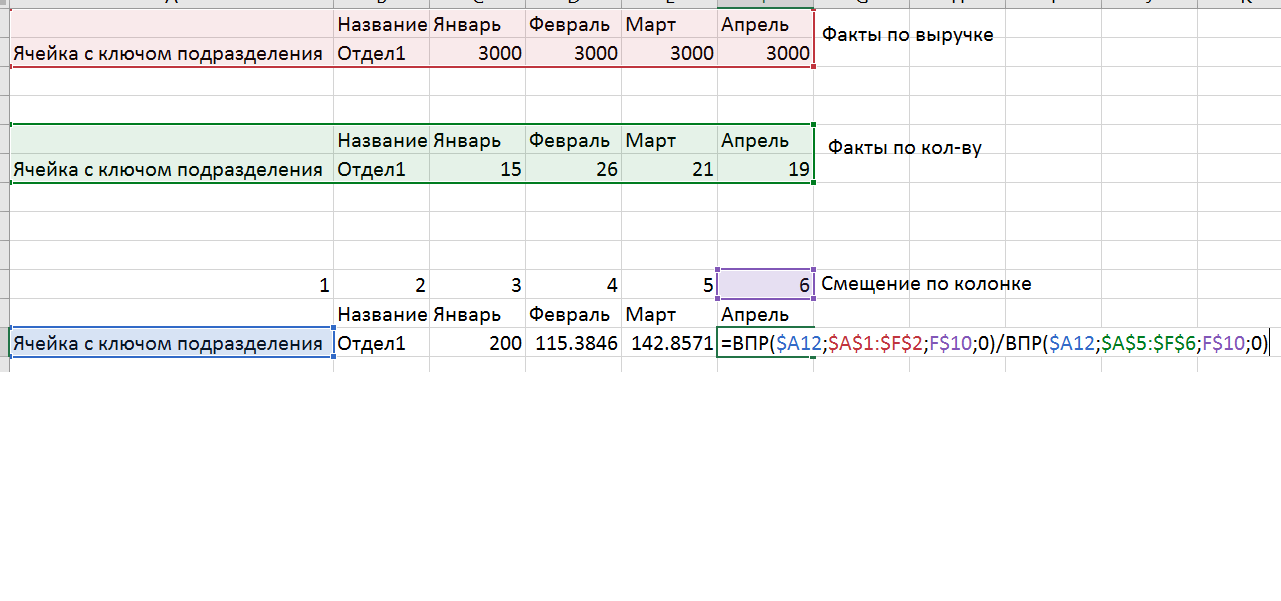
- Calculations of the average check (fact) and revenue (forecast) are not made by reference to the cells, but by using the CDF and the offset mark, which makes the calculations resistant to changes in the source data.
- It is clear that now the model is not readable by the user, because there are too many meanings. For this we have built separate sheets of units. Each sheet has a cell that selects which data should be added to this sheet. Based on the CDF, we pull the data from the model sheet into the sheet.
- The very creation of 30 sheets by divisions is done by a special procedure. First, create the first sheet of one of the divisions, which contains all the possible names of departments. If there is no department in the subdivision, then the formulas pull in there 0. To make all 30 subdivisions, we create duplicates and change the names in the control cell (it is used to generate the control key) and we have the necessary data in the form of a representation. VPR can use more than 1 cell as a key if you use a trick: combine the cells you need into one using concatenation (the CLUTCH function or the & symbol).
- An element has been added to the presentation form that allows you to manage the model: a simple factor to the predicted values of the average check and quantity. This element is collected on a special technical sheet with the help of the FEDEX function, which allows you to use the generated link. From this technical sheet, all these adjustments are transferred to the model sheet using the CDF.

- Generalization sheets are no longer a summation of presentation sheets, but are constructed in the same way as all other sheets by summing up data on a sheet with a model. As a result, representations are pure representations and do not have dependencies among themselves.
What we got:
- It is always clear from which numbers we received the data (as the power Query query was saved).
- We can change the data without breaking the model.
- Changes in the structure and hierarchy will require minor modifications (you only need to change the names in 1 presentation sheet and then make duplicates of it).
- We have drastically reduced the number of potential errors, because Most of the data is filled with formulas, links and keys.
- The customer received an interactive forecast in which he can change the values himself and immediately receive the forecast.
- We were able to simultaneously satisfy the requirements that we need data both in annual and monthly terms.
- Can be used in the next budget period.
- You can change the forecasting model, if these seem to us not suitable.
Why did we decide to stay in Excel instead of redoing it into some other technology?
- We needed to leave this file in operation with current employees. In Excel, it's easier for us to show how it all works and what they can fix.
- Excel does the job and other solutions are redundant entities.
- The customer is accustomed to this form and his "retraining" individual labor costs, which we could not afford.
How much time it took us: about 5 working days, where 1 person spent 2-4 hours a day and at the end of the day we did a review of the results with him.