A small estimate of the effect of cache levels on I / O performance in the EMC VNXe3200
Introduction
Recently and not for long, the VNXe3200 data storage system (SHD), which was announced by EMC 2 for customers on May 5, 2014, fell into my hands . The VNXe3200 is EMC 2's second generation entry-level Unified Storage . In this model, technologies have appeared previously available only on older and more expensive midrange arrays. In particular, FastCache technology - i.e. cache of the second level on SSD disks, which stands in the gap between the traditional cache in the RAM of the storage controller (in EMC terminology - Storage Processor) and the disks themselves. I decided to test how this technology affects the I / O performance of the youngest EMC 2 storage systems .
Unlike older EMC VNX storage systems, in this model both block and file access are implemented on the same controllers (SP). The storage system in the database has for each SP 4 copper ports 10Gbit / s (10GBASE-T), through which clients / hosts are connected via CIFS / SMB, NFS and iSCSI protocols. These ports are with autonegotiation 10G / 1G / 100Mb per second. Additionally, in each SP, you can put a board on 4 8Gb / s FC ports. It was decided to test using IOMETER. This article was helped, among other things, by this article from Habr: link .
Description of the stand and tests
I didn’t get smart with the load profile, I took the standard Database pattern (Intel / StorageReview.com).
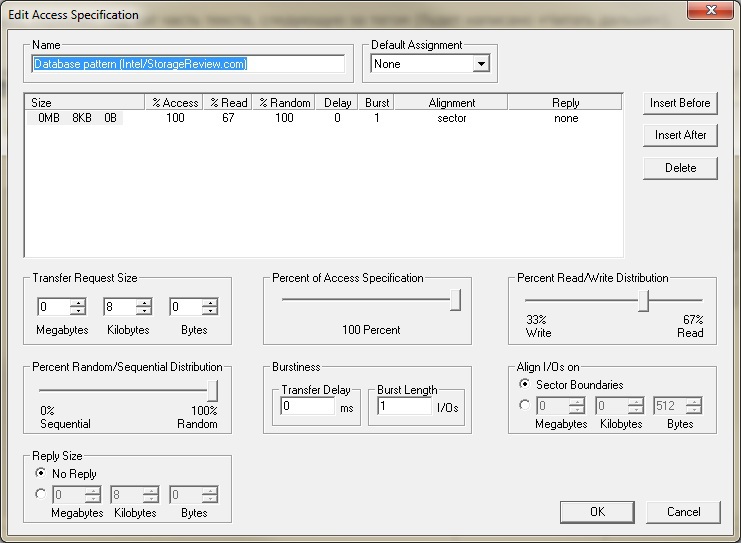
For testing, we took the Blade BL460c G7 server (one CPU of 6 cores + HT, 24GB of RAM), connected via FC to the storage system through the built-in FC blade switches with 4Gbit / s ports. OS Windows 2012 R2 was installed on the server with FC boot from VNXe3200 (boot from SAN). A test volume (LUN) of 1Tb in size with the NTFS file system was also connected to the server, also via FC. A storage pool of 10 disks (SAS 2.5 "10k RPM 600Gb) with two private RAID groups (RG) inside, which have the Raid5 (4 + 1) configuration, is also assembled on the storage system. Also on the array of their two SSD disks (2.5 "100Gb) assembled by FastCache (mirror pair Raid1).
Testing was carried out in three stages.
1) Using IOMETER, a small test file of 2Gb in size is created, in the calculation that it will completely fit in Cache SP on the storage.
2) The previous test file was deleted and a test file of ~ 50Gb in size is created, assuming that it will not fit in Cache SP, but will go fully into FastCache.
3) The previous test file was deleted and a test file of ~ 500Gb in size is created, assuming that it does not fit into any of the caches and with 100% random access will practically give the performance of the existing spindle drives.
The tests were set up so that before each pass there was a “warm-up” of 10 minutes, then a test of 20 minutes. Each test was performed with an exponential increase in input / output flows (1-2-4-8-16) for each of the 12 workers (6 cores + HT). At the same time, in addition to the actually issued IOPS storage systems, it was interesting to have a comfortable average response time of <10 milliseconds (ms). I’ll make a reservation right away that I will provide “pictures” with graphs from the VNXe3200 interface, but the quantitative indicators on them coincide with the results in the IOMETER csv files, which will be given by links.
Further a few calculations.
If you do not take into account the effect of cache on I / O, then for SAS 10k drives, EMC suggests 150 IOPS per drive. In total, on the backend with 10 disks, we should get 150 * 10 = 1500 IOPS. If we take into account our r / w load of 67% / 33% and the loss of working with CRC in Raid5, we get the following equation with one unknown. 1500 = X * 0.33 * 4 + X * 0.67, where X is our IOPS that will receive hosts from our drives. A 4 is the penalty shootout for Raid5. That is, in Raid5, to perform one write operation coming from the host, 4 I / O operations on the backend (on the storage drives) are required. For Raid1 / Raid10 the penalty value is 2, for Raid6 it is 6. As a result, we get X = 1500 / 1.99 = ~ 750 IOPS. In practice, I noticed that the maximum values achieved are 1.5-2 times more than the calculated ones. So at peak load we can get 1125-1500 IOPS from our 10 SAS drives.
Let's move on to the tests and their results.
Test 1
As expected, the test file almost completely fit in cache SP.

During testing, we got the following picture on IOPS and hit I / O requests in the cache. Here it is necessary to make a reservation that this graph actually shows all the IOs passing through the SP. Some of them are processed from SP cache (hit), some of them “fly” SP cache through (miss) and are processed either from FastCache or from spindle SAS disks.
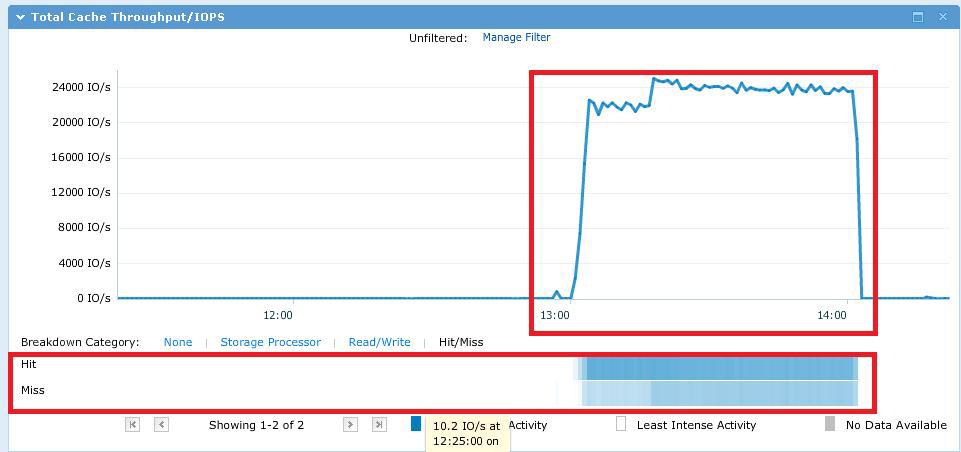
The average response time with the maximum number of threads in IOMETER (12 workers * 16 threads IO = 192 I / O streams) was ~ 8 ms. IOMETER results file here . The first test was conducted with an increase in the number of threads per worker from 4 to 32 (4-8-16-32). I noticed late what I repent of, but there was no time to redo it.
Test 2
During the test, the ~ 50GB test file almost completely fit into FastCache, as expected.
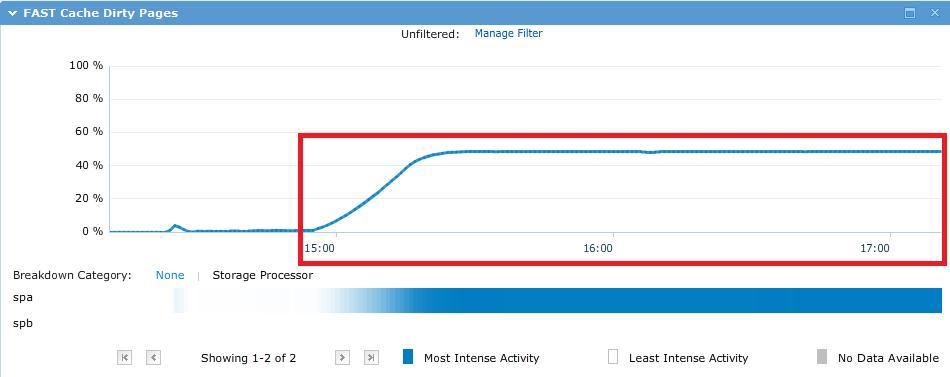
The result is the following picture, which shows that almost all requests fly past the SP cache.

The average response time on 192 threads was ~ 12.5 ms. A comfortable response time was on 8 threads for worker ~ 8 ms (96 IO threads). IOMETER results file here .
Test 3
During the test, I / O randomly “ran” over all ~ 500Gb and not a single cache in theory could help here, which is evident in practice from the graphs below.
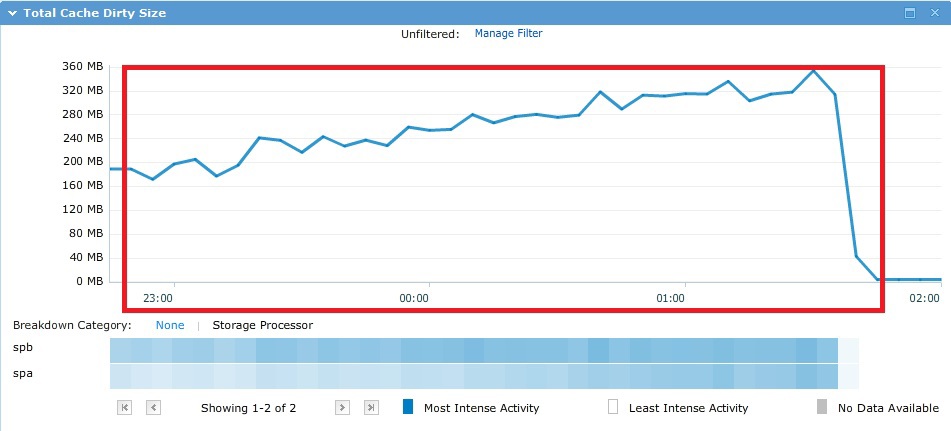
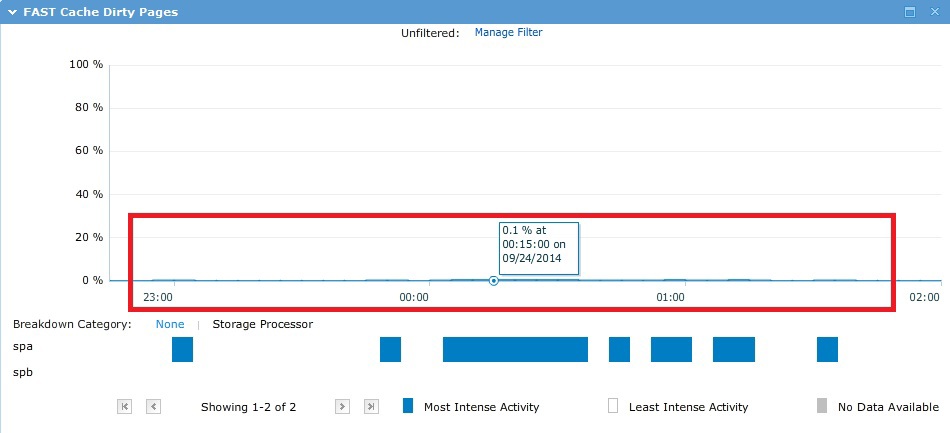
As a result, as planned, 10 SAS spindles in Raid5 got the performance. In this case, the first 4 in the storage drive used in the pool is the so-called VaultPack. That is, part of these first drives (~ 82.5 GB each) is “cut off” for system needs.
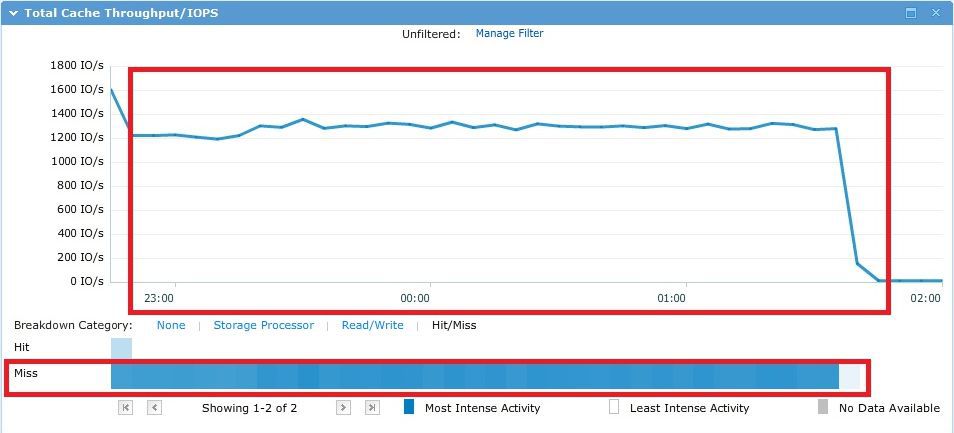
The average response time on 192 streams was quite large and amounted to ~ 149 ms. A comfortable response time was at 1 thread per worker (12 IO threads) ~ 10 ms. IOMETER results file here .
A small digression about pools
When designing a disk pool, if you do not know the actual size of the hot and warm data area, EMC recommends that you keep the following proportions for the three-level pool:
10% - SSD disks
20% - SAS disks
70% - NL-SAS disks
In addition Please note that when adding flash tier to the pool automatically all metadata of thin moons created in the pool will be placed on the SSD. If there is enough space for them. This allows you to raise the overall performance of thin moons and pool. Under this metadata, you need to plan additional space on the SSD based on the 3Gb volume for each 1Tb really occupied by thin moons on the pool. With all this, moons with a tiling policy of "highest available tier" will have priority when placed on an SSD dash over any other data.
Using the "lowest available tier" policy for thin moons results in placing their metadata on the slowest disks.
Summary
Testing showed that all Cache types in the storage system as a whole have a positive effect not only on the overall performance of the array. But also for the average response time of I / O operations, especially under high load. And taking into account the above, the “hottest” data will just get into the cache.
We can conclude that FastCache in the EMC VNXe3200 will be a very successful and popular addition even with small configurations. Considering that the process of its “warming up” (data getting into the cache) is fast enough.