RenderDoc - a graphical debugger for DirectX11 from Crytek
- Tutorial
As you may know in the Windows world, DirectX is often used for drawing graphics. In the latest versions (10, 11.x) the library has taken a serious step forward and it is on them that the engines of many modern games are built. In addition, DirectX is used not only in games - the Windows OS interface itself, too, I don’t remember which version (Vista?) Is drawn through it, and it would seem that they are not very related to the graphics of the program, wishing to increase the performance and smoothness of the zoom / scroll switch to latest versions of DirectX. So some time ago, Google Chrome rendered to DirectX11 (it seems to be from version 36).
Once in the days of Windows 95 and Pentium II, there was such a joke that the slower the computer — the better you can understand the operation of the operating system — the naked eye can see in which order window elements are drawn, events are processed. Today, there are separate tools for DirectX for such purposes - graphical debuggers that allow you to understand how each pixel of each frame is drawn, what operations the DirectX engine performs, what resources it uses, how quickly and correctly everything works. One of such tools - RenderDoc from Crytek we will consider today. And as an example, let’s take a look at the new Google Chrome renderer already mentioned above.

First of all, why am I talking about RenderDoc? There are many similar tools:
All of them are very good. But:
As for the RenderDoc, this is:
So, download RenderDoc , install. We start, we see the main window. Open the menu Tools-> Options and specify the folder in which temporary files (dumps) will be added.

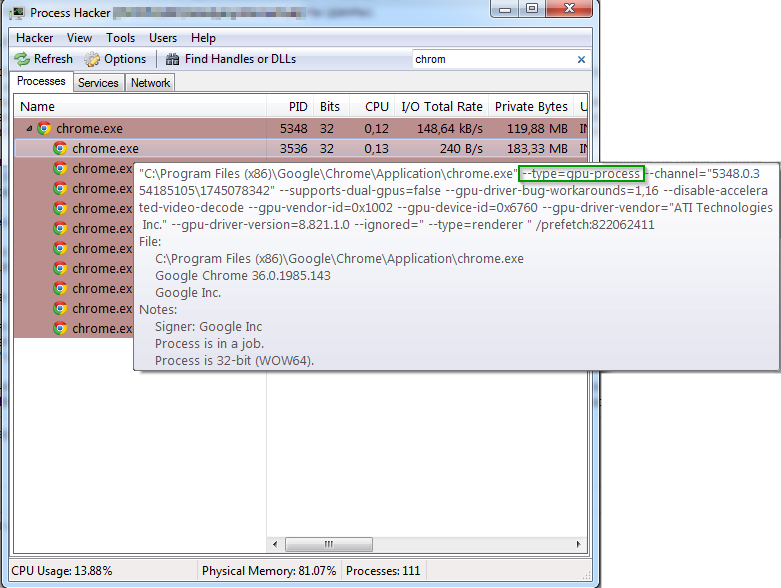
Now we need to run the application that we want to debug under the RenderDoc debugger. To do this, on the tab " Capture Executable " enter the path to Chrome, its working folder. There are some interesting points here. The graphics in Chrome are drawn in a separate child process, it can be determined by running Process Hacker and finding among all running chrome.exe processes one that has the flag --type = gpu-process among the command line parameters .
We cannot start this process directly, so we must start the main Chrome process, indicating in RenderDoc that we want to track calls to DirectX functions, including among child processes ( Hook Into Children checkbox )
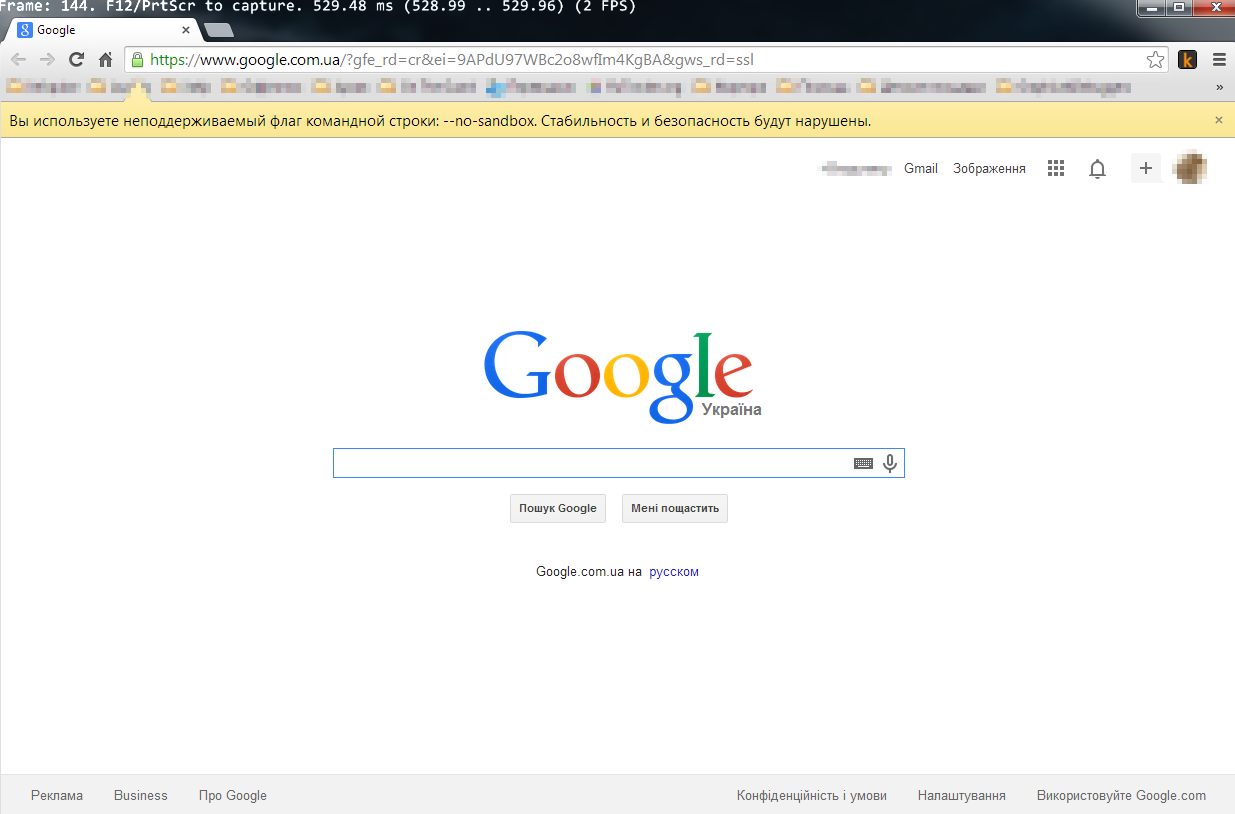
By default, Chrome child processes “live” in the sandbox - have a low Integrity Level, which prevents their interaction with the file system, other processes and shared resources of the OS. Thus, if we just run Chrome, then RenderDoc will not be able to interact with the process in which the graphics are drawn. There is a hack for this - Chrome needs to be launched with a special flag --no-sandbox , which disables the sandbox of Chrome.
Since we are interested in everything that happens during the drawing of graphics, we include more different useful checkmarks. We can also immediately indicate which frame we want to capture (for this there is a Queue Capture Of Frame # checkmark ), or we can already click on the PrintScreen button in the application to create a dump for the current frame.
As a result, the Capture Executable tab will look like this like this:

Click the Capture button, Chrome starts.
In the upper part of the window we see some kind of debugging information that tells us at least a few things:
Now you can open something in Chrome and click PrintScreen. An inscription about the screenshot taken will appear at the top of the Chrome window. Everything, Chrome can be closed, and in the folder that you specified in the settings, a file with the rdc extension should appear. This is our dump. We open it through " File-> Open Log " and see something like this:

In the upper part of the window there is a "timeline" - a time line on which the stages of drawing this frame are marked. There can be up to several dozen (if you do not see them, click on the plus sign in the upper left corner of the “Timeline” window). The same steps are marked in the " Event Browser " panel on the left side of the window. By clicking on the timeline or events in the "Event Browser" we can go to different points in the course of drawing a frame.
The root node of the event tree is called " Frame #N " and shows which frame it is from when DirectX was initialized in the application. This is followed by the “ Frame start ” meta-node indicating the moment the drawing of this frame started (no real calls to DirectX methods are attached to it). Next, we see three nodes: " Color Pass # 1 (1 Targets) ", " Draw (4) " and " Present () ". From this we can understand that all the drawing of the contents of the chrome window takes place in several stages:
As you can see, the stage of drawing into an intermediate texture in the tree can be opened and we will see the moments of drawing individual elements of the Chrome window.
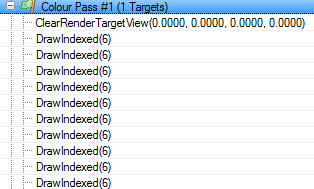
First, the texture is cleared (calling ClearRenderTargetView ). This is followed by many steps called " DrawIndexed (6) ". 6 is the number of points bounding the area drawn at this stage. The fact that there are 6 of them suggests the idea that these are 2 triangles that make up the rectangle. Let's choose one of the stages " DrawIndexed (6) " (not the first, but not the last) and take a closer look at it.
Let's start with the “ Pipeline State ” tab.

As you may know, DirectX11 uses the concept of “ Pipeline State ”"- this is a set of several sequential operations designed to form the final frame. The pipeline starts from the Input Assembler stage - here we provide all the necessary input data for vertex, index and constant buffers, which may later be needed to calculate what and where to draw Next, the stages of processing the input data by various types of shaders and the last phase - Output Merger , in which the graphics are compiled and displayed where it should be output, follow .
In the Pipeline State window, we can click Be at any stage of the pipeline and see:
Going to the texture window, we can see the textures used when drawing this frame:

In the toolbar " PS Resources " we see the texture (s) that will be drawn at this stage, and in the toolbar " OM Targets"- the texture where the rendering will take place. Remaining in the texture window, you can click on the drawing stages from the top or left - and we will see that Chrome draws its window with 256x256 pixels textures. It starts from the bottom of the window, then draws the side edges and then - the title bar of the window with toolbars. After that, Chrome starts drawing the contents of the tab (again, pieces of 256x256 pixels). Then objects lying “on top” of the content are drawn - video, flash banners, tooltips. In the last stages, a scrollbar and its slider are drawn Now the texture is ready for drawing in the backbuffer.
Show API of called DirectX methods for each stage of rendering
An incredibly useful thing. And given that not only the names of the methods are visible, but also their parameters - this is generally beauty.
Show kolstek (from where this or that DirectX method was called in the code)
True, for this you need to palm off a pdb-file to the program (which you only have if you yourself are the author of the debugged code). Very useful for debugging your programs, completely useless for analyzing strangers.
Debug shaders
For vertex shaders, debugging starts in the Mesh Output window with a right-click on the vertex of interest.

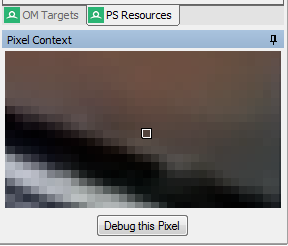
For pixels - in the texture window, where you need to right-click on the pixel of interest and click on the " Pixel Content " toolbar"Button" the Debug the this Pixel "
Here's a useful tool RenderDoc.
Good luck with your graphics debugging.
Once in the days of Windows 95 and Pentium II, there was such a joke that the slower the computer — the better you can understand the operation of the operating system — the naked eye can see in which order window elements are drawn, events are processed. Today, there are separate tools for DirectX for such purposes - graphical debuggers that allow you to understand how each pixel of each frame is drawn, what operations the DirectX engine performs, what resources it uses, how quickly and correctly everything works. One of such tools - RenderDoc from Crytek we will consider today. And as an example, let’s take a look at the new Google Chrome renderer already mentioned above.
First of all, why am I talking about RenderDoc? There are many similar tools:
- Pix
- Intel Graphics Performance Analyzers
- AMD GPU PerfStudio 2
- NVIDIA Nsight Development Platform
- Visual Studio Graphics Diagnostics tools
All of them are very good. But:
- PIX - already outdated, does not develop and does not work on the latest OS
- tools from Intel \ AMD \ Nvidia - made in the spirit of “these utilities can see how awesomely cool and fast DirectX works on our video cards”, while it’s not very convenient to do some applied, routine debugging tasks in them
- Visual Studio - tailored specifically for the development of its software, rather than analyzing someone else's
As for the RenderDoc, this is:
- opensource , is actively developing
- sharpened on the latest versions of Windows and DirectX11
- a product from 3D development professionals - the company that created the CryEngine engine with all the accompanying strapping
- it’s saturated with a practical approach to development and debugging - I don’t know how to better explain it, but for example, when you just think that “hmm, it would be nice to see this information in such and such form in this call”, it suddenly turns out that RenderDoc shows exactly this information, in this particular call and in the right form. It can be seen that the instrument lives and is polished in the hands of Crytek.
- in general, the only product that I realized from me is that I want to debug graphics rendering in a Chrome child process launched from the parent, in which there is no graphics at all. It would seem that the launcher is the simplest thing, used in many games, but only RenderDoc has reached the point of having to support it in the debugger.
So, download RenderDoc , install. We start, we see the main window. Open the menu Tools-> Options and specify the folder in which temporary files (dumps) will be added.
Now we need to run the application that we want to debug under the RenderDoc debugger. To do this, on the tab " Capture Executable " enter the path to Chrome, its working folder. There are some interesting points here. The graphics in Chrome are drawn in a separate child process, it can be determined by running Process Hacker and finding among all running chrome.exe processes one that has the flag --type = gpu-process among the command line parameters .
We cannot start this process directly, so we must start the main Chrome process, indicating in RenderDoc that we want to track calls to DirectX functions, including among child processes ( Hook Into Children checkbox )
By default, Chrome child processes “live” in the sandbox - have a low Integrity Level, which prevents their interaction with the file system, other processes and shared resources of the OS. Thus, if we just run Chrome, then RenderDoc will not be able to interact with the process in which the graphics are drawn. There is a hack for this - Chrome needs to be launched with a special flag --no-sandbox , which disables the sandbox of Chrome.
Since we are interested in everything that happens during the drawing of graphics, we include more different useful checkmarks. We can also immediately indicate which frame we want to capture (for this there is a Queue Capture Of Frame # checkmark ), or we can already click on the PrintScreen button in the application to create a dump for the current frame.
As a result, the Capture Executable tab will look like this like this:
Click the Capture button, Chrome starts.
In the upper part of the window we see some kind of debugging information that tells us at least a few things:
- Chrome really uses DirectX11 to draw its window (and the whole window: the title, toolbars and page content)
- RenderDoc successfully "hooked" to Chrome
Now you can open something in Chrome and click PrintScreen. An inscription about the screenshot taken will appear at the top of the Chrome window. Everything, Chrome can be closed, and in the folder that you specified in the settings, a file with the rdc extension should appear. This is our dump. We open it through " File-> Open Log " and see something like this:
In the upper part of the window there is a "timeline" - a time line on which the stages of drawing this frame are marked. There can be up to several dozen (if you do not see them, click on the plus sign in the upper left corner of the “Timeline” window). The same steps are marked in the " Event Browser " panel on the left side of the window. By clicking on the timeline or events in the "Event Browser" we can go to different points in the course of drawing a frame.
The root node of the event tree is called " Frame #N " and shows which frame it is from when DirectX was initialized in the application. This is followed by the “ Frame start ” meta-node indicating the moment the drawing of this frame started (no real calls to DirectX methods are attached to it). Next, we see three nodes: " Color Pass # 1 (1 Targets) ", " Draw (4) " and " Present () ". From this we can understand that all the drawing of the contents of the chrome window takes place in several stages:
- First, everything is drawn into a kind of intermediate texture (stage " Color Pass # 1 (1 Targets) ")
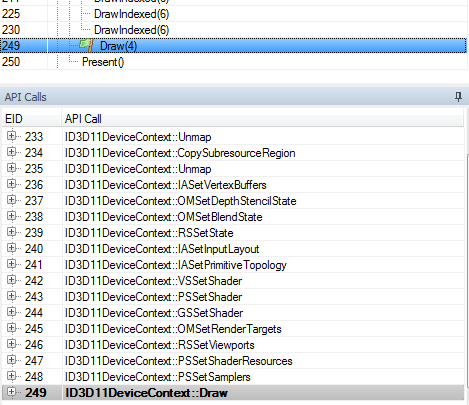
- Then calling the " Draw (4) " method transfers the contents of this texture to the Swap Chain Backbuffer
- Finally, the Present method causes the backbuffer to be displayed on the screen.
As you can see, the stage of drawing into an intermediate texture in the tree can be opened and we will see the moments of drawing individual elements of the Chrome window.
First, the texture is cleared (calling ClearRenderTargetView ). This is followed by many steps called " DrawIndexed (6) ". 6 is the number of points bounding the area drawn at this stage. The fact that there are 6 of them suggests the idea that these are 2 triangles that make up the rectangle. Let's choose one of the stages " DrawIndexed (6) " (not the first, but not the last) and take a closer look at it.
Let's start with the “ Pipeline State ” tab.
As you may know, DirectX11 uses the concept of “ Pipeline State ”"- this is a set of several sequential operations designed to form the final frame. The pipeline starts from the Input Assembler stage - here we provide all the necessary input data for vertex, index and constant buffers, which may later be needed to calculate what and where to draw Next, the stages of processing the input data by various types of shaders and the last phase - Output Merger , in which the graphics are compiled and displayed where it should be output, follow .
In the Pipeline State window, we can click Be at any stage of the pipeline and see:
- What came to the input stage (buffer, shader, texture), general information about this object
- By clicking on the green arrow to the right of the input parameter we can open a window with more complete information. For the buffer, this is its full content; for the texture, its image; for the shader, its compiled bytecode.
- For the Input Assembler stage, we can also click on the large " Mesh " button and see the coordinates of the points that make up the area being drawn at this stage. Here you can again make sure that we are drawing exactly the rectangle.
Going to the texture window, we can see the textures used when drawing this frame:
In the toolbar " PS Resources " we see the texture (s) that will be drawn at this stage, and in the toolbar " OM Targets"- the texture where the rendering will take place. Remaining in the texture window, you can click on the drawing stages from the top or left - and we will see that Chrome draws its window with 256x256 pixels textures. It starts from the bottom of the window, then draws the side edges and then - the title bar of the window with toolbars. After that, Chrome starts drawing the contents of the tab (again, pieces of 256x256 pixels). Then objects lying “on top” of the content are drawn - video, flash banners, tooltips. In the last stages, a scrollbar and its slider are drawn Now the texture is ready for drawing in the backbuffer.
What else interesting can RenderDoc
Show API of called DirectX methods for each stage of rendering
An incredibly useful thing. And given that not only the names of the methods are visible, but also their parameters - this is generally beauty.
Show kolstek (from where this or that DirectX method was called in the code)
True, for this you need to palm off a pdb-file to the program (which you only have if you yourself are the author of the debugged code). Very useful for debugging your programs, completely useless for analyzing strangers.
Debug shaders
For vertex shaders, debugging starts in the Mesh Output window with a right-click on the vertex of interest.
For pixels - in the texture window, where you need to right-click on the pixel of interest and click on the " Pixel Content " toolbar"Button" the Debug the this Pixel "
Here's a useful tool RenderDoc.
Good luck with your graphics debugging.