See the invisible
- Tutorial
A couple of years ago two articles slipped on Habré, in which an interesting algorithm was mentioned. Articles, however, were unreadable. In the style of “news” ( 1 , 2 ), but there was a link to the site, it was possible to understand in detail on the spot (algorithm by MIT). And there was magic. Absolutely magical algorithm that allows you to see the invisible. Both authors on Habré did not notice this and focused on the fact that the algorithm allowed to see the pulse. Skipping the most important thing.
The algorithm made it possible to strengthen movements invisible to the eye, to show things that no one had ever seen alive. The video above is a presentation from the MIT website of the second part of the algorithm. Microsaccades, which are given starting from the 29th second, were previously observed only as reflections of mirrors mounted on the pupils. And here they are visible through the eyes.
A couple of weeks ago, I again came across those articles. I immediately became curious: what did the people do in these two years ready? But ... Emptiness. This determined the entertainment for the next week and a half. I want to make the same algorithm and figure out what can be done with it and why it is still not in every smartphone, at least for measuring heart rate.
The article will have a lot of matan, videos, pictures, a bit of code and answers to questions.
Let's start with mathematics (I will not adhere to any one specific article, but will interfere from different parts of different articles, for a smoother story). The research team has two main works on the algorithmic part:
1) Eulerian Video Magnification for Revealing Subtle Changes in the World ;
2) Phase-Based Video Motion Processing .
In the first work, the amplitude approach is implemented, which is coarser and faster. I took it as a basis. In the second work, in addition to the amplitude, the phase of the signal is used. This allows you to get a much more realistic and clear image. The video above was attached specifically to this work. Minus - a more complex algorithm and processing, obviously flying out of real time without using a video card.
What is motion enhancement? Strengthening movement is when we predict which direction the signal will mix and shift it further in this direction.

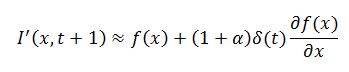
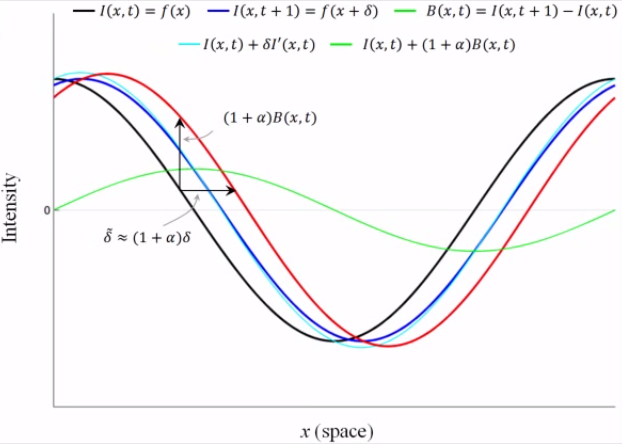
Suppose we have a one-dimensional receiver. At this receiver, we see the signal I (x, t) = f (x). The picture from is drawn in black (for some moment t). At the next moment in time, the signal I (x, t + 1) = f (x + Δ) (blue). To amplify this signal, it means to receive the signal I '(x, t + 1) = f (x + (1 + α) Δ). Here α is the gain. Putting it in a Taylor series it can be expressed as:
Let:
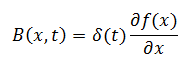
What is B? Roughly speaking, this is I (x, t + 1) - I (x, t). Let's draw:

Of course, this is inaccurate, but it will come down as a rough approximation (the blue graph shows the shape of such an “approximate” signal). If we multiply B by (1 + α) this will be the “amplification" of the signal. We get (red graph):
In real frames, there may be several movements, each of which will go at a different speed. The above method is a linear forecast, without breaking it will break off. But, there is a classical approach to solving this problem, which was used in the work - to decompose the movements in frequency characteristics (both spatial and temporal).
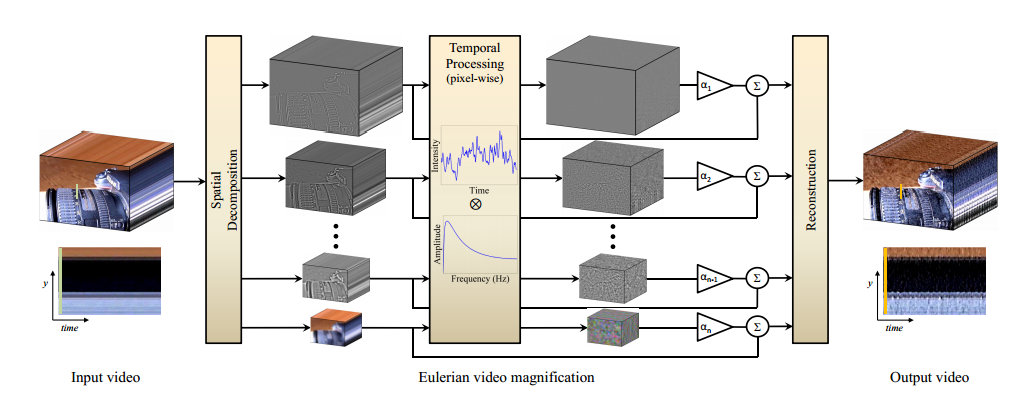
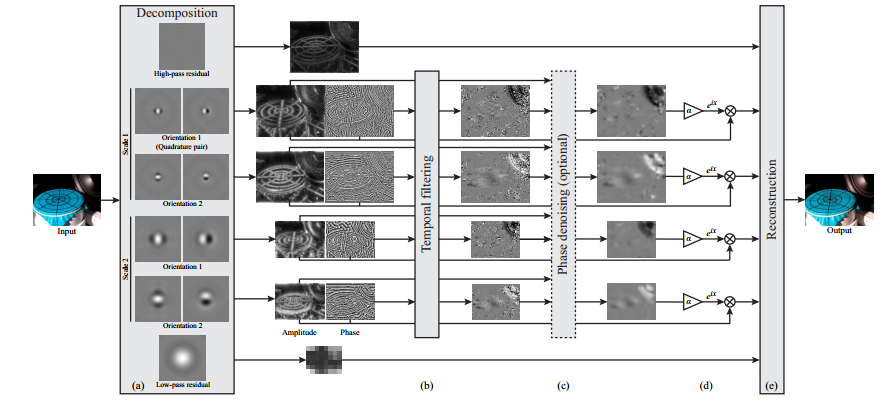
At the first stage, the image is decomposed into spatial frequencies. This stage, in addition, implements the derivation of the differential ∂f (x) / ∂x. The first work does not describe how they implement it. In the second work, when using the phase approach, the amplitude and phase were considered Gabbor filters of different orders: This is
what I did by taking the filter:
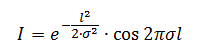
And normalizing its value so that

Here l is the distance of the pixel from the center of the filter. Of course, I cheated a little, taking such a filter for only one window value σ. This allowed to significantly speed up the calculation. This results in a slightly more blurry picture, but I decided not to strive for high accuracy.
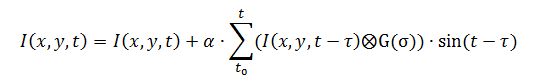
Back to the formulas. Suppose we want to amplify a signal that gives a characteristic response at the frequency ω in our time frame sequence. We have already selected a characteristic spatial filter with a σ window. This gives us an approximate differential at every point. As is clear from the formulas, only the time function remains, which gives a response to our motion and gain. We multiply by the sine of the frequency that we want to amplify (this will be the function that gives the time response). We get:
Of course, much easier than in the original article, but a little less problems with speed.
Sources for the first article are posted in open access on Matlab :. It would seem, why reinvent the wheel and write yourself? But there were a number of reasons, largely tied to Matlab:
I posted the sources on github.com and commented in sufficient detail. The program implements the capture of video from the camera and its analysis in real time. There was a bit of optimization with a margin, but you can achieve freezes by expanding the parameters. What is cropped in the name of optimization:
Little remark. All results were obtained on a conventional webcam at home. When using a camera with good parameters + tripod + proper lighting + suppression of 50 Hz interference, the quality will improve significantly. My goal was not to get a beautiful picture or an improved algorithm. The goal is to achieve a result at home. Well, as a bonus, I would also like to record the pulse when I play Starctaft 2 ... It is curious how e-sport is still a sport.
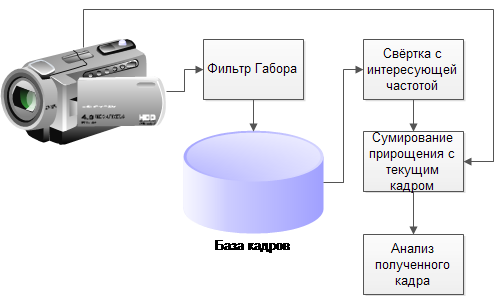
As a result, the logic of work is:
Everything is simple to disgrace. For example, summing the increment with a frame is generally implemented as follows:
(Yes, I know that with OpenCV this is not the best way).
Somewhere 90% of the code is not the core, I kit around it. But the implementation of the kernel gives a good result. You can see how the chest swells for a couple of tens of centimeters during breathing, you can see how the vein swells, how the head sways to the beat of the pulse.
Here it is explained in detail why the head sways from the pulse. In fact, this is the return on heart-stuffing:
Of course, MIT loves beautiful results. And, therefore, they try to make them as beautiful as possible. As a result, the beholder has the impression that this particularity is the whole. Unfortunately not. A swelling vein can only be seen with properly set lighting (the shadow should draw a skin pattern). Changing the complexion - only on a good camera without auto-correction, with the right light and a person who has obvious difficulties with the heart (in the video this is an overweight man and a premature baby). For example, in the example with a black man, with whom everything is fine with the heart, you do not see a fluctuation in the brightness of the skin, but an intensification of the change in shadow due to micromotion (the shadow lies neatly from top to bottom).
But still. The video clearly shows breathing and pulse. Let's try to get them. The simplest thing that comes to mind is the summed up difference between neighboring frames. Since almost the whole body oscillates during breathing, this characteristic should be noticeable.
Let’s drive the resulting graph through the Fourier transform, calculating the spectrum (statistics are collected on the graph for about 5 minutes by summing the spectrum calculated over 16-second segments).
A clear peak is visible at frequencies of 0.6-1.3, not characteristic of noise. Since breathing is not a sinusoidal process, but a process that has two obvious bursts (during inhalation-exhalation), the frequency of the difference picture should be equal to the double respiratory rate. My breathing rate was somewhere around 10 breaths in 30 seconds (0.3 HZ). Her doubling is 0.6HZ. Which is approximately equal to the detected spectrogram maximum. But, of course, there is no need to talk about the exact value. In addition to breathing, many fine motor skills of the body are stretched, which significantly spoils the picture.
There is an interesting peak at 2.625HZ. Apparently this is breaking through the tip of the power grid to the matrix. Stripes crawl along the matrix, which successfully give a maximum at this frequency.
By the way, the double heart rate should lie in approximately the same range, which means this method should not work on it. And indeed:

One cannot find a pulse in such a spectrum.
In one of MIT's works, another method for measuring heart rate is given: to calculate the optical flux on the face and determine it by the frequency of this flux. So I did (the spectra are also on the graph):

It is better seen on the graph on which I put the number of spectrum maxima:

Why the maximum at the pulse rate * 3, I don’t know how to explain, but this maximum is definitely connected with the pulse :)
I would like to note only that to get a pulse in this way you need to sit up straight and not move. When playing Starcraft, this is not possible, the frequency is not removed. Eh ... And such an idea! We’ll have to get a heart rate monitor, because now it’s become interesting!
As a result, I quite clearly formed my opinion about the boundaries of the algorithm, it became clear to me what limitations it had:
Why didn’t it become popular for measuring heart rate? The quality for the computer’s Web-cameras is enough at the border, or even not enough. Android obviously does not have enough performance. Special equipment for professional measurement remains. But they will be very expensive and unstable to external conditions (flare, flickering light, darkness, shaking), and the quality will be lower than that of proven pulse shooting devices.
Why is the algorithm not used to assess the fluctuations of houses, bridges, cranes? Yet again. Special equipment is cheaper and give greater accuracy.
But where can it be used and is it possible at all?I think it is possible. Everywhere where visibility is needed. Scientific videos, educational programs. Training of psychiatrists, psychologists,pick-up men (the smallest movements of a person are visible, facial expressions are amplified). To analyze the negotiations. Of course, in this case it is necessary to use not a simple version of the algorithm, but the version that they have in their last work and is based on the phase approach. At the same time, in real time it will be difficult to see all this, the performance will not be enough, except in parallel, to parallelize everything. But you can see after the fact.
When you read the work of your comrades and watch the video, suspicion creeps in. Somewhere I saw it all. You look and think, think. And then they show a video of using the same algorithm to take and stabilize the movement of the moon, removing atmospheric noise. And then it’s like a flash: “Yes, this is the noise reduction algorithm, only with positive feedback !!”. And instead of suppressing parasitic movements, it intensifies them. If we take α <0, then the connection is again negative and the movements go away!
Of course, the algorithms for suppressing motion and shaking have a slightly different math and a slightly different approach. But after all, essentially the exact same spectral analysis of the space-time tube.
Although it’s stupid to say that the algorithm hung here. MIT really noticed one small interesting feature, developed it and got a whole theory with such beautiful and magical pictures.
Judging by the marks on the site, the algorithm is patented. Use is permitted for educational purposes. Of course, in Russia there is no patenting of algorithms. But be careful if you do something based on it. Outside of Russia, this could become illegal.
A site about MIT research on traffic reinforcement ;
My source .
Z.Yu. And tell me the heart rate monitor, which could throw off the data on the computer and, preferably, what thread did the Android interface have?
The algorithm made it possible to strengthen movements invisible to the eye, to show things that no one had ever seen alive. The video above is a presentation from the MIT website of the second part of the algorithm. Microsaccades, which are given starting from the 29th second, were previously observed only as reflections of mirrors mounted on the pupils. And here they are visible through the eyes.
A couple of weeks ago, I again came across those articles. I immediately became curious: what did the people do in these two years ready? But ... Emptiness. This determined the entertainment for the next week and a half. I want to make the same algorithm and figure out what can be done with it and why it is still not in every smartphone, at least for measuring heart rate.
The article will have a lot of matan, videos, pictures, a bit of code and answers to questions.
Let's start with mathematics (I will not adhere to any one specific article, but will interfere from different parts of different articles, for a smoother story). The research team has two main works on the algorithmic part:
1) Eulerian Video Magnification for Revealing Subtle Changes in the World ;
2) Phase-Based Video Motion Processing .
In the first work, the amplitude approach is implemented, which is coarser and faster. I took it as a basis. In the second work, in addition to the amplitude, the phase of the signal is used. This allows you to get a much more realistic and clear image. The video above was attached specifically to this work. Minus - a more complex algorithm and processing, obviously flying out of real time without using a video card.
Let's start
What is motion enhancement? Strengthening movement is when we predict which direction the signal will mix and shift it further in this direction.
Suppose we have a one-dimensional receiver. At this receiver, we see the signal I (x, t) = f (x). The picture from is drawn in black (for some moment t). At the next moment in time, the signal I (x, t + 1) = f (x + Δ) (blue). To amplify this signal, it means to receive the signal I '(x, t + 1) = f (x + (1 + α) Δ). Here α is the gain. Putting it in a Taylor series it can be expressed as:
Let:
What is B? Roughly speaking, this is I (x, t + 1) - I (x, t). Let's draw:
Of course, this is inaccurate, but it will come down as a rough approximation (the blue graph shows the shape of such an “approximate” signal). If we multiply B by (1 + α) this will be the “amplification" of the signal. We get (red graph):
In real frames, there may be several movements, each of which will go at a different speed. The above method is a linear forecast, without breaking it will break off. But, there is a classical approach to solving this problem, which was used in the work - to decompose the movements in frequency characteristics (both spatial and temporal).
At the first stage, the image is decomposed into spatial frequencies. This stage, in addition, implements the derivation of the differential ∂f (x) / ∂x. The first work does not describe how they implement it. In the second work, when using the phase approach, the amplitude and phase were considered Gabbor filters of different orders: This is
what I did by taking the filter:
And normalizing its value so that
Here l is the distance of the pixel from the center of the filter. Of course, I cheated a little, taking such a filter for only one window value σ. This allowed to significantly speed up the calculation. This results in a slightly more blurry picture, but I decided not to strive for high accuracy.
Back to the formulas. Suppose we want to amplify a signal that gives a characteristic response at the frequency ω in our time frame sequence. We have already selected a characteristic spatial filter with a σ window. This gives us an approximate differential at every point. As is clear from the formulas, only the time function remains, which gives a response to our motion and gain. We multiply by the sine of the frequency that we want to amplify (this will be the function that gives the time response). We get:
Of course, much easier than in the original article, but a little less problems with speed.
Code and Result
Sources for the first article are posted in open access on Matlab :. It would seem, why reinvent the wheel and write yourself? But there were a number of reasons, largely tied to Matlab:
- If then it comes to mind to do something reasonable and applicable, the code on Matlab is much more difficult to use than C # + OpenCV, which is ported in a couple of hours in C ++.
- The original code focused on working with saved videos, which has a constant bitrate. To be able to work with cameras connected to a computer with a variable bitrate, you need to change the logic.
- The original code implemented the simplest of their algorithms, without any goodies. To implement a slightly more complicated version with buns is already half the work. In addition, despite the fact that the algorithm was original, the parameters on its input were not the same as in the articles.
- The original code periodically caused the computer to freeze (even without a blue screen). Maybe only with me, but it’s uncomfortable.
- In the original code, there was only console mode. To make everything visual in Matlab, which I know is much worse than VS, would be much longer than rewriting everything.
I posted the sources on github.com and commented in sufficient detail. The program implements the capture of video from the camera and its analysis in real time. There was a bit of optimization with a margin, but you can achieve freezes by expanding the parameters. What is cropped in the name of optimization:
- Use a frame with a reduced size. Significantly speeds up the work. The form size control did not appear on the form, but if you open the code, then the line: "_capture.QueryFrame (). Convert
- Use only one spatial filter. For a situation where the desired movement is known, the loss is uncritical. Control the filter parameter from the form (Gabor filter wavelength).
- The use of only one frequency, emphasizing the time series. Of course, it was possible to do a convolution with a pre-calculated window with a spectrum with almost no loss of performance, but this method also works well. From a form, it is controlled either by a slider or by entering limit values.
Little remark. All results were obtained on a conventional webcam at home. When using a camera with good parameters + tripod + proper lighting + suppression of 50 Hz interference, the quality will improve significantly. My goal was not to get a beautiful picture or an improved algorithm. The goal is to achieve a result at home. Well, as a bonus, I would also like to record the pulse when I play Starctaft 2 ... It is curious how e-sport is still a sport.
As a result, the logic of work is:
Everything is simple to disgrace. For example, summing the increment with a frame is generally implemented as follows:
for (int x = 0; x < Ic[ccp].I.Width; x++)
  for (int y = 0; y < Ic[ccp].I.Height; y++)
  {
      FF2.Data[y, x, 0] = Alpha * FF2.Data[y, x, 0] / counter;
      ImToDisp.Data[y, x, 0] = (byte)Math.Max(0, Math.Min((FF2.Data[y, x, 0] + ImToDisp.Data[y, x, 0]), 255));
   }
(Yes, I know that with OpenCV this is not the best way).
Somewhere 90% of the code is not the core, I kit around it. But the implementation of the kernel gives a good result. You can see how the chest swells for a couple of tens of centimeters during breathing, you can see how the vein swells, how the head sways to the beat of the pulse.
Here it is explained in detail why the head sways from the pulse. In fact, this is the return on heart-stuffing:
A little bit about beauty
Of course, MIT loves beautiful results. And, therefore, they try to make them as beautiful as possible. As a result, the beholder has the impression that this particularity is the whole. Unfortunately not. A swelling vein can only be seen with properly set lighting (the shadow should draw a skin pattern). Changing the complexion - only on a good camera without auto-correction, with the right light and a person who has obvious difficulties with the heart (in the video this is an overweight man and a premature baby). For example, in the example with a black man, with whom everything is fine with the heart, you do not see a fluctuation in the brightness of the skin, but an intensification of the change in shadow due to micromotion (the shadow lies neatly from top to bottom).
Quantitative characteristics
But still. The video clearly shows breathing and pulse. Let's try to get them. The simplest thing that comes to mind is the summed up difference between neighboring frames. Since almost the whole body oscillates during breathing, this characteristic should be noticeable.
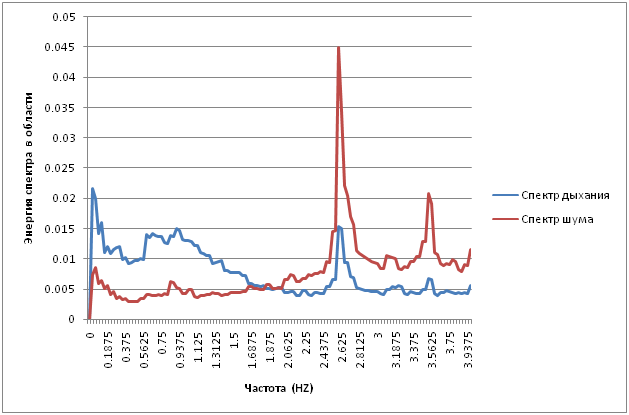
Let’s drive the resulting graph through the Fourier transform, calculating the spectrum (statistics are collected on the graph for about 5 minutes by summing the spectrum calculated over 16-second segments).
A clear peak is visible at frequencies of 0.6-1.3, not characteristic of noise. Since breathing is not a sinusoidal process, but a process that has two obvious bursts (during inhalation-exhalation), the frequency of the difference picture should be equal to the double respiratory rate. My breathing rate was somewhere around 10 breaths in 30 seconds (0.3 HZ). Her doubling is 0.6HZ. Which is approximately equal to the detected spectrogram maximum. But, of course, there is no need to talk about the exact value. In addition to breathing, many fine motor skills of the body are stretched, which significantly spoils the picture.
There is an interesting peak at 2.625HZ. Apparently this is breaking through the tip of the power grid to the matrix. Stripes crawl along the matrix, which successfully give a maximum at this frequency.
By the way, the double heart rate should lie in approximately the same range, which means this method should not work on it. And indeed:
One cannot find a pulse in such a spectrum.
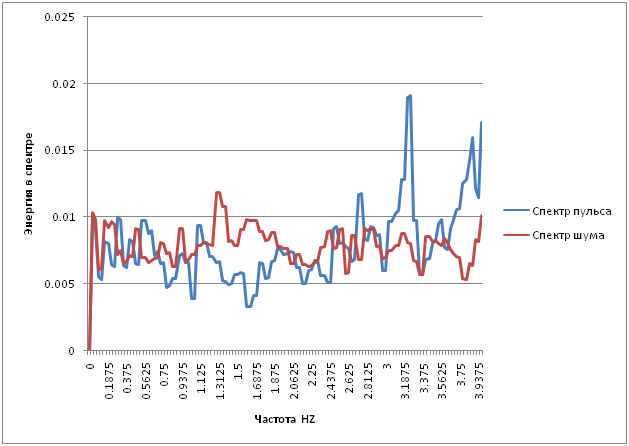
In one of MIT's works, another method for measuring heart rate is given: to calculate the optical flux on the face and determine it by the frequency of this flux. So I did (the spectra are also on the graph):
It is better seen on the graph on which I put the number of spectrum maxima:
Why the maximum at the pulse rate * 3, I don’t know how to explain, but this maximum is definitely connected with the pulse :)
I would like to note only that to get a pulse in this way you need to sit up straight and not move. When playing Starcraft, this is not possible, the frequency is not removed. Eh ... And such an idea! We’ll have to get a heart rate monitor, because now it’s become interesting!
So the result
As a result, I quite clearly formed my opinion about the boundaries of the algorithm, it became clear to me what limitations it had:
Why didn’t it become popular for measuring heart rate? The quality for the computer’s Web-cameras is enough at the border, or even not enough. Android obviously does not have enough performance. Special equipment for professional measurement remains. But they will be very expensive and unstable to external conditions (flare, flickering light, darkness, shaking), and the quality will be lower than that of proven pulse shooting devices.
Why is the algorithm not used to assess the fluctuations of houses, bridges, cranes? Yet again. Special equipment is cheaper and give greater accuracy.
But where can it be used and is it possible at all?I think it is possible. Everywhere where visibility is needed. Scientific videos, educational programs. Training of psychiatrists, psychologists,
Nothing is new under the moon
When you read the work of your comrades and watch the video, suspicion creeps in. Somewhere I saw it all. You look and think, think. And then they show a video of using the same algorithm to take and stabilize the movement of the moon, removing atmospheric noise. And then it’s like a flash: “Yes, this is the noise reduction algorithm, only with positive feedback !!”. And instead of suppressing parasitic movements, it intensifies them. If we take α <0, then the connection is again negative and the movements go away!
Of course, the algorithms for suppressing motion and shaking have a slightly different math and a slightly different approach. But after all, essentially the exact same spectral analysis of the space-time tube.
Although it’s stupid to say that the algorithm hung here. MIT really noticed one small interesting feature, developed it and got a whole theory with such beautiful and magical pictures.
And finally: a programmer, be careful!
Judging by the marks on the site, the algorithm is patented. Use is permitted for educational purposes. Of course, in Russia there is no patenting of algorithms. But be careful if you do something based on it. Outside of Russia, this could become illegal.
Basement
A site about MIT research on traffic reinforcement ;
My source .
Z.Yu. And tell me the heart rate monitor, which could throw off the data on the computer and, preferably, what thread did the Android interface have?