World modeling and dynamic systems
The article describes one statistical regularity, the explanation of which will lead to interesting problems of both applied and purely theoretical nature.
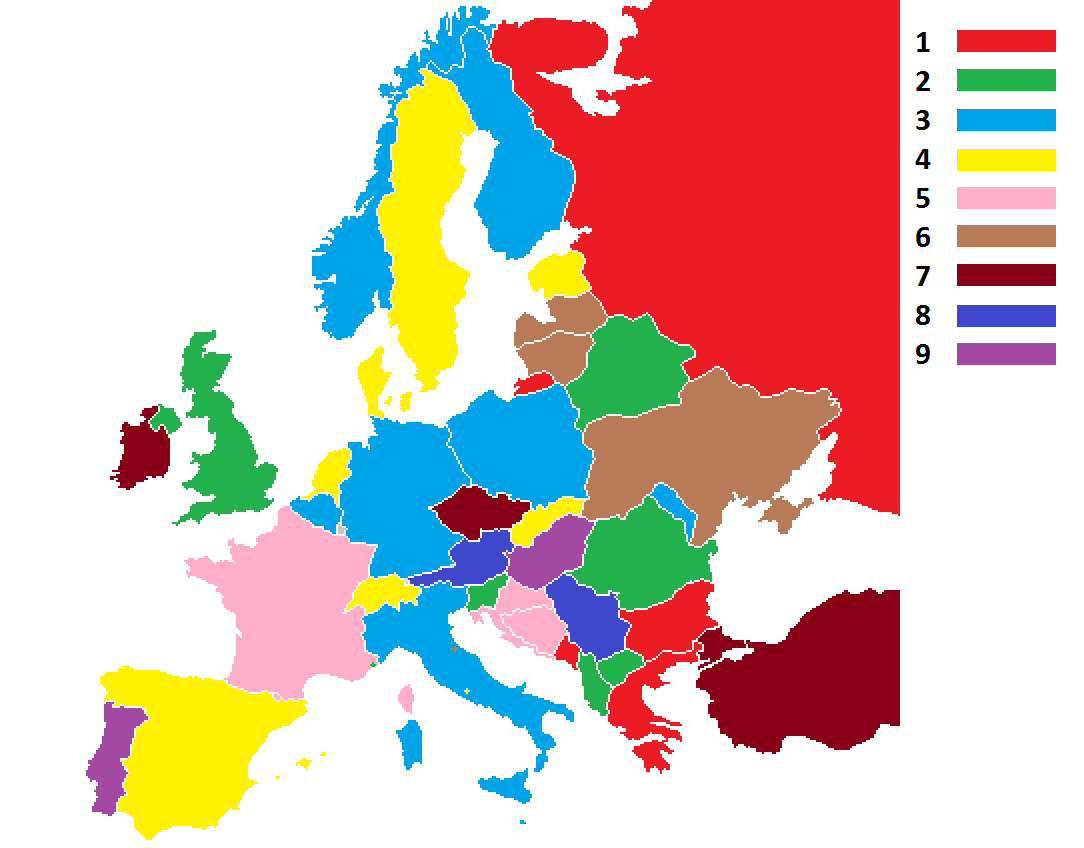
(The first figures of the area of countries recorded in decimal notation)
We begin by looking at one seemingly meaningless statistical indicator. We write the population of all countries in the decimal notation and see how often each digit from 1 to 9 is the first digit of one of these numbers.
The result is the following (the population was taken from Wikipedia ):
A strange monotony is already visible. For the sake of clarity, let’s build a graph:

It turned out an amazing result. The decimal number system is just a tool, it is not any distinguished or fundamental one, so the calculated distribution should be meaningless and not have any visible regularities, but we see a clear monotony.
So far, this may well be considered an accident that has no fundamental reasons. Some 9 numbers suddenly turned out to be somehow ordered (and even not quite, the frequency of the seven is less than the frequencies of the eight and nine) - you never know.
Then let's do a similar procedure with another geographical indicator - the area of the countries of the world.
We
’ll also build a graph. Monotony is still not ideal, but clearly noticeable.
Is this some kind of general pattern? Let's look at the area of the US states.

Well, such indecent monotony is no longer observed. This suggests the origin of the pattern. The areas and populations of the countries of the world have been actively changing over the course of history, while the areas of the states were once artificially determined and did not undergo any natural changes. monotony, most likely this is due to the fact that these values noticeably correlate with population size and area). We finally turn to the explanation.
Consider a similar indicator - the frequencies of the first digits in decimal notation for geometric progression - 1,2,4, ..., 2 n . Taking n = 1000, we get:
A similar pattern is visible - monotony and the unit is found several times more often than nine. This fact has rigorous mathematical proof. For this article, it is not very important, although it is interesting in itself.
The idea of the following reasoning, as far as I know, belongs to the great mathematician V.I. Arnold.
So, we have established that the first digits of numbers from a geometric progression obey a similar distribution. How can this connection be explained now? Arnold suggested that the point here is the ergodicity of this system ( visual noteabout this concept), that is, the spatial average value (here it’s just the statistics that we calculated) is equal to the temporary average value at one point in space (that is, similar statistics taken for the values of the population of one country over a long period of time ) By space here we mean phase space - many countries. In this case, it can be interpreted as follows: all countries of the world at the moment can be considered as stages of development of the same country throughout history, this correspondence is very inaccurate, the set of populations of countries of the world at the moment does not coincide with the set of populations of one country for some time , however, the average values that we study are the same.
Thus, the task was reduced to the study of the population dynamics of one country. It can already be approximated by a geometric progression. Locally, of course, this approximation is very inaccurate, but the first digit of the number is a parameter that is slightly sensitive to small changes in the number, so if the population dynamics is like an exponential over a long period of time, the frequency distribution of the first digits will be similar to that obtained theoretically.
Here are graphs illustrating this phenomenon.

Well, it was possible to explain the observed effect for the populations. What about squares?
They can no longer be called growing exponentially. Here we can offer such a mathematical model: the world begins with a certain number of countries of the same size. In each unit of time, one of two events occurs equally likely: a randomly selected country is divided into two identical areas or two randomly selected countries of the same area are combined into one. This model allows rigorous mathematical research, but it is already quite far from the topic of the article, so I will not give it here. Be that as it may, such a model leads to a similar frequency distribution.
However, she does not look very much like reality. Yes, in the world, countries are sometimes united, sometimes divided in half, but the area ratios are far from fixed and, as a rule, only countries with a common border are united. Given all these factors, it is possible to improve the model, but for mathematics it will already be unbearable (this is my personal opinion, maybe someone managed to get decent results in this direction).
Computer simulation comes to the rescue here. I chose this model: the world is a rectangle, the countries are rectangles whose sides are parallel to the sides of the world. For a unit of time with probability p, two countries with a common side merge into one, with probability (1-p) one country is divided into two by a straight line.
For implementation, I chose the first thing that came to hand, so I'm sorry if my choice seems strange. This is Python 2.7 using the pygame module.
Here is the video of the program (here are 1000 iterations):
At 1000 iterations, the statistics still do not quite coincide with the theoretical, but at 10000 it is already close:
These data were obtained at p = 0.3. Experimenting with different values of p and the initial configuration of the world, we will get similar results everywhere with a sufficiently large number of iterations, so that, apparently, the condition under consideration is common for all models of this type.
So, this seemingly senseless, experimental fact led us to to such deep sections of mathematics as number theory and theory of dynamical systems
PS I got the ideas of the mathematical part of this article from some popular science article by V.I. Arnold, which I once read, but unfortunately I couldn’t find her right now.
(The first figures of the area of countries recorded in decimal notation)
We begin by looking at one seemingly meaningless statistical indicator. We write the population of all countries in the decimal notation and see how often each digit from 1 to 9 is the first digit of one of these numbers.
The result is the following (the population was taken from Wikipedia ):
| 1 | 2 | 3 | 4 | 5 | 6 | 7 | 8 | 9 |
| 0.265 | 0.176 | 0.134 | 0.093 | 0.089 | 0.081 | 0.044 | 0.069 | 0.049 |
A strange monotony is already visible. For the sake of clarity, let’s build a graph:
It turned out an amazing result. The decimal number system is just a tool, it is not any distinguished or fundamental one, so the calculated distribution should be meaningless and not have any visible regularities, but we see a clear monotony.
So far, this may well be considered an accident that has no fundamental reasons. Some 9 numbers suddenly turned out to be somehow ordered (and even not quite, the frequency of the seven is less than the frequencies of the eight and nine) - you never know.
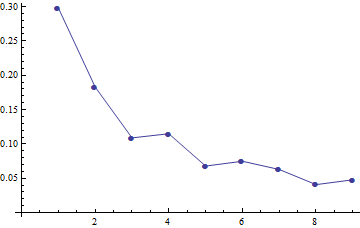
Then let's do a similar procedure with another geographical indicator - the area of the countries of the world.
| 1 | 2 | 3 | 4 | 5 | 6 | 7 | 8 | 9 |
| 0.298 | 0.183 | 0.109 | 0.115 | 0.068 | 0.075 | 0.063 | 0.041 | 0.048 |
We
’ll also build a graph. Monotony is still not ideal, but clearly noticeable.
Is this some kind of general pattern? Let's look at the area of the US states.
Well, such indecent monotony is no longer observed. This suggests the origin of the pattern. The areas and populations of the countries of the world have been actively changing over the course of history, while the areas of the states were once artificially determined and did not undergo any natural changes. monotony, most likely this is due to the fact that these values noticeably correlate with population size and area). We finally turn to the explanation.
Mathematical explanation
Consider a similar indicator - the frequencies of the first digits in decimal notation for geometric progression - 1,2,4, ..., 2 n . Taking n = 1000, we get:
| 1 | 2 | 3 | 4 | 5 | 6 | 7 | 8 | 9 |
| 0.301 | 0.177 | 0.124 | 0.097 | 0.080 | 0.067 | 0.057 | 0.052 | 0.044 |
A similar pattern is visible - monotony and the unit is found several times more often than nine. This fact has rigorous mathematical proof. For this article, it is not very important, although it is interesting in itself.
Evidence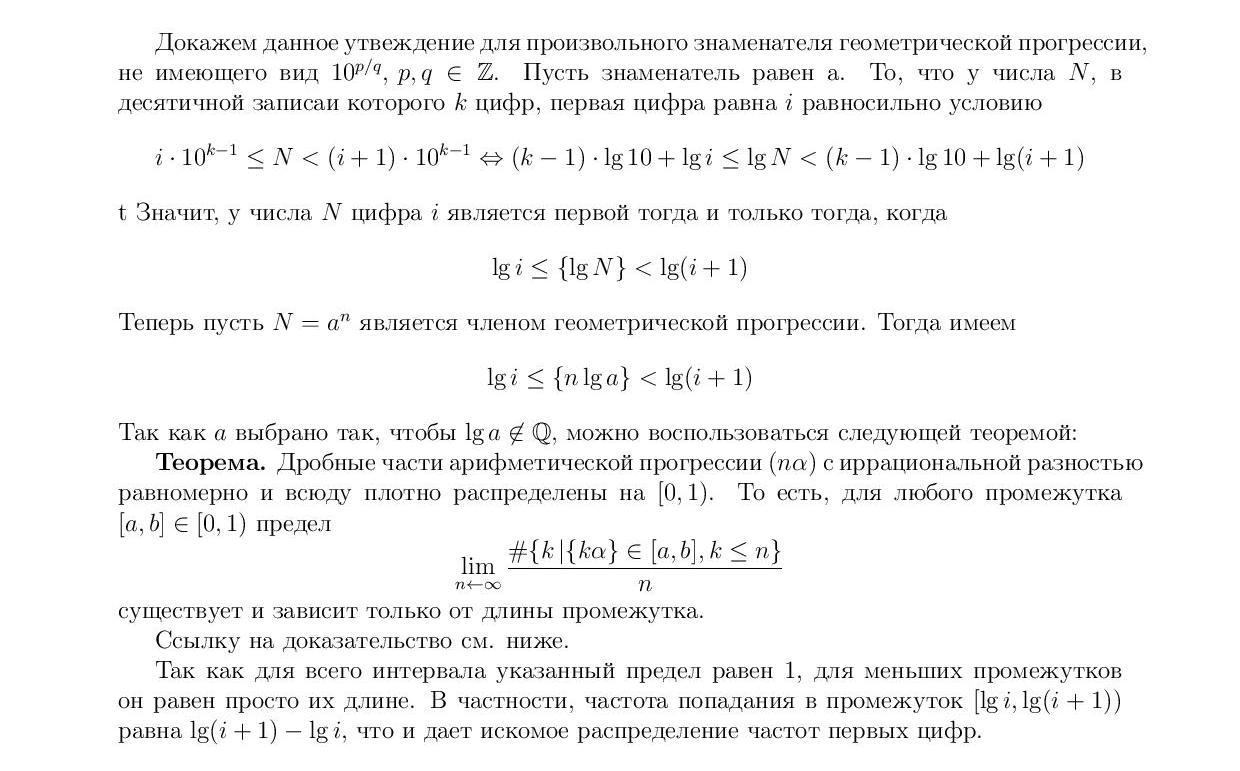
Proof of the theorem.
Therefore, in the limit we obtain the following result:
It is surprising in itself that these frequencies are independent of the choice of the denominator of progression.
Proof of the theorem.
Therefore, in the limit we obtain the following result:
| 1 | 2 | 3 | 4 | 5 | 6 | 7 | 8 | 9 |
| lg 2 | lg 3/2 | lg 4/3 | lg 5/4 | lg 6/5 | lg 7/6 | lg 8/7 | lg 9/8 | lg 10/9 |
| 0.301 | 0.176 | 0.125 | 0.097 | 0.079 | 0.067 | 0.058 | 0.051 | 0.046 |
It is surprising in itself that these frequencies are independent of the choice of the denominator of progression.
The idea of the following reasoning, as far as I know, belongs to the great mathematician V.I. Arnold.
So, we have established that the first digits of numbers from a geometric progression obey a similar distribution. How can this connection be explained now? Arnold suggested that the point here is the ergodicity of this system ( visual noteabout this concept), that is, the spatial average value (here it’s just the statistics that we calculated) is equal to the temporary average value at one point in space (that is, similar statistics taken for the values of the population of one country over a long period of time ) By space here we mean phase space - many countries. In this case, it can be interpreted as follows: all countries of the world at the moment can be considered as stages of development of the same country throughout history, this correspondence is very inaccurate, the set of populations of countries of the world at the moment does not coincide with the set of populations of one country for some time , however, the average values that we study are the same.
Thus, the task was reduced to the study of the population dynamics of one country. It can already be approximated by a geometric progression. Locally, of course, this approximation is very inaccurate, but the first digit of the number is a parameter that is slightly sensitive to small changes in the number, so if the population dynamics is like an exponential over a long period of time, the frequency distribution of the first digits will be similar to that obtained theoretically.
Here are graphs illustrating this phenomenon.
Well, it was possible to explain the observed effect for the populations. What about squares?
Square
They can no longer be called growing exponentially. Here we can offer such a mathematical model: the world begins with a certain number of countries of the same size. In each unit of time, one of two events occurs equally likely: a randomly selected country is divided into two identical areas or two randomly selected countries of the same area are combined into one. This model allows rigorous mathematical research, but it is already quite far from the topic of the article, so I will not give it here. Be that as it may, such a model leads to a similar frequency distribution.
However, she does not look very much like reality. Yes, in the world, countries are sometimes united, sometimes divided in half, but the area ratios are far from fixed and, as a rule, only countries with a common border are united. Given all these factors, it is possible to improve the model, but for mathematics it will already be unbearable (this is my personal opinion, maybe someone managed to get decent results in this direction).
Computer simulation comes to the rescue here. I chose this model: the world is a rectangle, the countries are rectangles whose sides are parallel to the sides of the world. For a unit of time with probability p, two countries with a common side merge into one, with probability (1-p) one country is divided into two by a straight line.
For implementation, I chose the first thing that came to hand, so I'm sorry if my choice seems strange. This is Python 2.7 using the pygame module.
Code (written solely on the result, so it’s very unkempt)
import pygame
import random
import time
cell_size = 10
WIN_WIDTH = 850
WIN_HEIGHT = 850
BACKGROUND_COLOR = "#D3D3D3"
DISPLAY = (WIN_WIDTH, WIN_HEIGHT)
p = 0.3
class Country(object):
    def __init__(self, x, y, dx, dy):
        self.x = x
        self.y = y
        self.dx = dx
        self.dy = dy
        self.color = (random.choice(range(256)), random.choice(range(256)), random.choice(range(256)))
    def get_neighbs(self, countries):
        self.neighbors = []
        for i in range(len(countries)):
            c = countries[i]
            if c.x == self.x and c.dx == self.dx and (c.y + c.dy == self.y or c.y == self.y + self.dy):
                self.neighbors.append(i)
            if c.y == self.y and c.dy == self.dy and (c.x + c.dx == self.x or c.x == self.x + self.dx):
                self.neighbors.append(i)
    def __repr__(self):
        return str((self.x, self.y, self.dx, self.dy, self.neighbors))
    __str__ = __repr__
    def draw(self, screen):
        self.image = pygame.Rect(self.x, self.y, self.dx, self.dy)
        pygame.draw.rect(screen, self.color, self.image)
    def area(self):
        return self.dx * self.dy
def world_init():
    countries = [Country(50, 50, 250, 250), Country(300, 50, 250, 250), Country(550, 50, 250, 250),
                 Country(50, 300, 250, 250), Country(300, 300, 250, 250), Country(550, 300, 250, 250),
                 Country(50, 550, 250, 250), Country(300, 550, 250, 250), Country(550, 550, 250, 250)]
    for c in countries:
        c.get_neighbs(countries)
    return countries
def merge(countries, i, j):
    """i < j"""
    if countries[i].x < countries[j].x:
        new_country = Country(countries[i].x, countries[i].y, countries[i].dx + countries[j].dx, countries[i].dy)
    if countries[i].y < countries[j].y:
        new_country = Country(countries[i].x, countries[i].y, countries[i].dx, countries[i].dy + countries[j].dy)
    if countries[i].x > countries[j].x:
        new_country = Country(countries[j].x, countries[j].y, countries[j].dx + countries[i].dx, countries[j].dy)
    if countries[i].y > countries[j].y:
        new_country = Country(countries[j].x, countries[j].y, countries[j].dx, countries[j].dy + countries[i].dy)
    del countries[i]
    del countries[j - 1]
    countries.append(new_country)
    for c in countries:
        c.get_neighbs(countries)
def divide(countries, i, midx=0, midy=0):
    print countries[i].area()
    if midy == 0:
        new1 = Country(countries[i].x, countries[i].y, midx, countries[i].dy)
        new2 = Country(countries[i].x + midx, countries[i].y, countries[i].dx - midx, countries[i].dy)
        del countries[i]
        countries.append(new1)
        countries.append(new2)
        for c in countries:
            c.get_neighbs(countries)
    if midx == 0:
        new1 = Country(countries[i].x, countries[i].y, countries[i].dx, midy)
        new2 = Country(countries[i].x, countries[i].y + midy, countries[i].dx, countries[i].dy - midy)
        del countries[i]
        countries.append(new1)
        countries.append(new2)
        for c in countries:
            c.get_neighbs(countries)
def world_draw(countries, screen):
    for c in countries:
        c.draw(screen)
def random_action(countries):
    rand = (random.uniform(0, 1) < p)
    if rand:
        i = random.choice(range(len(countries)))
        if countries[i].neighbors:
            j = random.choice(countries[i].neighbors)
            merge(countries, i, j)
    else:
        i = random.choice(range(len(countries)))
        xaxis = random.choice([True, False])
        if xaxis:
            try:
                mid = random.choice(range(cell_size, countries[i].dx, cell_size))
            except IndexError:
                return 0
            divide(countries, i, midx=mid)
        else:
            try:
                mid = random.choice(range(cell_size, countries[i].dy, cell_size))
            except IndexError:
                return 0
            divide(countries, i, midy=mid)
def get_stat(countries):
    digits = [int(str(c.area())[0]) for c in countries]
    result = {0:0.0, 1:0.0, 2:0.0, 3:0.0, 4:0.0, 5:0.0, 6:0.0, 7:0.0, 8:0.0, 9:0.0}
    for d in digits:
        result[d] += 1
    for d in range(1, 10):
        result[d] = round(result[d] / len(digits), 3)
    return result
def main():
    pygame.init()
    screen = pygame.display.set_mode(DISPLAY)
    pygame.display.set_caption("World History")
    bg = pygame.Surface((WIN_WIDTH, WIN_HEIGHT))
    bg.fill(pygame.Color(BACKGROUND_COLOR))
    countries = world_init()
    waiting = True
    while waiting:
        events = pygame.event.get()
        for event in events:
            if event.type == pygame.KEYDOWN:
                if event.key == pygame.K_SPACE:
                    waiting = False
    for i in range(1000):
        for e in pygame.event.get():
            if e.type == pygame.QUIT:
                raise SystemExit, "QUIT"
        world_draw(countries, screen)
        pygame.display.update()
        random_action(countries)
        time.sleep(0.07)
    print get_stat(countries)
main()
Here is the video of the program (here are 1000 iterations):
At 1000 iterations, the statistics still do not quite coincide with the theoretical, but at 10000 it is already close:
| 1 | 2 | 3 | 4 | 5 | 6 | 7 | 8 | 9 |
| 0.435 | 0.226 | 0.106 | 0.085 | 0.045 | 0.038 | 0.020 | 0.029 | 0.015 |
These data were obtained at p = 0.3. Experimenting with different values of p and the initial configuration of the world, we will get similar results everywhere with a sufficiently large number of iterations, so that, apparently, the condition under consideration is common for all models of this type.
So, this seemingly senseless, experimental fact led us to to such deep sections of mathematics as number theory and theory of dynamical systems
PS I got the ideas of the mathematical part of this article from some popular science article by V.I. Arnold, which I once read, but unfortunately I couldn’t find her right now.