Our iOS Acceleration Experience

My name is Mitya Kurkin, I lead the development of iOS messengers Mail.Ru Group. Today I will talk about our experience of accelerating applications on iOS. High speed is very important for 99% of applications. This is especially true on mobile platforms where computing power and, accordingly, the battery charge are very limited. Therefore, every self-respecting developer seeks to optimize the operation of his application in order to eliminate various delays that make up the total reaction time.
Measurement
Before making any manipulations, you need to fix the current state of affairs. That is, measure how much time is now lost in problem areas. The measurement method must be reproducible, otherwise this data will be pointless to compare with subsequent achievements. How to measure? Situations may be different, but we always have a stopwatch. True, this is the least accurate option.It can be measured using the profiler. If there are characteristic areas on the graph (recession or peak load), then you can measure them. This option gives a more accurate result. In addition, the graph will show the influence of additional factors. For example, if you measure the speed of all processes of the device, you can find out what other applications are doing and whether this affects the result of our measurement. If there is nothing to cling to in the profiler, then you can measure with your logs. This can give an even more accurate result, but for this you will need to change the application, which may in some way affect its work. Also in this case, the influence of additional factors will not be visible.
Perfect result
To understand whether it is possible to accelerate in a particular situation, it is advisable to understand in advance what the minimum time can be. The quickest solution is to consider the work of a similar function with a competitor application. This can provide a guide to how quickly such an operation can be performed. It is necessary to evaluate whether the selected technologies allow achieving the desired speed. It is necessary to remove everything that is possible in order to get the very minimum of the function performed:- disable parallel processes;
- replace variables with constants;
- instead of fully loading the screen, show only the dummy;
- leave from the network operation only a sequence of constant network requests;
- you can even create a clean application that performs only this constant function.
If in this case we get the desired speed, then you can slowly return disabled items and watch how it affects performance. If, even after performing all the described procedures, the result is unsatisfactory, then more radical actions are needed: changing the libraries used, reducing the amount of traffic due to its quality, changing the protocol used, etc.
Profiler
With optimization, simply reading the code can easily lead the wrong way. Perhaps you will come across some “heavy” operation, which is difficult, but you can optimize a little. And so, having spent a lot of time, applying the latest and most fashionable algorithms, you succeed. But at the same time, the ideal is still the same as before China. Or maybe it’s even worse. Although, in fact, the problem may lie in the most unexpected places, completely not arousing suspicion. Somewhere completely unnecessary actions may be performed, or this is simply an error leading to a hang. Therefore, you first need to measure what time is spent. Moreover, we have such an opportunity thanks to the tools from Apple.
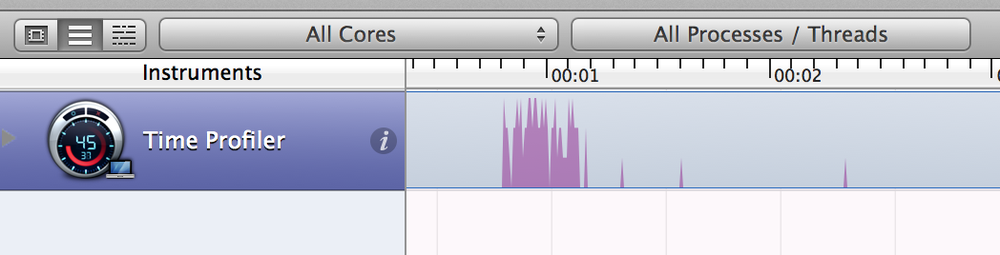
To speed up the application, first of all, Time Profiler is required. Its interface is pretty straightforward: on the top there is a graph of the processor load, below is a call tree showing which method has eaten. There are splitting into streams, filters, fragment selection, various sortings and much more.
To work most effectively with this data, you need to understand how it is calculated. Let's take a chart like this:
With a large increase, it looks like this: The
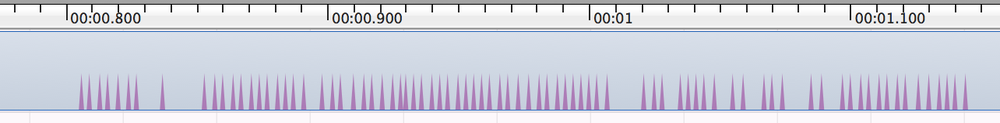
profiler measures the time consumption by periodically polling the application state. If it uses a processor during such a measurement, then all methods from the call stack use processor time. By the total amount of such measurements, we get a call tree indicating the time spent:
The tools allow you to adjust the frequency of such measurements:

It turns out that the more often the processor usage is noted in the measurements, the higher the level on the original chart. But then, if the processor is not used, this time does not affect the overall result. How then to look for those cases when the application is in a state of waiting for an event, for example, an answer to an http request? In this case, setting “Record Waiting Threads” may help. Then, when measuring, those states when the processor is not used will be recorded. The column with the number of measurements per function instead of the elapsed time will automatically turn on in the bottom table. The display of these columns can be customized, but either the time or the number of measurements is displayed by default.
Consider this example:
- (void)someMethod
{
[self performSelector:@selector(nothing:) onThread:[self backThread] withObject:nil waitUntilDone:YES];
}
- (void)nothing:(id)object
{
for (int i=0; i<10000000; ++i)
{
[NSString stringWithFormat:@"get%@", @"Some"];
}
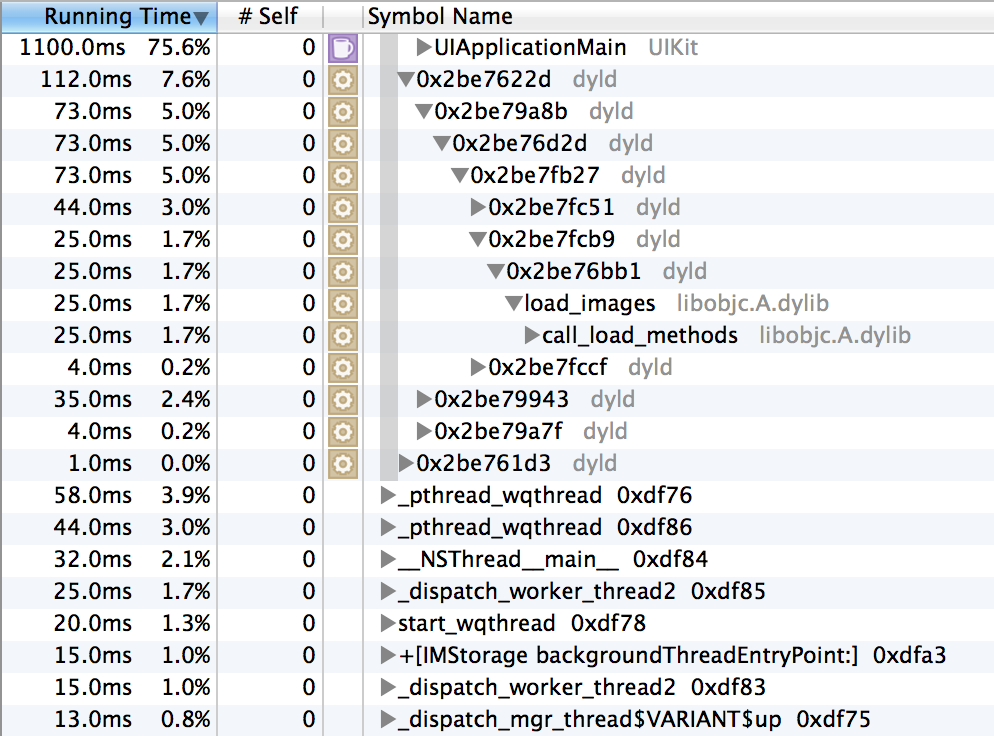
}Measuring the application with the launch of such code will give something like this:
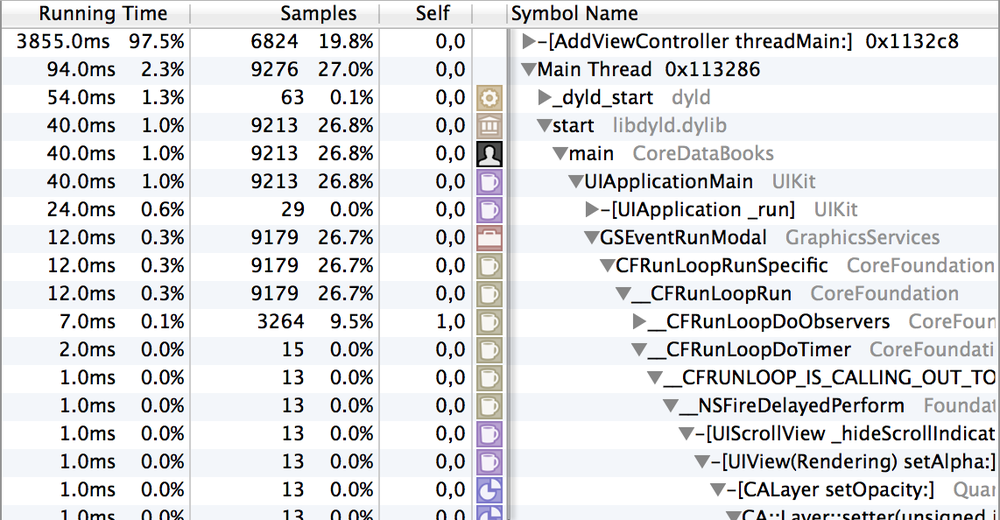
The figure shows that in time the main stream takes 94 ms and 2.3%, and in measurements (samples) - 9276 and 27%. However, the difference may not always be so noticeable. How to look for such cases in real applications? The graph displaying mode in the form of streams helps here:
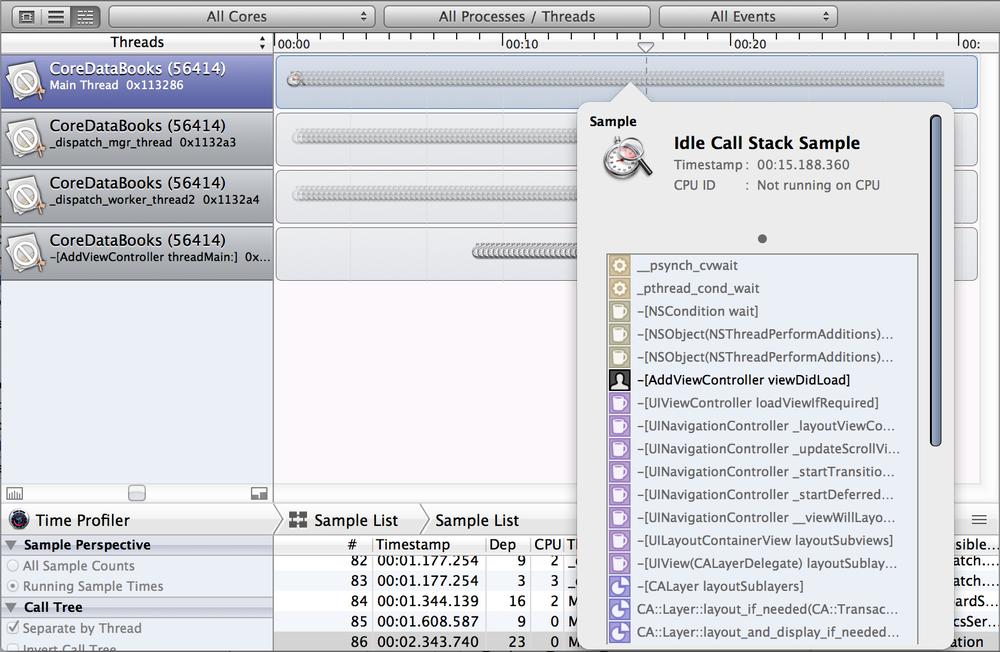
In this mode it is visible when the streams are launched, when they perform some actions and when they “sleep”. In addition to viewing the graph at the top, you can also enable the display of the Sample List in the bottom table. Looking through the areas of “sleep” of the main thread, you can find the culprit of the interface hanging.
Do not dwell on system calls
Carrying out measurements, it is very easy to run into system calls. It turns out that all the time it takes the system code to work. What is there to do? In fact, the main thing is not to dwell on this. As long as you can, you need to delve into these challenges. If you dig around, it can easily turn out to be a callback or a delegate who calls your code, and a noticeable waste of time is precisely because of it.Disconnect
So, the suspect is found. Before redoing, you need to check how the application will work without it.It happens that there are many potential culprits of inhibition, and it is problematic to measure all this with a profiler. For example, a problem is well reproduced only by some users and not always, but only in a certain situation. To quickly understand whether we are moving in the right direction, whether we are measuring and optimizing places, disabling these modules very well.
If everything is already off, and far from ideal, then you need to try to move on the other side. Create an empty application and increase its functionality.
Take into account the technical features of the devices
Product specifications are changing, and this is also worth considering. For example, starting with the iPhone 4S began to use multi-core processors. Therefore, there the use of multithreading is more efficient due to the use of several cores. However, on a single-core processor, this can slow down the final result, since we can still use only one core, but at the same time we spend additional resources on switching the context of the thread.Be careful when connecting large frameworks
The more and more powerful the mechanism you connect, the more it takes over. The less you control the situation. And, accordingly, the application becomes less flexible. In our case, we firmly sat on CoreData. Great technology. All kinds of support for migrations, FetchResultController, caching is very tempting. But take the launch of the application. To initialize the CoreData stack, you must at least load the database and load the model. If you use sqlite without CoreData - loading the model is not required. In our case, the model contains 26 entities. Its loading takes tangible time, especially on older devices, where the startup speed is felt most acutely.Our applications are actively developing, so there is always a need to add entities to the database. Thanks to the convenient migration mechanism, this does not cause a problem. But now there are almost 40 of them. First of all, this greatly affects the size of the application. In total, all migrations add about 30%. Additionally, migrations work sequentially. So the more there are, the longer the migration takes place. And this again affects the launch speed.
We also encountered a removal problem. With our model and a sufficiently large base, the removal, affecting all entities, took about 10 minutes. Turning on the magic debugging option of CoreData SQLDebug, we saw a huge number of SELECTs, UPDATEs and a little DELETEs. The main problem here is that there is no deleteObjects method in NSManagedObjectContext. That is, objects can be deleted only one at a time, although SQL itself can delete through DELETE ... WHERE someValue IN ... In addition, to delete each object, SELECT its key and only then delete it. Similarly, deletion of dependent objects occurs.
In our situation, the situation is further aggravated by the fact that mobile device users, as a rule, do not wait for such a long time and “kill” the application. The result is a broken base.