Comprehensive web project analytics using Google Analytics and Google Docs
- Tutorial
Recently, we managed to deal with a variety of analytical systems, build an economic model and conduct several experiments to optimize conversions in registration and activation. Thanks to Ilya Krasinsky (ex. LinguaLeo product chief), we learned how to properly configure and analyze Google Analytics data, learned how to build economic models of Internet projects. Next, we began to deal with event based analytics and mixpanel configuration. Now we decided to share this knowledge with the habro-community.
In this article we will consider:
First, let's build an economic model. Most Internet projects work according to the simplest scheme:
User attraction -> Registration -> Activation -> Payment
Accordingly, almost all projects need to consider the following metrics:
User Acquisition - number of attracted users
Registration Conversion - conversion from attracted user to registered
Registrations - number of registered users
Paying Conversion - conversion from an attracted user to a paid
Payments - the number of completed purchases
Revenue - revenue
In addition, one user can make several purchases. Moreover, different purchases can be of different sizes, so to build a product economy we will need a few more metrics:
Average Price - average purchase price
Average Payment Count - average number of purchases
Now that we know the average check of our user and the average number of payments, we can calculate how much money each paying user brings to us. Just multiply the average check by the average number of purchases.
Average Revenue per Paying User - the average amount received from one paying user:
So, we got to one of the main metrics.
Average Revenue per User - The average amount received from one attracted user
We can get this figure if we multiply the average income from the payer by the conversion in payment:
Or we can simply divide the revenue by the number of users involved:
Almost always, Internet projects use various paid promotion channels, so we’ll introduce a few more metrics:
Marketing costs - Cost of attracting users
Cost per Acquisition - Cost of attracting one user
And of course, if we subtract the cost of borrowing from our revenue, we will make a profit.
Profit - Profit
Now let's look at an example:
We attracted 10,000 users for 100,000 rubles. 20% of users registered and 1% of users made a purchase. The average purchase receipt was 500 rubles and users pay us an average of 1.2 times.
Then we get the following model:
As we see, the cost of attracting a user is 10 rubles, and we earn only 6 rubles per user. Most product economies do not pay off. But now we know what parameters we can influence in order to make the product payback.
For those who want to build a similar model for their project, I created a Google spreadsheet with ready-made formulas and comments for each metric.
In order to fill out the table compiled above, we need to get the correct numbers from various analytical systems.
Most of these numbers can be obtained by properly setting up Google Analytics. We use the Measurement Protocol , which allows you to send events directly from the backend. We also use Ecommerce Tracking , which allows you to transfer data on purchases and revenue.
Thus, we can send the following events:
In our case, we considered the user to be activated if he viewed at least one lesson of any course.
Next, you’ll need to set up goals in Google Analytics to display conversion data for various events.

Goals are configured on the Admin tab in the Goals menu . There is no need to set up a purchase target; a purchase is automatically considered a target if you send it through Ecommerce Tracking.
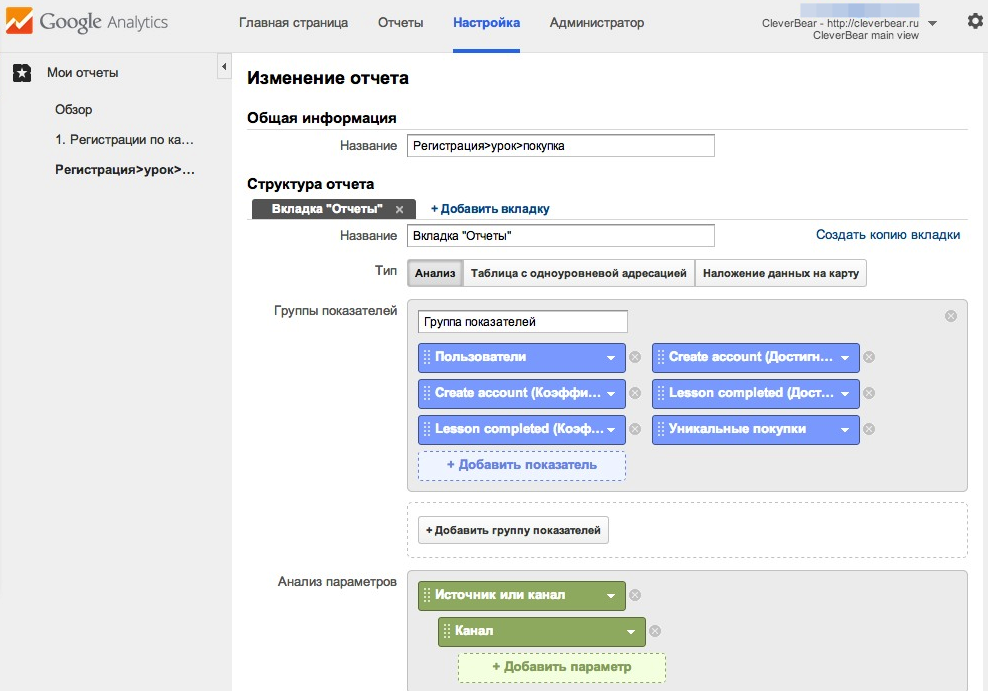
The next step is to create a report in the Settings tab , thanks to which we will see conversions to registration, activation and purchase for each channel.
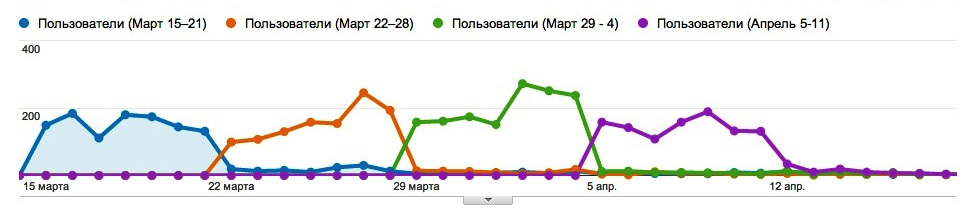
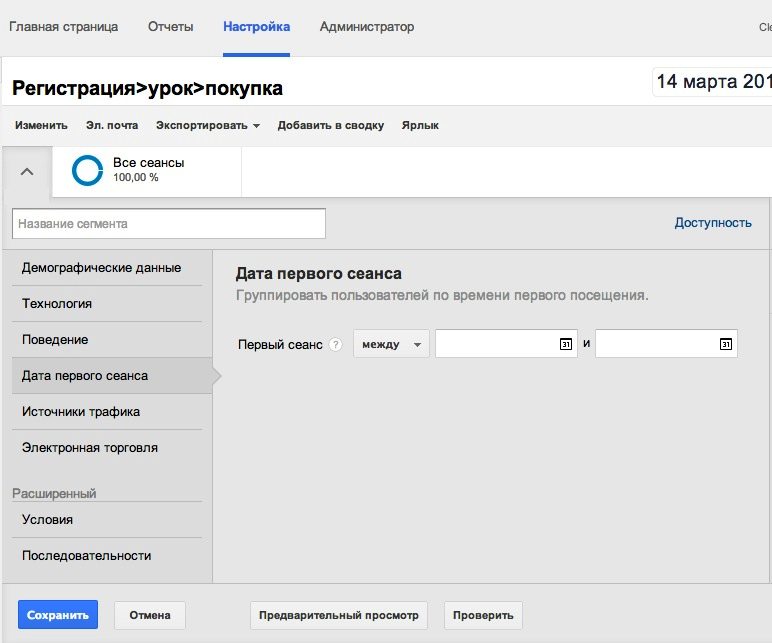
To analyze product changes over time, we can set up cohorts. To do this, click on the arrow in the upper left corner and create segments with the date of the first session. Cohorts are usually created weekly or monthly.
In the end, you should get something like this:

It’s worth noting that in this case only new users are taken into account who went through the funnel through - attraction -> registration -> activation -> purchase. If your user first came from a search, then received a letter and made a purchase through a letter, this will not be the first visit, and the channel of attraction in this report will be considered e-mail, not search.
Using the data from the report, we can compare the performance of different channels. To do this, export data to a table using the corresponding menu. Then we remove unnecessary traffic sources, add metrics and indicate the costs for each channel. As a result, you should get something like this table:
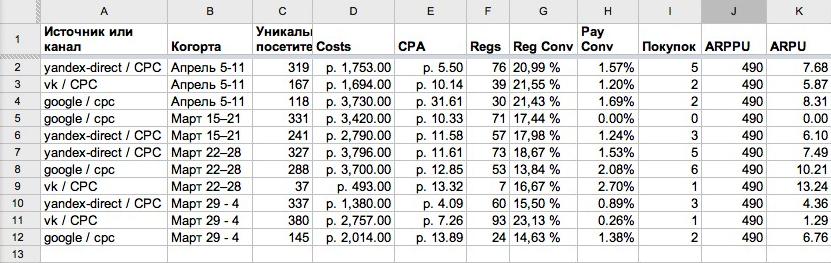
Using this table, we can analyze the effectiveness of each channel in terms of activation and the ratio of marketing / revenue. So you will understand which advertising brings you profit, and which only losses.
Now you know how to conduct a basic analysis of your online project. The next step is to analyze user behavior and conduct experiments to optimize conversions. For these purposes, we are actively using another analytical tool - Mixpanel.
In this article we will consider:
- Building product economics using Google spreadsheets
- Generating a Google Analytics Report by Cohorts and Channels
- Creating a paid channel performance analysis table
Building product economics using Google spreadsheets
First, let's build an economic model. Most Internet projects work according to the simplest scheme:
User attraction -> Registration -> Activation -> Payment
Accordingly, almost all projects need to consider the following metrics:
User Acquisition - number of attracted users
Registration Conversion - conversion from attracted user to registered
Registrations - number of registered users
Paying Conversion - conversion from an attracted user to a paid
Payments - the number of completed purchases
Revenue - revenue
In addition, one user can make several purchases. Moreover, different purchases can be of different sizes, so to build a product economy we will need a few more metrics:
Average Price - average purchase price
Average Payment Count - average number of purchases
Now that we know the average check of our user and the average number of payments, we can calculate how much money each paying user brings to us. Just multiply the average check by the average number of purchases.
Average Revenue per Paying User - the average amount received from one paying user:
ARPPU = Average Price * APC
So, we got to one of the main metrics.
Average Revenue per User - The average amount received from one attracted user
We can get this figure if we multiply the average income from the payer by the conversion in payment:
ARPU = ARPPU * Paying Conversion
Or we can simply divide the revenue by the number of users involved:
ARPU = Revenue / User Acquisition
Almost always, Internet projects use various paid promotion channels, so we’ll introduce a few more metrics:
Marketing costs - Cost of attracting users
Cost per Acquisition - Cost of attracting one user
CPA = Marketing costs / User Acquisition
And of course, if we subtract the cost of borrowing from our revenue, we will make a profit.
Profit - Profit
Profit = Revenue - Marketing costs
Now let's look at an example:
We attracted 10,000 users for 100,000 rubles. 20% of users registered and 1% of users made a purchase. The average purchase receipt was 500 rubles and users pay us an average of 1.2 times.
Then we get the following model:
| User acquisition | 10,000 |
| Registration conversion | 20% |
| Registrations | 2000 |
| Payment conversion | 1% |
| Payments | 100 |
| Average price | 500 rub |
| Average payment count | 1.2 |
| ARPPU | 600 rub |
| ARPU | 6 rub |
| CPA | 10 rub |
| Marketing costs | 100,000 rub. |
| Revenue | 60 000 rub. |
| Profit | -40 000 rub. |
As we see, the cost of attracting a user is 10 rubles, and we earn only 6 rubles per user. Most product economies do not pay off. But now we know what parameters we can influence in order to make the product payback.
For those who want to build a similar model for their project, I created a Google spreadsheet with ready-made formulas and comments for each metric.
Report generation in Google Analytics by cohorts and channels
In order to fill out the table compiled above, we need to get the correct numbers from various analytical systems.
Most of these numbers can be obtained by properly setting up Google Analytics. We use the Measurement Protocol , which allows you to send events directly from the backend. We also use Ecommerce Tracking , which allows you to transfer data on purchases and revenue.
Simple Ruby class to send data using Measurement Protocol
Google identifies the user by a randomly generated client id, which is stored in the _ga cookie . Example value stored in the GA1.2 cookie. 1405340423.128133435 . Client id is highlighted in bold - two groups of 10 digits connected by a dot. When sending data, do not forget to pass this value.
class GoogleAnalyticsApi
  def initialize(cid)
    @client_id = cid
  end
  def event(params)
    data = default_params.merge(
      t: "event",
      ec: params['category'],
      ea: params['action'],
      ev: params['value']
    )
    send_data(data)
  end
  def pageview(params)
    data = default_params.merge(
      t: "pageview",
      dp: params['path']
    )
    send_data(data)
  end
  def ecommerce(params)
    transaction_data = default_params.merge(
      t: 'transaction',
      ti: params['id'],
      tr: params['revenue'],
      cu: "RUB"
    )
    send_data(transaction_data)
    params['items'].each do |item|
      item_data = default_params.merge(
        t: 'item',
        ti: params['id'],
        in: item['name'],
        ip: item['price'],
        iq: item['quantity'],
        cu: 'RUB'
      )
      send_data(item_data)
    end
  end
  private
    def send_data(params)
      RestClient.post("http://www.google-analytics.com/collect", params: params)
    rescue => e
      #handle timeout and other errors
    end
    def default_params
      {
        v: 1,
        tid: "tracking-code-here",
        cid: @client_id
      }
    end
end
Thus, we can send the following events:
- registration
- Activation
- Purchase
In our case, we considered the user to be activated if he viewed at least one lesson of any course.
Next, you’ll need to set up goals in Google Analytics to display conversion data for various events.
Goals are configured on the Admin tab in the Goals menu . There is no need to set up a purchase target; a purchase is automatically considered a target if you send it through Ecommerce Tracking.
The next step is to create a report in the Settings tab , thanks to which we will see conversions to registration, activation and purchase for each channel.
To analyze product changes over time, we can set up cohorts. To do this, click on the arrow in the upper left corner and create segments with the date of the first session. Cohorts are usually created weekly or monthly.
In the end, you should get something like this:
It’s worth noting that in this case only new users are taken into account who went through the funnel through - attraction -> registration -> activation -> purchase. If your user first came from a search, then received a letter and made a purchase through a letter, this will not be the first visit, and the channel of attraction in this report will be considered e-mail, not search.
Creating a paid channel performance analysis table
Using the data from the report, we can compare the performance of different channels. To do this, export data to a table using the corresponding menu. Then we remove unnecessary traffic sources, add metrics and indicate the costs for each channel. As a result, you should get something like this table:
Using this table, we can analyze the effectiveness of each channel in terms of activation and the ratio of marketing / revenue. So you will understand which advertising brings you profit, and which only losses.
Now you know how to conduct a basic analysis of your online project. The next step is to analyze user behavior and conduct experiments to optimize conversions. For these purposes, we are actively using another analytical tool - Mixpanel.