Zabbix + Iostat: disk subsystem monitoring
Zabbix + Iostat: monitoring the disk subsystem.

What for?
The disk subsystem is one of the important subsystems of the server, and very much often depends on the level of load on the disk subsystem, for example, the speed of content delivery or how quickly the database will respond. This mainly applies to mail or file servers, database servers. In general, disk performance indicators need to be monitored. Based on the performance graphs of the disk subsystem, we can decide on the need to increase capacity long before the cock pecks. Yes, and just do it is useful to glance from release to release as the work of developers affects the level of workload.
Under the cut, about monitoring and how to configure.
Dependencies:
Monitoring is implemented through the zabbix agent and two utilities: awk and iostat (sysstat package). If awk comes with distributions by default, then iostat needs to be installed with the sysstat package (here special thanks to Sebastien Godard and colleagues).
Known limitations:
Monitoring requires sysstat starting from version 9.1.2, as there is a very important change: "Added r_await and w_await fields to iostat's extended statistics." So you should be careful, in some distributions, for example, in CentOS, a slightly “stable” and less featured version of sysstat.
If you start from the version of zabbix (2.0 or 2.2) then the question is not fundamental, it works on both versions. At 1.8 it does not work because Used Low level discovery.
Opportunities (purely subjective, with decreasing utility):
In general, as you can see, all the metrics that are in iostat are available here (anyone who is unfamiliar with this utility, I highly recommend that you look into man iostat).
Available graphs:
Graphs are drawn per-device, LLD detects devices that fall under the regular expression "(xvd | sd | hd | vd) [az]", so if your drives have different names, you can easily make the appropriate changes. Such a regularity is made to detect devices that will be parent to other partitions, LVM volumes, MDRAID arrays, etc. In general, so as not to collect too much. A little distracted, so the list of graphs:
Analogs and differences:
In zabbiks there are boxed options for similar monitoring, these are the keys vfs.dev.read and vfs.dev.write . They are good and work great, but less informative than iostat. For example, iostat has metrics such as latency and utilization.
There is also a similar template from Michael Noman, in my opinion there is only one difference, it is focused on older versions of iostat, well, + small syntax changes.
Where to get it:
So, monitoring consists of a configuration file for the agent, two scripts for collecting / receiving data and a template for the web interface. All this is available in the repository on Github., so in any available way (git clone, wget, curl, etc ...) we download them to the machines we want to monitor and go to the next step.
How to setup:
Now everything is ready, start the agent and go to the monitoring server and execute the command (do not forget to replace agent_ip):
Thus, we check from the monitoring server that iostat.conf is loaded and gives information, at the same time we see that LLD is working. The response will return JSON with the names of the detected devices. If no answer came, then something was done wrong.
There is also such a point that the zabbix server does not wait for the execution of some items by agents (iostat.collect). To do this, increase the Timeout values.
How to configure the web interface:
Now the iostat-disk-utilization-template.xml template remains. Through the web interface, we import it into the templates section and assign it to our host. Everything is simple here. Now it remains to wait about one hour, this time is set in the LLD rule (also configurable). Or you can look in the Latest Data of the host being watched, in the Iostat section. As soon as the values appear there, you can go to the graphs section and observe the first data.
And finally, the top three screenshots of graphs from the localhost))):
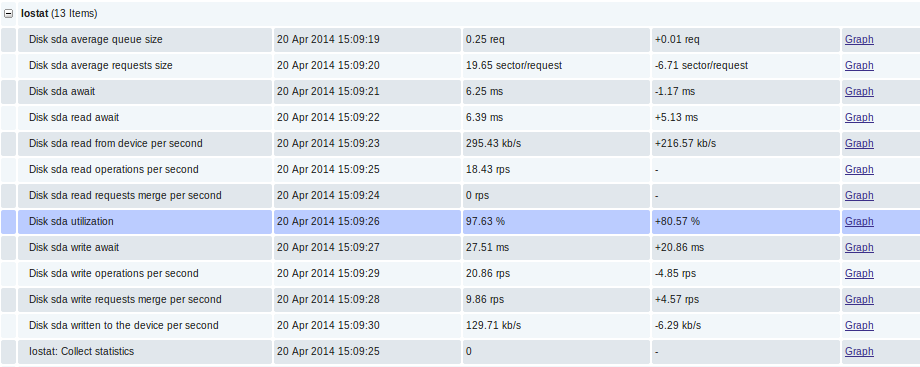
Directly the data in Latest Data:
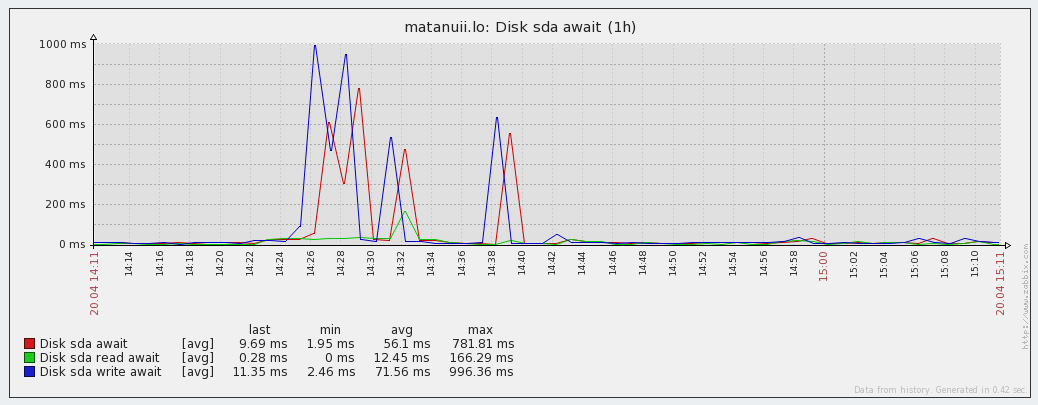
Latency graphs:
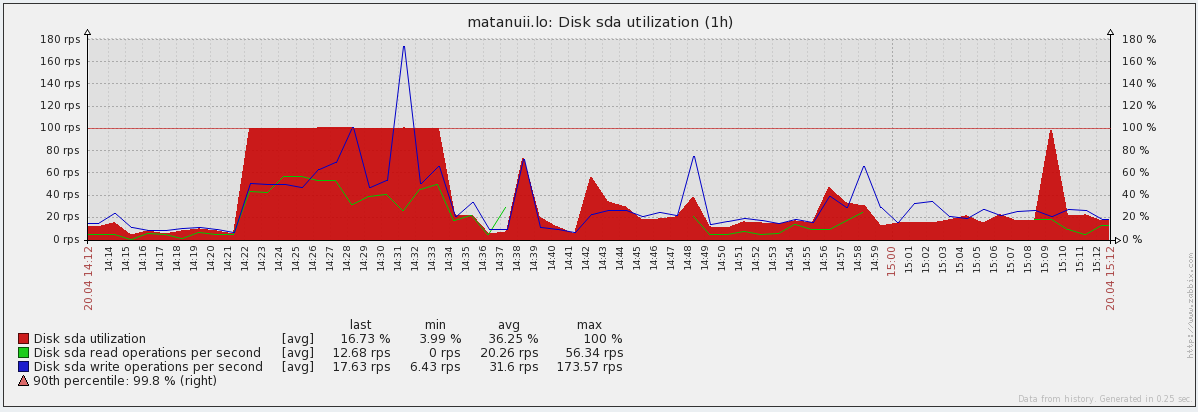
Utilization and IOPS graphs :
That's all, thanks for attention.
Well, according to tradition, taking this opportunity, I send my regards to Fedorov Sergey (Alekseevich) :)
What for?
The disk subsystem is one of the important subsystems of the server, and very much often depends on the level of load on the disk subsystem, for example, the speed of content delivery or how quickly the database will respond. This mainly applies to mail or file servers, database servers. In general, disk performance indicators need to be monitored. Based on the performance graphs of the disk subsystem, we can decide on the need to increase capacity long before the cock pecks. Yes, and just do it is useful to glance from release to release as the work of developers affects the level of workload.
Under the cut, about monitoring and how to configure.
Dependencies:
Monitoring is implemented through the zabbix agent and two utilities: awk and iostat (sysstat package). If awk comes with distributions by default, then iostat needs to be installed with the sysstat package (here special thanks to Sebastien Godard and colleagues).
Known limitations:
Monitoring requires sysstat starting from version 9.1.2, as there is a very important change: "Added r_await and w_await fields to iostat's extended statistics." So you should be careful, in some distributions, for example, in CentOS, a slightly “stable” and less featured version of sysstat.
If you start from the version of zabbix (2.0 or 2.2) then the question is not fundamental, it works on both versions. At 1.8 it does not work because Used Low level discovery.
Opportunities (purely subjective, with decreasing utility):
- Low level discovery (hereinafter simply LLD) for automatic detection of block devices on the monitored node;
- utilization of a block device in% - a convenient metric for tracking the total load on the device;
- latency or responsiveness - both general responsiveness and responsiveness on read / write operations are available;
- queue size (in requests) and average request size (in sectors) - allows you to evaluate the nature of the load and the degree of load on the device;
- current read / write speed to the device in human-readable kilobytes;
- the number of read / write requests (per second) combined when queuing for execution;
- iops - value of read / write operations per second;
- average request service time (svctm). In general, it is deprecated, the developers promise to cut it for a long time, but all the same hands do not reach.
In general, as you can see, all the metrics that are in iostat are available here (anyone who is unfamiliar with this utility, I highly recommend that you look into man iostat).
Available graphs:
Graphs are drawn per-device, LLD detects devices that fall under the regular expression "(xvd | sd | hd | vd) [az]", so if your drives have different names, you can easily make the appropriate changes. Such a regularity is made to detect devices that will be parent to other partitions, LVM volumes, MDRAID arrays, etc. In general, so as not to collect too much. A little distracted, so the list of graphs:
- Disk await - device responsiveness (r_await, w_await);
- Disk merges - merge operations in the queue (rrqm / s, wrqm / s);
- Disk queue - state of the queue (avgrq-sz, avgqu-sz);
- Disk read and write - current read / write values to the device (rkB / s, wkB / s);
- Disk utilization - disk utilization and IOPS value (% util, r / s, w / s) - makes it possible to track jumps in utilization quite well and by what means they were called by reading or writing.
Analogs and differences:
In zabbiks there are boxed options for similar monitoring, these are the keys vfs.dev.read and vfs.dev.write . They are good and work great, but less informative than iostat. For example, iostat has metrics such as latency and utilization.
There is also a similar template from Michael Noman, in my opinion there is only one difference, it is focused on older versions of iostat, well, + small syntax changes.
Where to get it:
So, monitoring consists of a configuration file for the agent, two scripts for collecting / receiving data and a template for the web interface. All this is available in the repository on Github., so in any available way (git clone, wget, curl, etc ...) we download them to the machines we want to monitor and go to the next step.
How to setup:
- iostat.conf - the contents of this file should be placed in the zabbix agent configuration file, or put in the configuration directory that is specified in the Include option of the main agent configuration. Vobschem depends on party policy. I use the second option, for custom configs I have a separate directory.
- scripts / iostat-collect.sh and scripts / iostat-parse.sh - these two working scripts should be copied to / usr / libexec / zabbix-extensions / scripts /. Here you can also use the placement convenient for you, but in this case, do not forget to correct the paths in the parameters defined in iostat.conf. Remember to check that they are executable (mode = 755).
Now everything is ready, start the agent and go to the monitoring server and execute the command (do not forget to replace agent_ip):
# zabbix_get -s agent_ip -k iostat.discovery
Thus, we check from the monitoring server that iostat.conf is loaded and gives information, at the same time we see that LLD is working. The response will return JSON with the names of the detected devices. If no answer came, then something was done wrong.
There is also such a point that the zabbix server does not wait for the execution of some items by agents (iostat.collect). To do this, increase the Timeout values.
How to configure the web interface:
Now the iostat-disk-utilization-template.xml template remains. Through the web interface, we import it into the templates section and assign it to our host. Everything is simple here. Now it remains to wait about one hour, this time is set in the LLD rule (also configurable). Or you can look in the Latest Data of the host being watched, in the Iostat section. As soon as the values appear there, you can go to the graphs section and observe the first data.
And finally, the top three screenshots of graphs from the localhost))):
Directly the data in Latest Data:
Latency graphs:
Utilization and IOPS graphs :
That's all, thanks for attention.
Well, according to tradition, taking this opportunity, I send my regards to Fedorov Sergey (Alekseevich) :)