Migrating a real-world application from standalone MySQL to Percona XtraDB Cluster

Unfortunately, there is quite a bit of information on the Internet on the migration of real-world applications and the production of Percona XtraDB Cluster (hereinafter referred to as PXC). I will try to correct this situation with my story and tell about our experience. There will be no step-by-step installation instructions and the article should be viewed not as a replacement for off-documentation, but as a collection of recommendations.
Problem
I work as a system administrator at ultimate-guitar.com . Since we provide a web service, we naturally have backends and databases, which is the core of the service. Uptime service directly depends on the performance of the database.
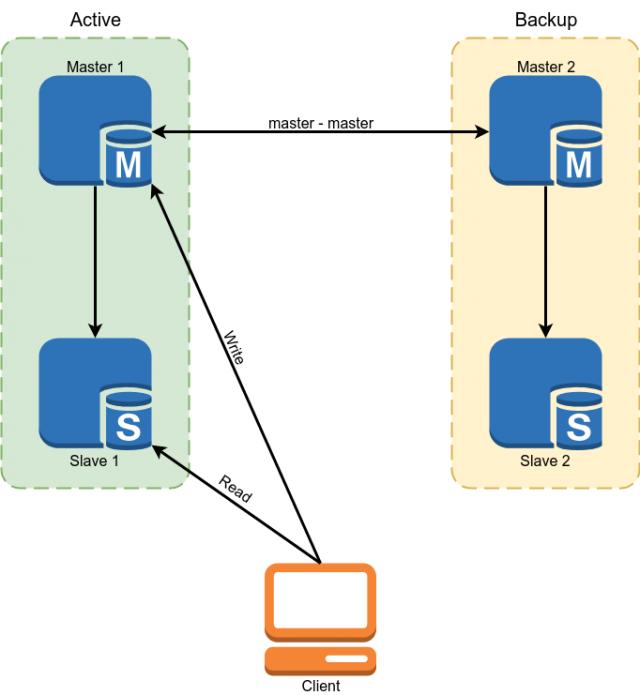
Percona MySQL 5.7 was used as the database. Redundancy has been implemented using the master replication scheme master. Slaves were used to read some data.
But this scheme did not suit us with the following minuses:
- Due to the fact that in MySQL replication, asynchronous slaves could lag behind indefinitely. All critical data had to be read from the master.
- From the previous paragraph follows the complexity of the development. The developer could not simply make a request to the database, but was obliged to think over whether he was ready in each specific case for the slave lag and if not, then read the data from the master.
- Manual switching in case of an accident. Automatic switching was problematic due to the fact that the MySQL architecture does not have built-in protection against split brain. I would have had to write the arbiter myself with the complex logic of the choice of master. When writing to both masters, there could be conflicts at the same time breaking the master replication and leading to the classic split brain.
Slightly dry numbers, so that you understand what we were working with:
Database size: 300 GB
QPS: ~ 10k
RW ratio: 96/4%
Configuration of master servers:
CPU: 2x E5-2620 v3
RAM: 128 Gb
SSD: Intel Optane 905p 960 Gb
Network: 1 Gb / s
We have a classic OLTP load with a large amount of reading, which needs to be done very quickly and a small amount of writing. The load on the database is quite small due to the fact that caching is actively used in Redis and Memcached.
Decision making
As you may have guessed from the title, we chose PXC, but here I will explain why we chose it.
We had 4 options:
- DBMS change
- MySQL Group Replication
- Screw the necessary functionality by using scripts on top of the master replication master.
- MySQL Galera cluster (or its fork, for example PXC)
The option to change the database was practically not considered, since the application is large, in many places it is tied to the functionality or syntax of mysql and, for example, migration to PostgreSQL will take a lot of time and resources.
The second option was MySQL Group Replication. Its undoubted advantage is that it develops in the vanilla MySQL branch, which means that in the future it will be widely distributed and will have a large pool of active users.
But he has a few drawbacks. Firstly, it imposes more restrictions on the application and database schema, which means it will be more difficult to migrate. Secondly, Group Replication solves the problem of fault tolerance and the split brain, but replication in a cluster is still asynchronous.
The third option, we also did not like too much for too many bicycles, which we will inevitably have to implement in solving the problem in this way.
Galera made it possible to completely solve the MySQL fault tolerance problem and partially solve the problem of the relevance of data on the slaves. Partially, because replication asynchrony is preserved. After a transaction is committed on the local node, the changes are spilled onto the other nodes asynchronously, but the cluster makes sure that the nodes are not far behind and if they start to lag, then it artificially slows down the work. The cluster ensures that after a transaction commit, no one can commit conflicting changes even on a node that has not yet replicated the changes.
After migration, the scheme of our database should look like this:
Migration
Why migration is the second item after choosing a solution? It's simple - the cluster contains a number of requirements that the application and the database must follow and we need to fulfill them before the migration.
- InnoDB engine for all tables. MyISAM, Memory and other backends are not supported. The fix is quite simple - we convert all the tables in InnoDB.
- Binlog in ROW format. The cluster does not require binlog for work and if you do not need classic slaves, then you can turn it off, but the binlog format should be ROW.
- All tables must have a PRIMARY / FOREIGN KEY. This is required for proper concurrent writing to the same table from different nodes. For those tables that do not contain a unique key, you can use a composite Primary key or auto increment.
- Do not use 'LOCK TABLES', 'GET_LOCK () / RELEASE_LOCK ()', 'FLUSH TABLES {{table}} WITH READ LOCK' or the isolation level 'SERIALIZABLE' for transactions.
- Do not use 'CREATE TABLE ... AS SELECT' queries , since they combine schema and data changes. It is easily divided into 2 queries, the first of which creates a table, and the second fills with data.
- Do not use 'DISCARD TABLESPACE' and 'IMPORT TABLESPACE' , because they are not replicated
- Set the 'innodb_autoinc_lock_mode' options to '2'. This option may damage data when working with STATEMENT replication, but since the cluster is allowed to use only ROW replication, there will be no problems.
- As a 'log_output', only 'FILE' is supported. If you have a log entry was kept in the table, you will have to remove it.
- XA transactions are not supported. If they were used, you will have to rewrite the code without them.
I should note that almost all of these restrictions can be removed if you set the variable 'pxc_strict_mode = PERMISSIVE', but if you value your data, then it is better not to. If you have 'pxc_strict_mode = ENFORCING' set, then MySQL will not let you perform the above operations or will not let you start the node.
After we have fulfilled all the requirements for the database and have thoroughly tested the work of our application in dev environment, we can proceed to the next stage.
Cluster Deployment and Configuration
We have several databases running on the database servers and other databases do not need to be migrated to the cluster. But the MySQL cluster package replaces classic mysql. We had several solutions to this problem:
- Use virtualization and run a cluster in the VM. We did not like this option because of the large (compared to the others) overhead and the appearance of another entity that needs to be serviced.
- Build your version of the package, which will put mysql in a nonstandard place. Thus, it will be possible to have several versions of mysql on one server. A good option if you have a lot of servers, but the constant support of your package, which must be regularly updated can take quite a lot of time.
- Use Docker.
We chose Docker, but we use it in a minimal way. Local data are used for data storage. Uses the '--net host' operating mode to reduce network delays and CPU load.
We also had to build our version of the Docker image. The reason is that the standard Percona image does not support restoring positions at startup. This means that each time the instance is restarted, it is not a fast IST synchronization that only floods the necessary changes, but a slow SST that completely reloads the base.
Another issue is the size of the cluster. In a cluster, each node stores the entire data set. Therefore, reading scales well with increasing cluster size. With the record, the situation is reversed - when committing, each transaction is validated for the absence of conflicts on all nodes. Naturally, the more nodes, the more time a commit will take.
Here we also have several options:
- 2 nodes + arbitrator. 2 nodes + arbitrator. A good option for tests. At the time of deployment of the second node on the master should not be recorded.
- 3 nodes. The classic option. Balance of speed and reliability. Please note that in this configuration one node should pull out the entire load, since at the time of adding the third node will be the second donor.
- 4+ nodes. With an even number of nodes, an arbiter must be added to avoid the split-brain. An option that is well suited for a very large amount of reading. The reliability of the cluster also grows.
We have so far stopped at the version with 3 nodes.
The cluster configuration almost completely copies the standalone MySQL configuration and differs in only a few options:
“wsrep_sst_method = xtrabackup-v2” This option specifies how to copy the nodes. Other options are mysqldump and rsync, but they block the node for the duration of the copy. I see no reason to use a non-“xtrabackup-v2” copy method.
"Gcache"This is an analogue of cluster binlog. It is a circular buffer (in a file) of a fixed size in which all changes are recorded. If you turn off one of the nodes in the cluster, and then turn it back on, it will try to read the missing changes from Gcache (IST sync). If there are no changes needed in it, then a full reloading of the node is required (SST synchronization). The size of gcache is set as follows: wsrep_provider_options = 'gcache.size = 20G;'.
wsrep_slave_threadsIn contrast to classic replication in a cluster, it is possible to apply several “write sets” to one database in parallel. This option indicates the number of workers applying the changes. It is better not to leave the default value 1, since during the use of a large write set by the worker, the rest will wait in the queue and node replication will begin to lag behind. Some people advise setting this parameter to 2 * CPU THREADS, but I think it is necessary to look at the number of parallel write operations you have.
We stopped at a value of 64. With a smaller value, the cluster sometimes did not have time to apply all write sets from the queue during load spikes (for example, when launching heavy crowns).
wsrep_max_ws_sizeThe size of a single transaction in a cluster is limited to 2 GB. But large transactions do not fit into the concept of PXC. It is better to complete 100 transactions of 20 MB each than one for 2 GB. Therefore, we first limited the size of the transaction in the cluster to 100 MB, and then reduced the limit to 50 MB.
If you have strict mode enabled, you can set the variable " binlog_row_image " to "minimal". This will reduce the size of the entries in the binlog several times (10 times in the test from Percona). This will save disk space and allow transactions that did not fit into the limit with “binlog_row_image = full”.
Limits for SST.For Xtrabackup, which is used to fill the nodes, you can set a limit on network usage, the number of streams and the method of compression. This is necessary to ensure that the donor server does not start to slow down when filling the node. To do this, the “sst” section is added to the my.cnf file:
[sst]
rlimit = 80m
compressor = "pigz -3"
decompressor = "pigz -dc"
backup_threads = 4
We limit the copy speed to 80 MB / sec. For compression use pigz, this is a multi-threaded version of gzip.
GTID If you use classic slaves, then I recommend to enable GTID on the cluster. This will allow you to connect the slave to any node of the cluster without reloading the slave.
Additionally, I want to talk about 2 cluster mechanisms, their meaning and configuration.
Flow control
Flow control is a way to manage the write load on a cluster. It does not allow nodes to lag too far in replication. Thus, "almost synchronous" replication is achieved. The mechanism of operation is quite simple - as soon as the node has a queue for receiving it reaches the set value, it sends the message “Flow control pause” to the other nodes, which tells them to wait until the new transaction commits until the lagging node finishes the queue .
From here several things follow:
- Recording in a cluster will occur at the speed of the slowest node. (But this can be tweaked.)
- If you have a lot of conflict when committing transactions, then you can adjust Flow Control more aggressively, which should reduce their number.
- The maximum node lag in a cluster is a constant, not in time, but in the number of transactions in the queue. The time lag depends on the average transaction size and the number of wsrep_slave_threads.
You can view the Flow control settings as follows: First of all, we are interested in the “wsrep_flow_control_interval_high” parameter. It adjusts the queue length at which FC pause is turned on. This parameter is calculated by the formula: gcs.fc_limit * √N (where N = the number of nodes in the cluster.). The second parameter is “wsrep_flow_control_interval_low”. It is responsible for the value of the queue length, after which the FC is turned off. It is calculated by the formula: wsrep_flow_control_interval_high * gcs.fc_factor. By default, gcs.fc_factor = 1. Thus, by changing the queue length, we can manage the replication lag. Reducing the queue length will increase the time the cluster spends in FC pause, but it will reduce the lag of nodes. You can set the session variable " wsrep_sync_wait
mysql> SHOW GLOBAL STATUS LIKE 'wsrep_flow_control_interval_%';

wsrep_flow_control_interval_low | 36

wsrep_flow_control_interval_high | 71
= 7 ". This will force the PXC to execute read or write requests only after all write-sets in the current queue have been applied. Naturally, this will increase the latency of requests. Increasing latency is directly proportional to the queue length.
It is also desirable to reduce the maximum transaction size to the minimum possible would not accidentally skip long transactions.
EVS or Auto Evict
This mechanism allows you to throw out the nodes with which intermittent communication (for example, packet loss or long delays) or which respond slowly. Thanks to him, the problems of communication with one node will not put the entire cluster, and allow you to disable the node and continue to work in normal mode. This mechanism can be especially useful when operating a cluster via WAN or non-controlled sections of the network. By default, EVS is turned off.
To enable it, you need to add the option “evs.version = 1;” and “evs.auto_evict = 5;” to the wsrep_provider_options parameter (the number of operations after which the node is turned off. A value of 0 turns off EVS.) EVS:
- evs.delayed_margin The time the node is allotted to respond. By default 1 sec., But when working in a local network, it can be reduced to 0.05-0.1 sec or below.
- evs.inactive_check_period Check period. Default 0.5 sec
In fact, the time that a node can work on problems before an EVS triggers is evs.inactive_check_period * evs.auto_evict. You can also set "evs.inactive_timeout" and the node that did not respond this time will be immediately thrown out, by default 15 seconds.
An important caveat is that this mechanism will not return the node itself when the connection is restored. It must be restarted by hand.
We set up EVS at home, but we haven’t had a chance to test it in combat.
Load balancing
In order for clients to use the resources of each node evenly, and to perform queries only on the live nodes of the cluster, we need a load balancer. Percona offers 2 solutions:
- ProxySQL. This is L7 proxy for MySQL.
- Haproxy. But Haproxy does not know how to check the status of a cluster node and determine whether it is ready to execute queries. To solve this problem it is proposed to use an additional percona-clustercheck script .
At first, we wanted to use ProxySQL, but after testing the performance, it turned out that by latency it loses Haproxy by about 15-20% even when using the fast_forward mode (in this mode query rewrite, routing and many other ProxySQL functions do not work, requests are proxied as-is) .
Haproxy is faster, but Percona has a few drawbacks.
First, it is written in bash, which does not contribute to its customization. A more serious problem is that it does not cache the result of the MySQL check. Thus, if we have 100 clients, each of which checks the status of the node once every 1 second, the script will make a request to MySQL every 10 ms. If, for some reason, MySQL starts to work slowly, the verification script will start creating a huge number of processes, which will not exactly improve the situation.
It was decided to write my own solution in which the MySQL status check and the Haproxy response are not related to each other. The script checks the status of the node in the background at regular intervals and caches the result. The web server gives Haproxy the cached result.
Haproxy configuration example
В данном примере приведена конфигурация с одним мастером. Остальные сервера кластера работают в качестве слейвов.
listen db

 bind 127.0.0.1:3302

 mode tcp

 balance first

 default-server inter 200 rise 6 fall 6

 option httpchk HEAD /

 server node1 192.168.0.1:3302 check port 9200 id 1

 server node2 192.168.0.2:3302 check port 9200 backup id 2

 server node3 192.168.0.3:3302 check port 9200 backup id 3


listen db_slave

 bind 127.0.0.1:4302

 mode tcp

 balance leastconn

 default-server inter 200 rise 6 fall 6

 option httpchk HEAD /

 server node1 192.168.0.1:3302 check port 9200 backup

 server node2 192.168.0.2:3302 check port 9200

 server node3 192.168.0.3:3302 check port 9200
В данном примере приведена конфигурация с одним мастером. Остальные сервера кластера работают в качестве слейвов.
Monitoring
To monitor the status of the cluster, we used Prometheus + mysqld_exporter and Grafana to visualize the data. Since mysqld_exporter collects a bunch of metrics to create dashboards on your own rather tedious. You can take ready-made dashboards from Percona and customize them for yourself.
We also use Zabbix to collect the main cluster metrics and alerting.
The main cluster metrics that are desirable to monitor:
- wsrep_cluster_status On all nodes, the value should be “Primary”. If the value is “non-primary”, then this node has lost connection with the cluster quorum.
- wsrep_cluster_size The number of nodes in the cluster. This also includes "lost" nodes that should be in a cluster, but for some reason not available. When the node is turned off gently, the value of this variable decreases.
- wsrep_local_state Indicates whether the node is an active member of the cluster and is ready to work.
- wsrep_evs_state An important parameter if you have the Auto Eviction mechanism enabled (disabled by default). This variable indicates that EVS considers this node healthy.
- wsrep_evs_evict_list A list of nodes that have been thrown out of EVS from the cluster. Normally, the list should be empty.
- wsrep_evs_delayed List of candidates for deletion by EVS. Must also be empty.
Key performance metrics:
- wsrep_evs_repl_latency Shows (minimum / average / maximum / station deviation / packet size) delay communication within the cluster. That is, it measures network latency. Increasing values may indicate network congestion or cluster nodes. This metric is recorded even when EVS is off.
- wsrep_flow_control_paused_ns Time (in ns) since the launch of the node, which she spent in Flow control pause. Ideally, it should be 0. The growth of this parameter indicates a cluster performance problem or a lack of “wsrep_slave_threads”. It is possible to determine which node can be slowed down by the " wsrep_flow_control_sent " parameter .
- wsrep_flow_control_paused The percentage of time since the last execution of “FLUSH STATUS;” that the node spent in Flow control pause. Also, like the previous variable should tend to zero.
- wsrep_flow_control_status Shows whether the Flow Control is currently running. On the initiating FC pause node, the value of this variable will be ON.
- wsrep_local_recv_queue_avg The average length of the queue to receive. The growth of this parameter indicates problems with node performance.
- wsrep_local_send_queue_avg The average length of a send queue. The growth of this parameter indicates the problems with network performance.
There are no universal recommendations on the values of these parameters. It is clear that they should tend to zero, but on a real load, this is likely to be wrong and you will have to determine for yourself where the boundary of the normal state of the cluster lies.
Backup
Cluster backup is almost the same as standalone mysql. For production use, we have several options.
- Remove a backup from one of the “profitable” nodes with xtrabackup. The easiest option, but during the backup, the cluster performance will sink.
- Use classic slaves and take backups from the replica.
The backups from standalone and from the cluster version created using xtrabackup are portable between each other. That is, the backup taken from the cluster can be deployed to standalone mysql and vice versa. Naturally a major version of MySQL should be the same, preferably a minor one. Backups made using mysqldump are naturally portable too.
The only caveat is that after deploying the backup, you need to run the mysql_upgrade script that will check and correct the structure of some system tables.
Data migration
Now that we’ve figured out how to configure, monitor, and other things, you can start migrating on the sale.
Migration of data in our scheme was quite simple, but we got a little messy;).
Legend - master 1 and master 2 are linked by master replication. The recording goes only to master 1. Master 3 is a clean server.
Our migration plan (in the plan, I will omit the operations with the slaves for simplicity and will only talk about the master servers).
Attempt 1
- We remove the database backup from wizard 1 using xtrabackup.
- Copy the backup to master 3 and start the cluster in single-node mode.
- Set up master replication between masters 3 and 1.
- We switch read and write to master 3. We check the operation of the application.
- On wizard 2, turn off replication and start cluster MySQL. We are waiting for him to copy the database from master 3. During the copying, we had a cluster of one node in the “Donor” status and one still not working node. During copying, we got a bunch of locks and in the end both nodes fell with an error (the creation of a new node cannot be completed due to dead locks). This little experiment cost us four minutes of downtime.
- Switch read and write back to master 1.
The migration did not work because when testing the circuit in a dev environment, there was practically no write traffic to the database, and if the same circuit was repeated, problems got out under load.
We changed the migration scheme a bit to avoid these problems and tried again, on the 2nd time successfully;).
Attempt 2
- Restart master 3 so that it works again in single-node mode.
- Re-raise on the master 2 cluster MySQL. At the moment, only the replication traffic was sent to the cluster, so there were no repetition of problems with locks and the second node was successfully added to the cluster.
- Again we switch reading and writing to master 3. We check the operation of the application.
- Turning off master replication with master 1. Turning on master 1 cluster mysql and wait until it starts. In order not to step on the same rake, it is important that Donor does not write the application to the node (details in the section about load balancing). After launching the third node, we will have a fully functional cluster of three nodes.
- You can remove a backup from one of the cluster nodes and create the number of classic slaves you need.
The difference between the second scheme and the first one is that we switched the traffic to the cluster only after raising the second node in the cluster.
This procedure took about 6 hours.
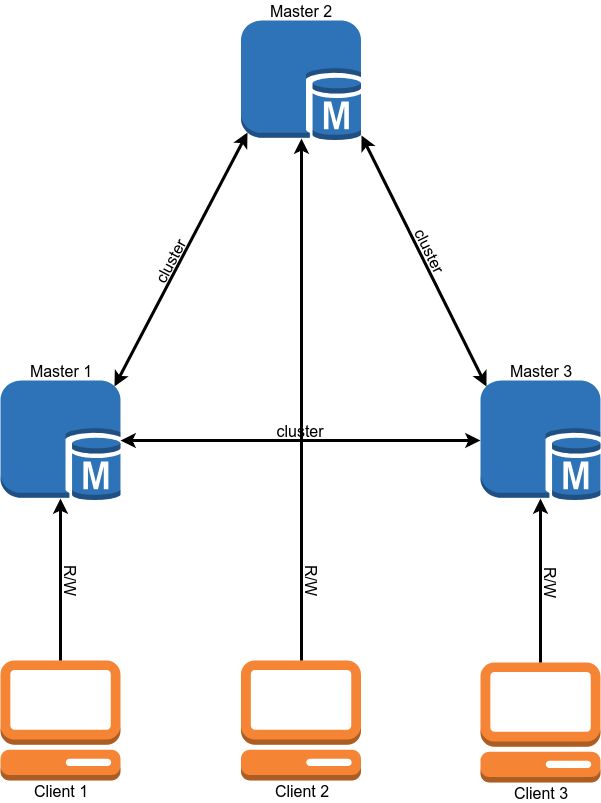
Multi-master
After the migration, our cluster worked in the single-master mode, that is, the entire record went to one of the servers, and the rest was only read data.
After switching production to multi-master mode, we ran into a problem - transaction conflicts occurred much more often than we expected. It was especially bad with queries that change many records, for example, update the value of all records in a table. Those transactions that were successfully performed on the same node in series on the cluster are executed in parallel and the longer transaction receives a deadlock error. I will not pull, after several attempts to fix it at the application level, we abandoned the idea with a multi-master.
Other nuances
- A cluster can be a slave. When using this function, I recommend adding to the config of all nodes except the one that is the slave option “skip_slave_start = 1”. Otherwise, each new node will start replication from the wizard, which will cause either replication errors or data corruption on the replica.
- As I said, Donor node can not normally serve customers. It must be remembered that in a cluster of three nodes situations are possible when one node has flown out, the second is a donor and only one node remains for customer service.
findings
After migration and some time of operation, we came to the following conclusions.
- The Galera cluster works and is fairly stable (at least until there are abnormal node drops or there is no abnormal behavior). In terms of resiliency, we got exactly what we wanted.
- Percona's multi-master applications are primarily marketing. Yes, it is possible to use the cluster in this mode, but this will require a deep rework of the application for this usage model.
- There is no synchronous replication, but now we control the maximum lag of the nodes (in transactions). Together with the limitation of the maximum transaction size of 50 MB, we can fairly accurately predict the maximum lag time of the nodes. Developers become easier to write code.
- In monitoring, we observe short-term peaks in the growth of the replication queue. The reason is our 1 Gbit / s network. It is possible to operate a cluster on such a network, but there are problems when a load spikes. Now we are planning to upgrade the network to 10 Gbit / s.
Total of the three "hotelok" we received about one and a half. The most important requirement is fault tolerance.
Our PXC configuration file for those interested in:
my.cnf
[mysqld]

#Main

server-id = 1

datadir = /var/lib/mysql

socket = mysql.sock

port = 3302

pid-file = mysql.pid

tmpdir = /tmp

large_pages = 1

skip_slave_start = 1

read_only = 0

secure-file-priv = /tmp/


#Engine

innodb_numa_interleave = 1

innodb_flush_method = O_DIRECT

innodb_flush_log_at_trx_commit = 2

innodb_file_format = Barracuda

join_buffer_size = 1048576

tmp-table-size = 512M

max-heap-table-size = 1G

innodb_file_per_table = 1

sql_mode = "NO_ENGINE_SUBSTITUTION,NO_AUTO_CREATE_USER,ERROR_FOR_DIVISION_BY_ZERO"

default_storage_engine = InnoDB

innodb_autoinc_lock_mode = 2


#Wsrep

wsrep_provider = "/usr/lib64/galera3/libgalera_smm.so"

wsrep_cluster_address = "gcomm://192.168.0.1:4577,192.168.0.2:4577,192.168.0.3:4577"

wsrep_cluster_name = "prod"

wsrep_node_name = node1

wsrep_node_address = "192.168.0.1"

wsrep_sst_method = xtrabackup-v2

wsrep_sst_auth = "USER:PASS"

pxc_strict_mode = ENFORCING

wsrep_slave_threads = 64

wsrep_sst_receive_address = "192.168.0.1:4444"

wsrep_max_ws_size = 50M

wsrep_retry_autocommit = 2

wsrep_provider_options = "gmcast.listen_addr=tcp://192.168.0.1:4577; ist.recv_addr=192.168.0.1:4578; gcache.size=30G; pc.checksum=true; evs.version=1; evs.auto_evict=5; gcs.fc_limit=80; gcs.fc_factor=0.75; gcs.max_packet_size=64500;"


#Binlog

expire-logs-days = 4

relay-log = mysql-relay-bin

log_slave_updates = 1

binlog_format = ROW

binlog_row_image = minimal

log_bin = mysql-bin

log_bin_trust_function_creators = 1


#Replication

slave-skip-errors = OFF

relay_log_info_repository = TABLE

relay_log_recovery = ON

master_info_repository = TABLE

gtid-mode = ON

enforce-gtid-consistency = ON


#Cache

query_cache_size = 0

query_cache_type = 0

thread_cache_size = 512

table-open-cache = 4096

innodb_buffer_pool_size = 72G

innodb_buffer_pool_instances = 36

key_buffer_size = 16M


#Logging

log-error = /var/log/stdout.log

log_error_verbosity = 1

slow_query_log = 0

long_query_time = 10

log_output = FILE

innodb_monitor_enable = "all"


#Timeout

max_allowed_packet = 512M

net_read_timeout = 1200

net_write_timeout = 1200

interactive_timeout = 28800

wait_timeout = 28800

max_connections = 22000

max_connect_errors = 18446744073709551615

slave-net-timeout = 60


#Static Values

ignore_db_dir = "lost+found"


[sst]

rlimit = 80m

compressor = "pigz -3"

decompressor = "pigz -dc"

backup_threads = 8
Sources and useful links
→ Our Docker image
→ Percona XtraDB Cluster 5.7 Documentation
→ Monitoring Cluster Status - Galera Cluster Documentation
→ Galera Status Variables - Galera Cluster Documentation
Only registered users can participate in the survey. Sign in , please.