Hungarian algorithm, or how mathematics helps in assigning assignments
- Tutorial
Hello friends! In this article I would like to tell you about an interesting algorithm from the discipline “Research of operations”, namely about the Hungarian method and how to solve assignment problems with it. I’ll touch on the theory about in which cases and for what tasks this algorithm is applied, step by step I will analyze it on my fictional example, and share my modest sketch of its implementation code in R. Let us proceed!

In order not to paint a lot of theory with mathematical terms and definitions, I propose to consider a couple of options for constructing an assignment problem, and I think you will immediately understand when the Hungarian method is applicable:
As you can see, there are many options for which the Hungarian method is applicable, and similar tasks arise in many areas of activity.
As a result, the task must be solved so that one performer (person, machine, instrument, ...) can perform only one job, and each job is performed by only one performer.
A necessary and sufficient condition for solving a problem is its closed type. Those. when the number of performers = the number of jobs (N = M). If this condition is not met, then you can add fictional performers, or fictional works for which the values in the matrix will be zero. It will not affect the solution of the problem in any way, it will only give it the necessary closed type.
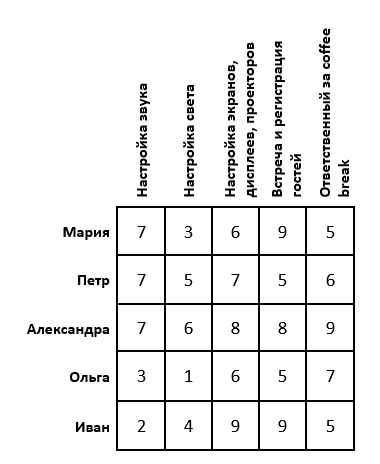
Problem Statement: Let an important scientific conference be scheduled. To conduct it, you need to adjust the sound, light, images, register guests and prepare for the breaks between performances. For this task there are 5 organizers. Each of them has certain estimates of the performance of this or that work (suppose that these estimates are set as an arithmetic average of the feedback from their employees). It is necessary to distribute the organizers so that their total score was maximum. The task is as follows:
If the problem is solved for a maximum (as in our case), then in each row of the matrix it is necessary to find the maximum element, subtract it from each element of the corresponding row and multiply the entire matrix by -1. If the problem is solved at a minimum, then this step should be skipped.
Each row and each column must contain only one selected zero. (i.e., when we chose zero, the remaining zeros in this line or in this column are no longer taken into account). In this case, it is impossible to do this:
( If the problem is solved at a minimum, then you must start with this step ). We continue the decision further. Reduction of a matrix in the lines (we look for the minimum element in each line and we subtract it from each element respectively):

Because all minimal elements are zero, the matrix has not changed. We carry out the reduction in columns:
Again, we see that in each column and in each row there is only one selected zero. As can be seen below, in this case it is impossible to do. Presented two options for how to select zeros, but none of them gave the desired result:
We continue the decision further. We delete the rows and columns that contain zero elements ( IMPORTANT! The number of deletions should be minimal ). Among the remaining elements, we look for the minimum, subtract it from the remaining elements (which are not crossed out) and add to the elements that are located at the intersection of crossed out lines and columns (what is marked in green - there we deduct; what is marked in golden - we summarize there; what is not painted over - do not touch):
As you can see, there is only one selected zero in each column and row. We complete the solution of the problem!
Substitute in the initial table the location of the selected zeros. Thus, we get the optimum, or the optimal plan, in which the organizers are distributed by work and the sum of marks turned out to be maximum:
If you solve the problem and you still cannot select zeros so that there is only one in each column and row, then we repeat the algorithm from the place where the row reduction was performed (the minimum element in each row).
Hungarian algorithm implemented using recursion. I will hope that my code will not cause difficulties. First you need to compile the three functions, and then start the calculations.
The data for solving the problem are taken from the file example.csv which looks like:

The result of the program:


Thank you so much for taking the time to read my article. All references will be provided below. I hope you have learned something new for yourself or updated old knowledge. All success, good luck and good luck!
1. Stormed Wikipedia
2. And other good sites
3. Stressed for myself some information from this article
A few words about the method
In order not to paint a lot of theory with mathematical terms and definitions, I propose to consider a couple of options for constructing an assignment problem, and I think you will immediately understand when the Hungarian method is applicable:
- The task of appointing employees to positions. It is necessary to distribute the employees to positions in such a way as to achieve maximum efficiency, or to have minimal labor costs.
- Appointment of machines on the production section. The distribution of machines so that during their work the production was the most profitable, or the cost of maintaining them is minimal.
- Selection of candidates for different vacancies by estimates. This example will be discussed below.
As you can see, there are many options for which the Hungarian method is applicable, and similar tasks arise in many areas of activity.
As a result, the task must be solved so that one performer (person, machine, instrument, ...) can perform only one job, and each job is performed by only one performer.
A necessary and sufficient condition for solving a problem is its closed type. Those. when the number of performers = the number of jobs (N = M). If this condition is not met, then you can add fictional performers, or fictional works for which the values in the matrix will be zero. It will not affect the solution of the problem in any way, it will only give it the necessary closed type.
Step-by-step algorithm by example
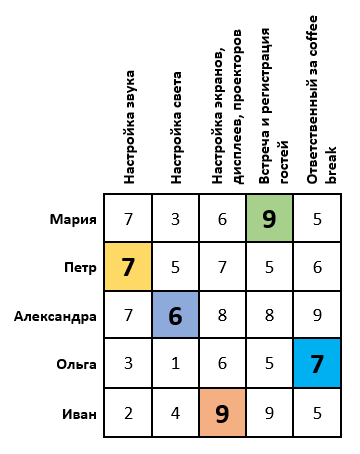
Problem Statement: Let an important scientific conference be scheduled. To conduct it, you need to adjust the sound, light, images, register guests and prepare for the breaks between performances. For this task there are 5 organizers. Each of them has certain estimates of the performance of this or that work (suppose that these estimates are set as an arithmetic average of the feedback from their employees). It is necessary to distribute the organizers so that their total score was maximum. The task is as follows:
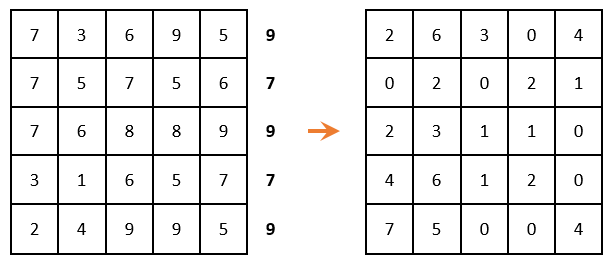
If the problem is solved for a maximum (as in our case), then in each row of the matrix it is necessary to find the maximum element, subtract it from each element of the corresponding row and multiply the entire matrix by -1. If the problem is solved at a minimum, then this step should be skipped.
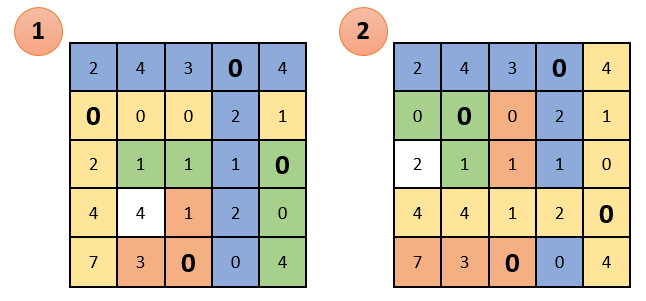
Each row and each column must contain only one selected zero. (i.e., when we chose zero, the remaining zeros in this line or in this column are no longer taken into account). In this case, it is impossible to do this:
( If the problem is solved at a minimum, then you must start with this step ). We continue the decision further. Reduction of a matrix in the lines (we look for the minimum element in each line and we subtract it from each element respectively):
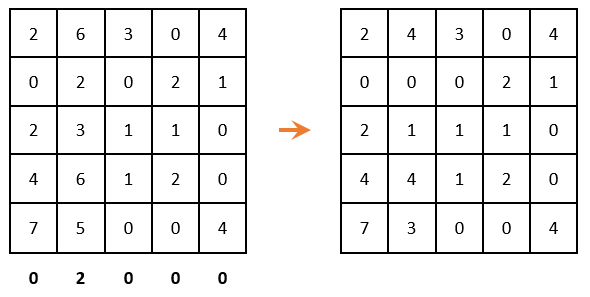
Because all minimal elements are zero, the matrix has not changed. We carry out the reduction in columns:
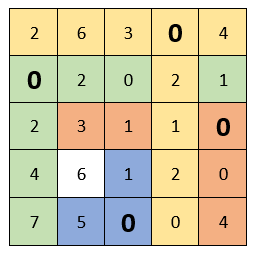
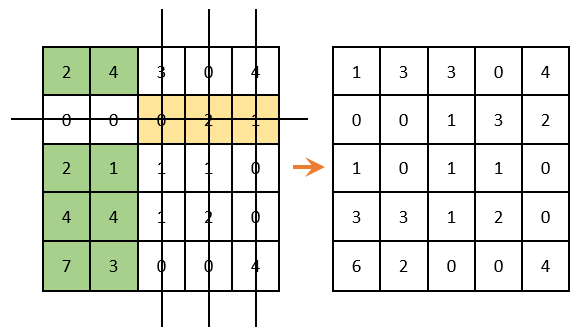
Again, we see that in each column and in each row there is only one selected zero. As can be seen below, in this case it is impossible to do. Presented two options for how to select zeros, but none of them gave the desired result:
We continue the decision further. We delete the rows and columns that contain zero elements ( IMPORTANT! The number of deletions should be minimal ). Among the remaining elements, we look for the minimum, subtract it from the remaining elements (which are not crossed out) and add to the elements that are located at the intersection of crossed out lines and columns (what is marked in green - there we deduct; what is marked in golden - we summarize there; what is not painted over - do not touch):
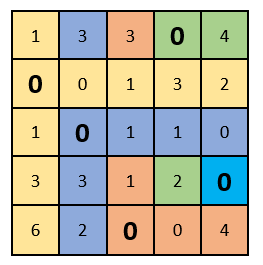
As you can see, there is only one selected zero in each column and row. We complete the solution of the problem!
Substitute in the initial table the location of the selected zeros. Thus, we get the optimum, or the optimal plan, in which the organizers are distributed by work and the sum of marks turned out to be maximum:
If you solve the problem and you still cannot select zeros so that there is only one in each column and row, then we repeat the algorithm from the place where the row reduction was performed (the minimum element in each row).
Implementation in the R programming language
Hungarian algorithm implemented using recursion. I will hope that my code will not cause difficulties. First you need to compile the three functions, and then start the calculations.
The data for solving the problem are taken from the file example.csv which looks like:
The code added to the spoiler for the article would be too big because of him
#Подключаем библиотеку для удобства расчетовlibrary(dplyr)
#Считываем csv фаил (первый столбик - названия строк; первая строка - названия столбцов)table <- read.csv("example.csv",header=TRUE,row.names=1,sep=";")
#Проводим расчетыunique_index <- hungarian_algorithm(table,T)
#Выводимcat(paste(row.names(table[as.vector(unique_index$row),])," - ",names(table[as.vector(unique_index$col)])),sep = "\n")
#Считаем оптимальный планcat("Оптимальное значение -",sum(mapply(function(i, j) table[i, j], unique_index$row, unique_index$col, SIMPLIFY = TRUE)))
#____________________Алгоритм венгерского метода__________________________________hungarian_algorithm <- function(data,optim=F){
#Если optim = T, то будет искаться максимальное оптимальное значениеif(optim==T)
  {
    data <- data %>%
      apply(1,function(x) (x-max(x))*(-1)) %>%
      t() %>%
      as.data.frame()
    optim <- F
  }#Редукция матрицы по строкамdata <- data %>%
    apply(1,function(x) x-min(x)) %>%
    t() %>%
    as.data.frame()#Нахождение индексов всех нулей
  zero_index <- which(data==0, arr.ind = T)#Нахождение всех "неповторяющихся" нулей слева-направо
  unique_index <- from_the_beginning(zero_index)
#Если количество "неповторяющихся" нулей не равняется количеству строк в исходной таблице, то..if(nrow(unique_index)!=nrow(data))#..Ищем "неповторяющиеся" нули справа-налево
    unique_index <- from_the_end(zero_index)
#Если все еще не равняется, то продолжаем алгоритм дальшеif(nrow(unique_index)!=nrow(data))
  {
#Редукция матрицы по столбцамdata <- data %>%
      apply(2,function(x) x-min(x)) %>%
      as.data.frame()
    zero_index <- which(data==0, arr.ind = T)
    unique_index <- from_the_beginning(zero_index)
    if(nrow(unique_index)!=nrow(data))
      unique_index <- from_the_end(zero_index)
    if(nrow(unique_index)!=nrow(data))
    {
#"Вычеркиваем" строки и столбцы которые содержат нулевые элементы (ВАЖНО! количество вычеркиваний должно быть минимальным)
      index <- which(apply(data,1,function(x) length(x[x==0])>1))
      index2 <- which(apply(data[-index,],2,function(x) length(x[x==0])>0))#Среди оставшихся элементов ищем минимальный
      min_from_table <- min(data[-index,-index2])#Вычитаем минимальный из оставшихся элементовdata[-index,-index2] <- data[-index,-index2]-min_from_table#Прибавляем к элементам, расположенным на пересечении вычеркнутых строк и столбцовdata[index,index2] <- data[index,index2]+min_from_table
      zero_index <- which(data==0, arr.ind = T)
      unique_index <- from_the_beginning(zero_index)
      if(nrow(unique_index)!=nrow(data))
        unique_index <- from_the_end(zero_index)
#Если все еще количество "неповторяющихся" нулей не равняется количеству строк в исходной таблице, то..if(nrow(unique_index)!=nrow(data))#..Повторяем весь алгоритм заново
        hungarian_algorithm(data,optim)else#Выводим индексы "неповторяющихся" нулей
        unique_index
    }
    else#Выводим индексы "неповторяющихся" нулей
      unique_index
  }
  else#Выводим индексы "неповторяющихся" нулей
    unique_index
}
#_________________________________________________________________________________#__________Функция для нахождения "неповторяющихся" нулей слева-направо___________from_the_beginning <- function(x,i=0,j=0,index = data.frame(row=numeric(),col=numeric())){
#Выбор индексов нулей, которые не лежат на строках i, и столбцах jfind_zero <- x[(!x[,1] %in% i) & (!x[,2] %in% j),]
  if(length(find_zero)>2){
#Записываем индекс строки в векторi <- c(i,as.vector(find_zero[1,1]))
#Записываем индекс столбца в векторj <- c(j,as.vector(find_zero[1,2]))
#Записываем индексы в data frame (это и есть индексы уникальных нулей)index <- rbind(index,setNames(as.list(find_zero[1,]), names(index)))
#Повторяем пока не пройдем по всем строкам и столбцамfrom_the_beginning(find_zero,i,j,index)}else
    rbind(index,find_zero)
}
#_________________________________________________________________________________#__________Функция для нахождения "неповторяющихся" нулей справа-налево___________from_the_end <- function(x,i=0,j=0,index = data.frame(row=numeric(),col=numeric())){
  find_zero <- x[(!x[,1] %in% i) & (!x[,2] %in% j),]
  if(length(find_zero)>2){
    i <- c(i,as.vector(find_zero[nrow(find_zero),1]))
    j <- c(j,as.vector(find_zero[nrow(find_zero),2]))
    index <- rbind(index,setNames(as.list(find_zero[nrow(find_zero),]), names(index)))
    from_the_end(find_zero,i,j,index)}else
    rbind(index,find_zero)
}
#_________________________________________________________________________________
The result of the program:
In conclusion
Thank you so much for taking the time to read my article. All references will be provided below. I hope you have learned something new for yourself or updated old knowledge. All success, good luck and good luck!
Resources used
1. Stormed Wikipedia
2. And other good sites
3. Stressed for myself some information from this article