pChart - build graphs and charts in PHP. Practice
Hello!
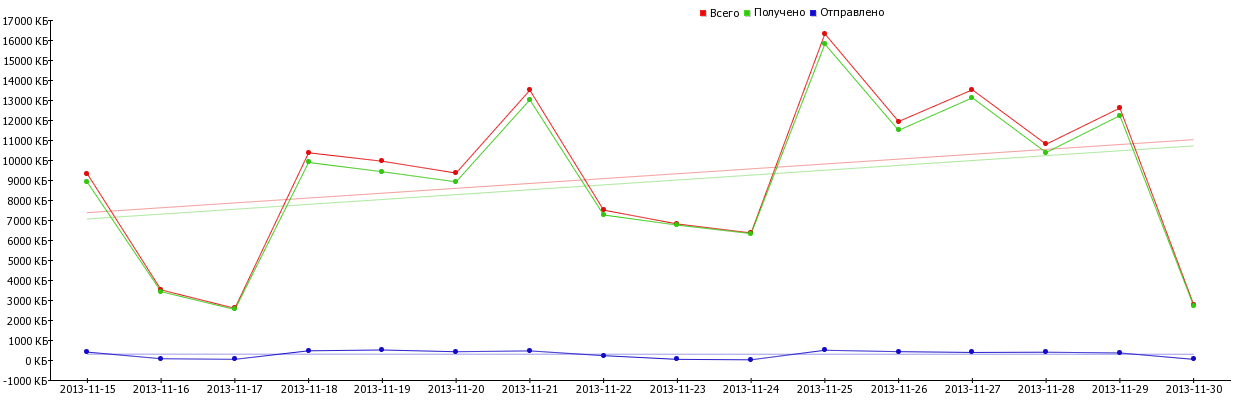
According to the tip from the article “ pChart - building graphs and diagrams in PHP ” I realized the construction of graphs. This is how it looks:
Examples are, of course, good, but practical implementation can help in understanding. My use is under cat.
There are a lot of frameworks for plotting. There are paid good ones, there are good free ones. PChart seemed to me quite convenient and functional. So to the implementation.
pChart works as follows. Enters the data in its array, draws a picture with a graph, saves it to disk. Then you need to display this picture in the document.
I hope my example will help beginners (and maybe not only). A simple example, nothing more. Often more is not needed. Further, if desired, you can make beautiful things.
According to the tip from the article “ pChart - building graphs and diagrams in PHP ” I realized the construction of graphs. This is how it looks:
Examples are, of course, good, but practical implementation can help in understanding. My use is under cat.
There are a lot of frameworks for plotting. There are paid good ones, there are good free ones. PChart seemed to me quite convenient and functional. So to the implementation.
pChart works as follows. Enters the data in its array, draws a picture with a graph, saves it to disk. Then you need to display this picture in the document.
addPoints($sum,"Total");
	$myData->addPoints($dt,"Labels");
};
$unique = date("Y.m.d_H.i");
$gsFilename_Traffic = "traffic_".$unique.".png";
$myData->setSerieDescription("Labels","Days");
$myData->setAbscissa("Labels");
$myData->setAxisUnit(0," KB");
$serieSettings = array("R"=>229,"G"=>11,"B"=>11,"Alpha"=>100);
$myData->setPalette("Total",$serieSettings);
$myPicture = new pImage(1250,400,$myData); // <-- Размер холста
$myPicture->setFontProperties(array("FontName"=>"fonts/tahoma.ttf","FontSize"=>8));
$myPicture->setGraphArea(50,20,1230,380); // <-- Размещение графика на холсте
$myPicture->drawScale();
$myPicture->drawBestFit(array("Alpha"=>40)); // <-- Прямая статистики
$myPicture->drawLineChart();
$myPicture->drawPlotChart(array("DisplayValues"=>FALSE,"PlotBorder"=>TRUE,"BorderSize"=>0,"Surrounding"=>-60,"BorderAlpha"=>50)); // <-- Точки на графике
$myPicture->drawLegend(700,10,array("Style"=>LEGEND_NOBORDER,"Mode"=>LEGEND_HORIZONTAL));// <-- Размещение легенды
$myPicture->Render("pChartPic\\".$gsFilename_Traffic);
?>
Трафик

" />I hope my example will help beginners (and maybe not only). A simple example, nothing more. Often more is not needed. Further, if desired, you can make beautiful things.