ELK Stack for storing Django application logs
- Tutorial
Each of the projects that outgrows the prototype stage needs logging organization. Competent logging solves a lot of problems and helps to understand the status of the project. At the initial stage, logging to the file suited me until the project grew and the search for logs did not begin to take time.
The solution was to create a centralized repository log with log aggregation and search. The choice fell on the ELK stack. ELK is a combination of three OpenSource projects: ElasticSearch, Logstash and Kibana. ELK stores logs, builds graphs and there is support for full-text search with filters. This article describes how to configure the ELK stack to store logs for Django applications.
ELK installation
Docker will be used to install the ELK stack, the docker-elk repository is used as the basis . Change the Logstash setting, add the GROK pattern for the nginx logging, and change the output section so that the Django application logs and the nginx logs are saved in different ElasticSearch indexes. As a result, logstash.conf looks like this:
input {
  beats {
    port => 5000
    host => "0.0.0.0"
  }
}
filter {
   if [type] == "nginx" {
     grok {
        match => { "message" => "%{IPORHOST:remote_ip} - %{DATA:user_name} \[%{HTTPDATE:access_time}\] \"%{WORD:http_method} %{DATA:url} HTTP/%{NUMBER:http_version}\" %{NUMBER:response_code} %{NUMBER:body_sent_bytes} \"%{DATA:referrer}\" \"%{DATA:agent}\"" }
      }
   }
}
output {
    if [type] == "nginx" {
        elasticsearch {
            hosts     => "elasticsearch:9200"
            index    => "nginx-%{+YYYY.MM.dd}"
        }
    }
    elseif [type] == "django" {
        elasticsearch {
            hosts     => "elasticsearch:9200"
            index    => "django-%{+YYYY.MM.dd}"
        }
    }
    else {
        elasticsearch {
            hosts     => "elasticsearch:9200"
            index    => "unknown_messages"
        }
    }
}
After making changes, run the stack:
docker-compose upAfter startup, the stack listens to the following ports:
- 5000: Logstash TCP input.
- 9200: Elasticsearch HTTP
- 9300: Elasticsearch TCP transport
- 5601: Kibana
Logging architecture
Consider the architecture of logging Django application.
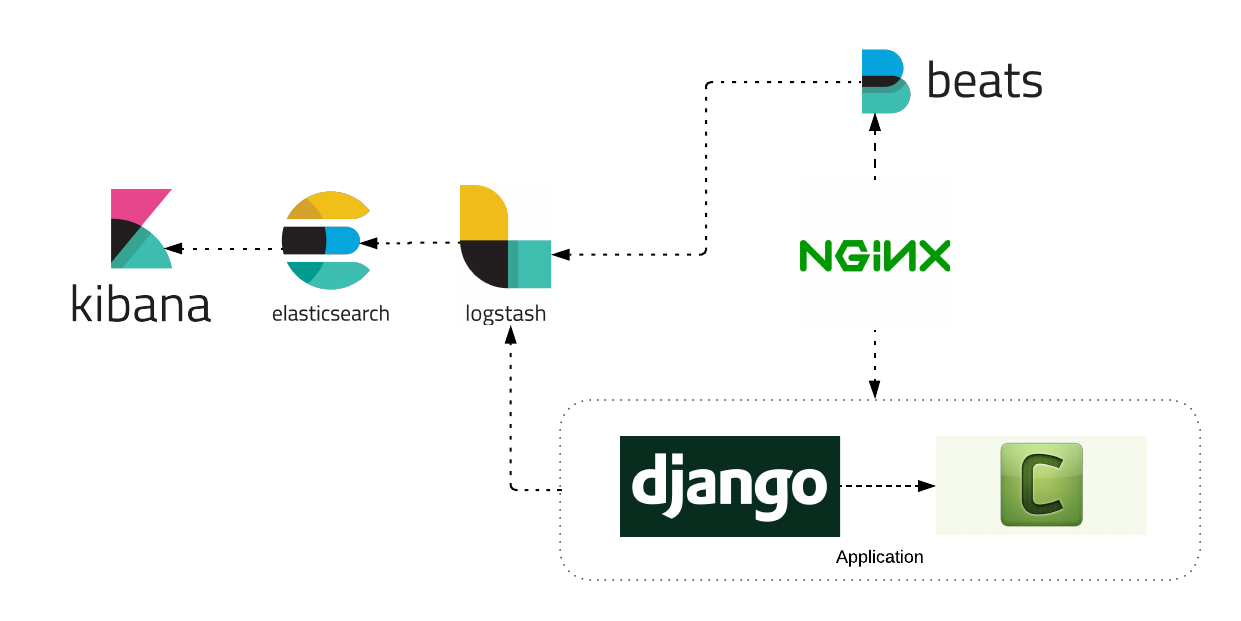
As can be seen from the diagram, the application consists of the following services: nginx, django application, celery worker. Each of the services sent logs to the ELK stack. Consider setting up each service separately.
Write Nginx logs to ELK
To work with nginx logs, you need an additional Filebeat service. The installation process of Filebeat is described in detail on the official website . An example of installing a Filebeat service on an Ubuntu server:
curl -L -O https://artifacts.elastic.co/downloads/beats/filebeat/filebeat-6.4.0-amd64.deb
sudo dpkg -i filebeat-6.4.0-amd64.deb
Filebeat will read logs from a file and send to Logstash. Configuration example:
filebeat.inputs:
- type: log
  enabled: true
  paths:
      - /var/log/nginx/access.log
  fields:
    type: nginx
  fields_under_root: true
  scan_frequency: 5s
output.logstash:
  hosts: ["logstash:5000"]
We start our Filebeat service and watch for the appearance of logs in Kibana.
Write Django logs to ELK
For Django to interact with the Logstash service, install the optional Python-logstash package .
pip install python-logstashChange the Django application settings so that the logs are sent to the Logstash service.
LOGGING = {
  'version': 1,
  'disable_existing_loggers': False,
  'formatters': {
      'simple': {
            'format': 'velname)s %(message)s'
        },
  },
  'handlers': {
        'console': {
            'level': 'INFO',
            'class': 'logging.StreamHandler',
            'formatter': 'simple'
        },
        'logstash': {
            'level': 'INFO',
            'class': 'logstash.TCPLogstashHandler',
            'host': 'logstash',
            'port': 5000,
            'version': 1,
            'message_type': 'django',  # 'type' поле для logstash сообщения.'fqdn': False,
            'tags': ['django'], # список тег.
        },
  },
  'loggers': {
        'django.request': {
            'handlers': ['logstash'],
            'level': 'INFO',
            'propagate': True,
        },
        ...
    }
}
After that, the application will send logs to Logstash. Example of use:
import logging
logger = logging.getLogger(__name__)
deftest_view(request, arg1, arg):
    ...
    if is_error:
        # Отправляем лог сообщение
        logger.error('Something went wrong!')
After that, customize Kibana to display the necessary information. Sample screenshots of your own settings:
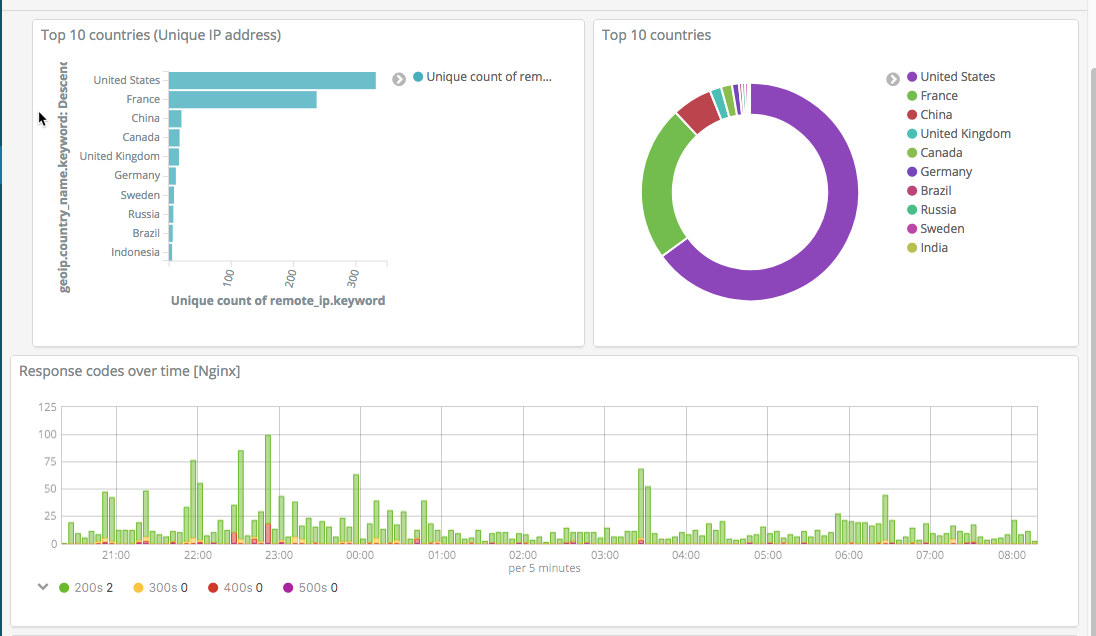
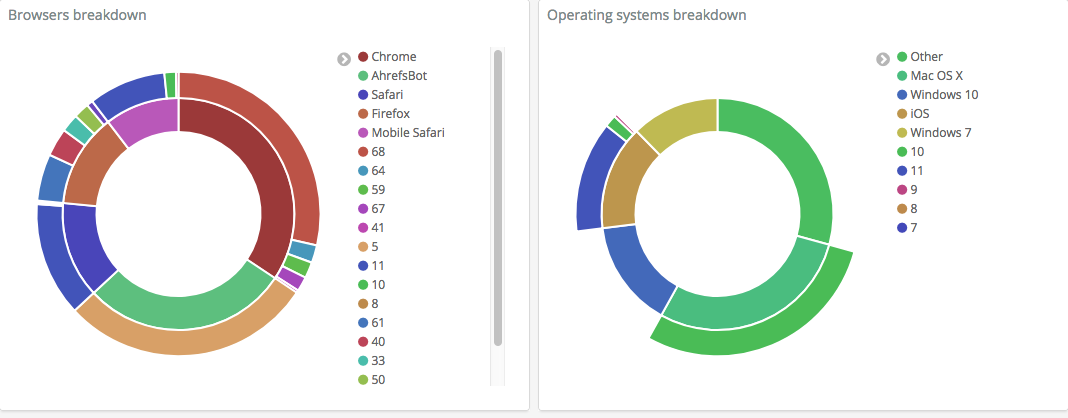
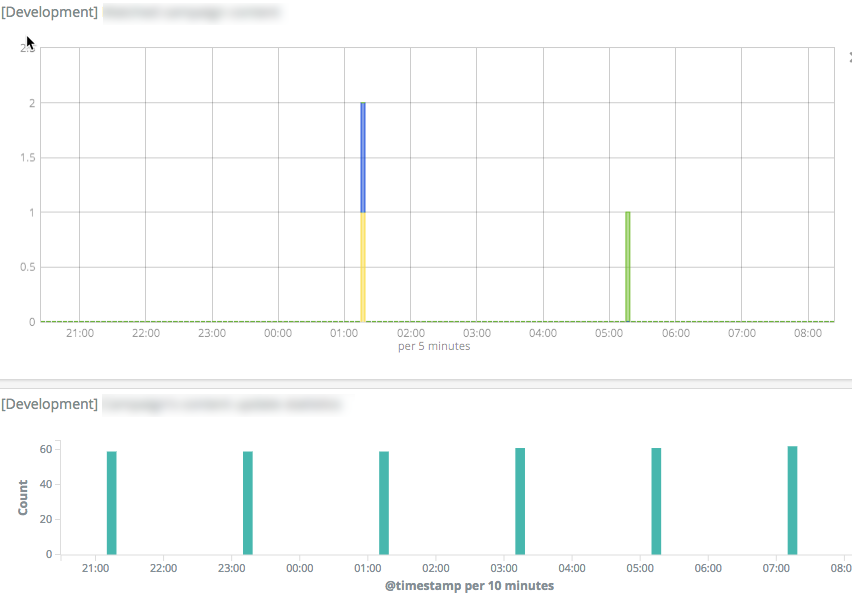
The system collects logs of services, allows you to conveniently search for them, build graphics and visualization, allowing you to detect and fix problems as soon as possible.