December 2, 2013 at 23:28
Hermozone temperature monitoring using 1-wire sensors and Zabbix 2
- From the sandbox
- Tutorial
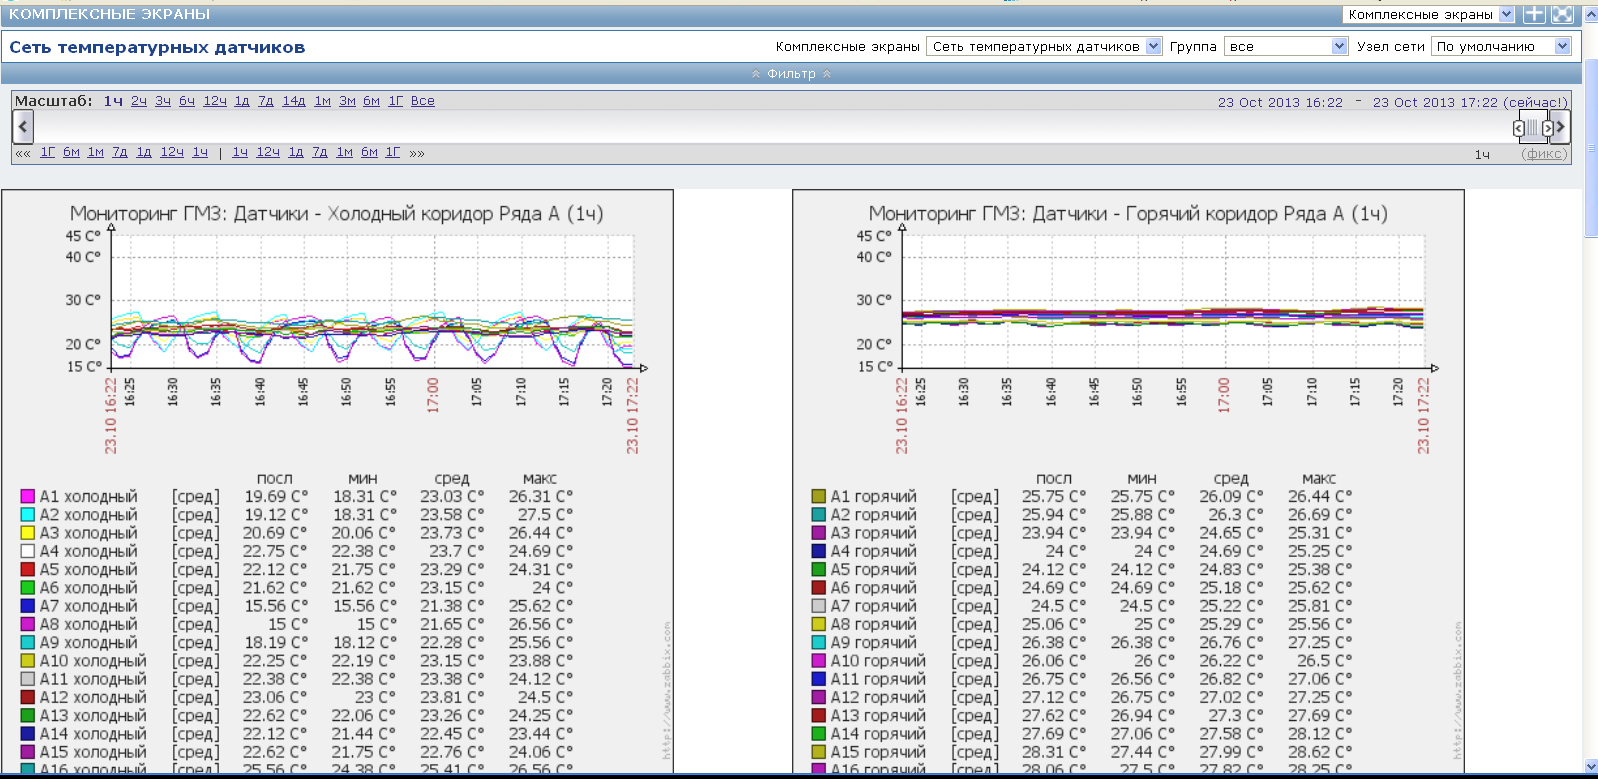
We have a hermetic zone in 4 rows with 16 open racks in each row.
Air conditioning scheme: hot-cold corridors, internal air conditioners with external evaporators, 3 air conditioners per row, i.e. 6 air conditioners per cold corridor.
Objective: to build a hermetic zone temperature monitoring system with the possibility of preventing the conditioners from failing.
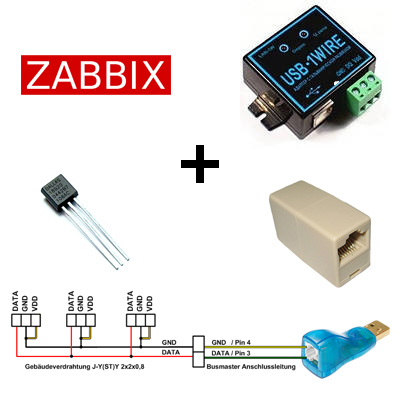
To solve this problem, it was decided to use a network of 1-wire temperature sensors and a monitoring system Zabbix 2.
We assemble a network of 1-wire.
What is a 1-wire network can be found here .
We need:
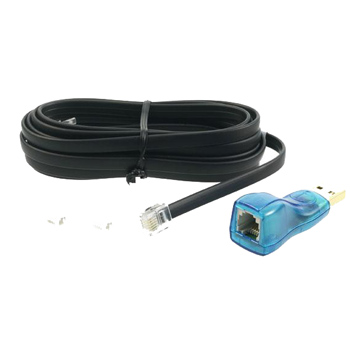
1. DS9490R 1-Wire network controller
2. DS18B20 temperature sensors, in quantity, we calculate: 4 rows * 16 racks in a row * 2 sensors per rack (cold and hot corridors), that is 128 sensors.

3. For convenient installation of the sensor, we used such an RJ45 adapter to RJ45, cat. 5e GCT11-8p8c , also in the amount of 128 pieces

4. And for each sensor there are 2 patch cords, that is 128 * 2 = 256, the length of the patch cord is half the width of the server rack
We assemble the sensor, select any three wires in the adapter, do 3 holes in the adapter, solder the sensor and so on 128 times :)
It is recommended to fill the place of solder with glue from a heat gun, it turns out something like this:
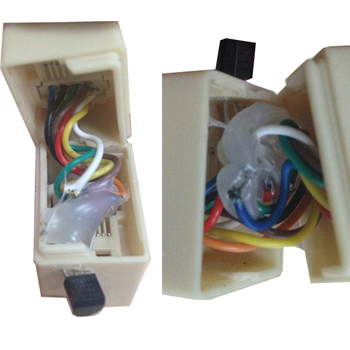
It is recommended that you immediately check the sensors for operation by directly connecting to a 1-wire network controller and reading information from it. It is also recommended to number the sensors: paste numbers from 1 to 128 sequentially. The initialization of a 1-wire network will be described below.
And so it looks if you fix it on a rack.

Since the controller has an RJ11 connector, not RJ45, I recommend making a zero sensor adapter, its serial number will be zero, and the number of racks will begin with 1, which is more familiar.
IMPORTANT!
The length of our network was about 140 meters, since the server was in 2 rows.
In the process of testing, it turned out that the USB port power is not enough for such a long network, the controller simply can not interrogate the sensors beyond half the network, therefore I recommend buying a USB hub, be sure to have external power, and connect the controller to it. After connecting the hub, the rate of polling sensors increased, and errors stopped appearing on the network, all sensors were read.
I could not split the network into two segments, since the program that reads the data from the sensors could not understand which controller to work with, at least I could not get it.
Initialization of a 1-wire network and obtaining sensor values.
So, we proceed to configure the software part.
The server to which the USB controller of the 1-wire network is connected is running FreeBSD 9.1, Zabbix 2.0.8 is installed from the ports.
To get the sensor values, use the DigiTemp program
Download the DigiTemp sources and compile, I have the compiled programs:
/usr/local/etc/digitemp/new/digitemp-3.6.0/ To work with our controller, use the digitemp_DS2490 program DigiTemp needs to be run from root so that it can read data from the device. You need to run the program only from its directory, since the network configuration file is stored there. - the result of the execution will be a 1-wire network configuration file with the name .digitemprc in the program’s home directory. In this case, digitemp will output 64-bit sensor IDs, which it will write to a file.
# cd /usr/local/etc/digitemp/new/digitemp-3.6.0/

# ./digitemp_DS2490 -i
./digitemp_DS2490 -iExample .digitemprc
TTY USBREAD_TIME 1000LOG_TYPE 1LOG_FORMAT "%b %d %H:%M:%S Sensor %s C: %.2C F: %.2F"CNT_FORMAT "%b %d %H:%M:%S Sensor %s #%n %C"HUM_FORMAT "%b %d %H:%M:%S Sensor %s C: %.2C F: %.2F H: %h%%"SENSORS 133ROM 0 0x28 0x62 0xB5 0x19 0x03 0x00 0x00 0x61ROM 1 0x28 0x29 0xD5 0x19 0x03 0x00 0x00 0xFDROM 2 0x28 0x59 0xDE 0x19 0x03 0x00 0x00 0x15ROM 3 0x28 0xDA 0xD6 0x19 0x03 0x00 0x00 0x98ROM 4 0x28 0xFD 0xBE 0x19 0x03 0x00 0x00 0x84ROM 5 0x28 0xCB 0xE2 0x19 0x03 0x00 0x00 0x6FIMPORTANT
Counter number ROM 0 0x28 0x62 0xB5 0x19 0x03 0x00 0x00 0x61, DOES NOT be its physically sequential network number, this number was received during network initialization, that is, the one who answered first wrote to the file.
Therefore, at the stage of soldering sensors and checking them, I recommend that you form a immediately sequential network. That is, we take the sensor, soldered it, connected it immediately to the controller, launched ./digitemp_DS2490 -i got its ID, copied it to the Excel table and also added the ROM number ... to the table in sequence.
They disconnected the sensor, stuck a serial number on it, and hung it on a garland, connecting it with patch cards. I do not recommend connecting the garland to the controller and starting the test, firstly it will be much longer, and secondly, in light of the above, due to the fact that the responses from the sensors do not come in sequence, it will be more difficult to search for the ID of the new sensor.
After you have tested all the sensors, connect the garland to the controller and run.
./digitemp_DS2490 -iYour network configuration file will
be generated .digitemprc You need to replace it with
ROM 0 0x28 0x62 0xB5 0x19 0x03 0x00 0x00 0x61 ROM 1 0x28 0x29 0xD5 0x19 0x03 0x00 0x00 0xFD ROM 2 0x28 0x59 0xDE 0x19 0x03 0x00 0x00 0x15 ROM 3 0x28 0xDA 0xD6 0x19 0x03 0x00 0x00 0x98 ROM 4 0x28 0xFD 0xBE 0x19 0x03 0x00 0x00 0x84the one that you got in the Excel file in the same format.
Save the resulting .digitemprc file in a different folder, because if you suddenly run again
./digitemp_DS2490 -i, then your file will be overwritten, and then the physical addressing will be incorrect with a high degree of probability. After the 1-wire network is configured, you can read the values of the sensors, run
./digitemp_DS2490 -q -a -r1 -n1, the program will display the values of the sensors. Check that the serial connection in the network is correct, for example, heat the 5th sensor, and run the program, the temperature should increase by 4 (since the numbering goes from 0)
Go to the Zabbix setup .
The server on which Zabbix is installed in zabbix is called ZabbixServer.
We create 129 data elements in it, that is, for each temperature sensor by the data element.

It’s important for us to understand here:
gmz.temp.t17 is the key of the element, they are used to send the sensor value
and the type of the item must be “Zabbix trapper”, since the values will be sent through the zabbix_sender program.
We also create 12 additional data elements for each of 12 air conditioners. The sensors are located so that 3 sensors are located under the cold air outlet of the air conditioner, so we consider the average of these three sensors, then the data element will be calculated.

Pay attention to the formula, that is, the last obtained sensor values are added up and divided by three.
After we added data elements, we can send value data to Zabbix.
In the crontab of the root user, add the task: That is, run the digitemp_cron.sh script once a minute - this line determines the data output format. IMPORTANT!
*/1 * * * * /usr/local/etc/digitemp/digitemp_cron.sh > /dev/null 2>&1
cat /usr/local/etc/digitemp/digitemp_cron.sh#!/usr/local/bin/bashcd /usr/local/etc/digitemp/new/digitemp-3.6.0/./digitemp_DS2490 -q -a -r1 -n1 -o"ZabbixServer gmz.temp.t%s %N %.2C" | /usr/local/bin/zabbix_sender -vv -z 127.0.0.1 -I 127.0.0.1 -T -i --o"ZabbixServer gmz.temp.t%s %N %.2C" ZabbixServer is the name of the host with Zabbix server installed in Zabbix.
Run
./digitemp_DS2490 -q -a -r1 -n1 -o"ZabbixServer gmz.temp.t%s %N %.2C" | /usr/local/bin/zabbix_sender -vv -z 127.0.0.1 -I 127.0.0.1 -T -i -as a result of zabbix_sender, it should be that all lines are sent and received:
Info from server: "Processed 133 Failed 0 Total133 Seconds spent 0.000540"
sent: 133; skipped: 0; total: 133
If so, then you can add graphs and triggers, and set alerts.