Key indicators of the quality of customer service in retail and services
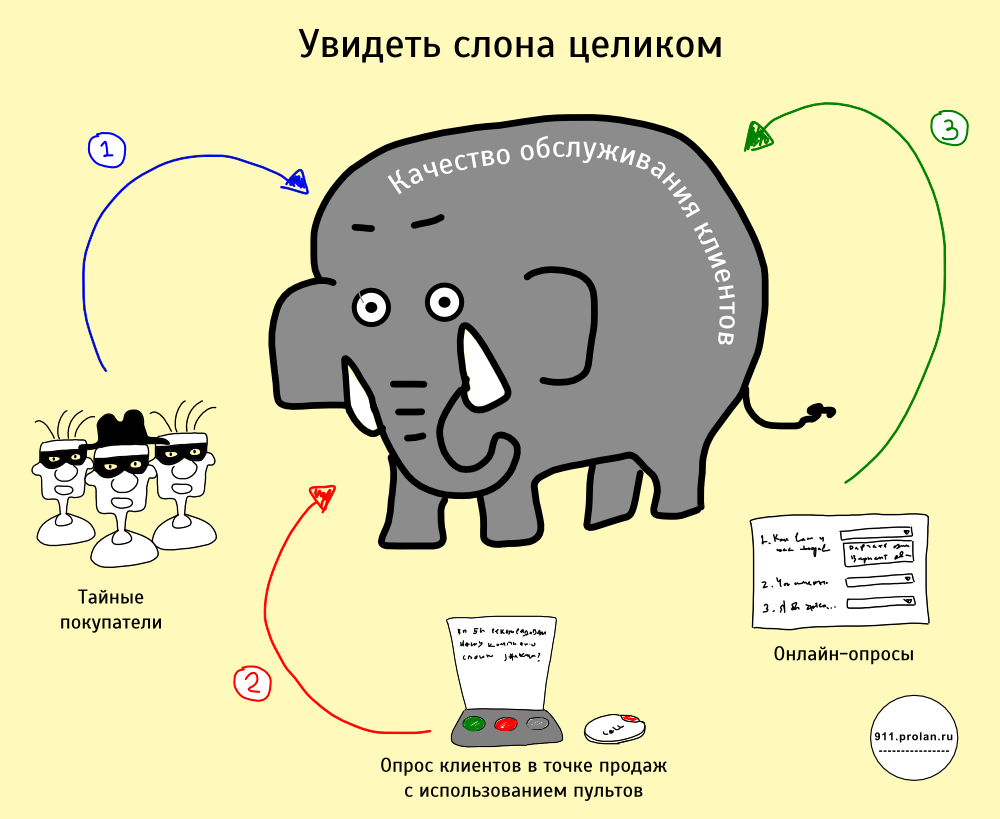
In order to effectively manage the quality of customer service, in addition to the Mystery Shopping method, which allows evaluating service in terms of corporate standards, it is equally important to conduct a survey of real customers. This can be done in various ways, for example, using web polls, mail polls, with the help of interviewers interviewing customers on the trading floor. Recently, the survey technology has been actively developing, which is based on the use of special button remotes or terminals installed directly at the point of purchase or service. The main advantage of this technology is that the client does not have time to forget his feelings, so the information about the perception of customer service quality is very accurate. Besides, it is much easier for a client to motivate to answer one question at the time of purchase than a series of questions in a day or two, when the joy of the purchase (or, conversely, the indignation) is not so bright. Unless, of course, this is a panel study, for which the client receives a reward. Therefore, the representativeness of the sample, and, consequently, the reliability of the results, are much higher.
However, the technology for assessing the quality of service using button remotes does not boil down to just installing “like - not like” buttons and collecting relevant statistics. Firstly, most customers are not eager to push something. Unless special measures are taken to motivate customers, no more than 30% of customers will evaluate the quality of service [1], and the shift in a number of parameters (gender, education, income, personality traits, etc.) compared to the general population will be very large. Consequently, the resulting statistics will not correspond to real customer satisfaction. Secondly, if it is not possible to separate customer dissatisfaction caused by poor quality of service from dissatisfaction caused by personnel-independent factors (something has broken, a long queue, etc.), then the resulting statistics cannot be linked to the motivation system , which will significantly narrow the scope of this technology.
Therefore, the technology for assessing the quality of service, in addition to hardware (buttons, software, video surveillance systems, etc.) should include a methodology for their application. This technique is described in[2] . This article discusses the practical application of this methodology, with the main emphasis on Key Indicators of Quality of Customer Service (KPKO), in particular, how to measure these indicators, how to control their reliability and how they can be used.
Key and additional indicators of the quality of customer service

The quality of customer service can be divided into three components:
- The quality of the work of the front line personnel: friendliness, professionalism, appearance, manner of communication, etc.
- The quality of office organization and the quality of business processes:
- The quality and value of products and services.
Key indicators of service quality:
| Indicator | Short description |
|---|---|
| INC @ Personnel - An index of customer dissatisfaction with the quality of work of front-line personnel | It characterizes the quality of staff work through the eyes of customers. Used for personnel management by KPI. It is calculated as the share of negative assessments and the share of Molchunov (with a correction factor) when answering the Key Question: “Are you satisfied with the quality of work of the client manager Elena Ivanova ?” |
| INC @ Office - An index of customer dissatisfaction with the organization of office work and the quality of business processes | It characterizes the quality of business processes and the attractiveness of the office through the eyes of customers. It is used as one of the KPIs of the internal business processes of the MTP (Balanced Scorecard System). It is calculated as the share of negative assessments and the share of Molchunov (with a correction factor) when answering the Key Question: “Did you like the atmosphere and organization of the work of our office?” |
| IEL - Emotional Customer Loyalty Index | Characterizes emotional customer loyalty. It is adapted for retail and service sectors Net Promoter Score . Used as one of the KPI client component of the MTP. It is calculated as the share of positive ratings minus the share of negative ratings and Molchunov (with a correction factor) when answering the Key Question: “Would you recommend our company to your friends?” |
When assessing the quality of service by the method of customer surveys, the representativeness of the sample for which the assessment is made and its length over time are critical. Therefore, in addition to the actual quality of service indicators, additional (auxiliary) indicators are needed that characterize the representativeness of the sample and the representativeness of the time period.
Additional indicators:
| Indicator | Short description |
|---|---|
| Accurate Conversion | It is calculated as the ratio of the number of surveys (front-line personnel contacts with customers) to the number of transactions (sales) |
| Visitor Coverage Rate | It is calculated as the ratio of the number of polls to the number of visitors. |
| Force majeure level | It should be analyzed during the Customer Service Quality Audit. If the monitoring of the quality of customer service is carried out constantly, this indicator is optional. It is calculated as the ratio of the number of force majeure situations to the number of polls. |
In most cases, to control the representativeness of the sample, it is sufficient to use either Exact Conversion or Visitor Coverage Rate. The choice of a specific indicator depends on the business processes of the front office. For example, to monitor the quality of customer service of filling stations, you should use Exact Conversion, and to monitor the quality of customer service of the bank, the Visitor Coverage Rate. If during the assessment period the level of force majeure exceeds a certain threshold value, then it may not be advisable to evaluate the quality of customer service. First, it makes sense to eliminate the causes of force majeure situations, and then repeat the Audit of Customer Service Quality.
Monitoring system architecture
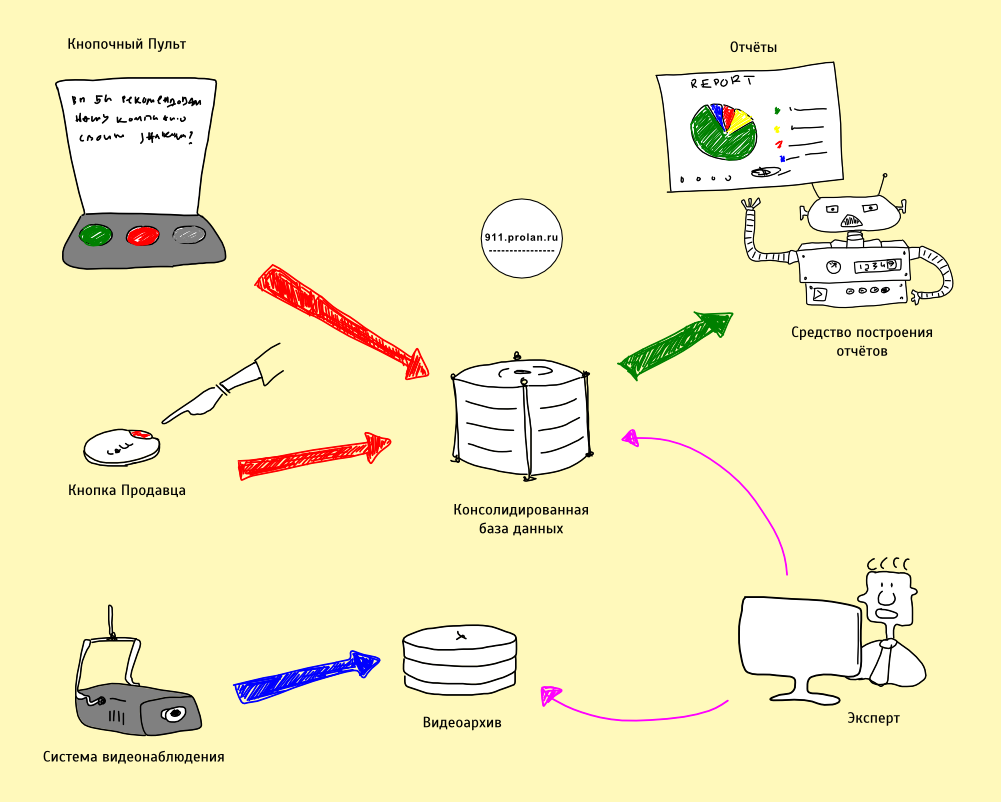
The main components of a service quality monitoring system:
| Component | A comment |
|---|---|
Three-button Dashboard | Mandatory requirements:
|
Seller Button | An additional button, logically associated with the corresponding button remote control, but installed on the seller’s side. Mandatory requirements:
|
Video surveillance system | An existing video surveillance system may be used. Mandatory requirements:
|
Consolidated Database | Data store |
Reporting tool | Reports characterize the quality of service using the main and additional indicators of quality of service. Used by HR Director, Quality Manager, etc. |
The main roles:
| Role | Functions Performed |
|---|---|
| Seller |
|
| Expert |
|
Methodology for measuring the quality of service

- An employee of the front line, finishing the customer service, asks him to answer the Key Question and at the same time makes a short press of the Seller’s Button. The following conditions must be met:
- OPTIONAL A short press of the Seller’s Button may automatically play an audio or video file: “It is very important for us to know your opinion. Please [what needs to be done]. " File playback can start automatically when a front-line employee, working with a cash register system or CRM, performs a certain operation. The cash register system or CRM should be integrated with the quality of service monitoring system.
- The client has a certain time (Permitted Window) during which he can answer the Key question by choosing one of the answer options on the keypad: Yes, No, I find it difficult to answer .
- If the front line worker sees that a situation has arisen that could affect customer responses (force majeure), he presses the Seller’s Button and holds it pressed for at least 3 seconds. A long press of the Seller’s Button qualifies as a force majeure event.
- The expert periodically checks the accuracy of all clicks made by both clients and front-line employees. Validation is performed by comparing the click information contained in the consolidated database with the video stored in the video archive. If the Expert Advisor sees that some event is unreliable, in the special field opposite this event, he puts 0. All polls in which the Expert set 0 are qualified as invalid and are excluded from the calculations.
- At each time period, all customers are asked one Key Question. Key Questions may be changed randomly or on a regular basis. If the Key Question is accompanied by playing an audio or video file, then it may automatically change randomly. If Key Questions are formulated on a keypad (for example, on an acrylic insert), then they are changed manually. For example, in the first decade of the month, customers are asked one Key Question, in the second - another, etc.
Methodology for calculating service quality indicators
| Indicator | Key Question | Calculation formula |
|---|---|---|
| INC @ Staff | Are you satisfied with the quality of work of the client manager Elena Ivanova ? | The number of reliable polls / (The number of negative ratings + Correction Factor * Number of Silents) The polls considered to be reliable are those that did not raise doubts from the expert. Negative answers (“No” answers) and Silencers recorded during the period of validity of the force majeure circumstances confirmed by the expert are NOT taken into account. |
| INC @ Office | Do you like the atmosphere and organization of our office? | The number of reliable polls / (The number of negative ratings + Correction Factor * Number of Silents) The polls considered to be reliable are those that did not raise doubts from the expert. Negative answers (“No” answers) and Silence recorded during the period of force-majeure circumstances confirmed by the expert are taken into account. |
| IEL | Would you recommend our company to your friends? | (Number of reliable polls / Number of positive answers) - (Number of reliable polls / (Number of negative answers + Correction factor * Number of Molchunov)) Negative answers (“No” answers) and Molchuny recorded during the period of validity of the force majeure circumstances confirmed by the expert are taken into account . |
The correction factor characterizes the share of the Molchuns who do not take part in the survey for reasons not related to dissatisfaction with the quality of service. To determine the exact value of the correction factor, it is necessary to conduct a marketing research. If the exact value is not critical (for example, when the dynamics are important not absolute values), use the standard value of 0.8 .
Application indicators
INC @ Staff
INC. @ Personnel can be used as the main KPI of front line employees who are not engaged in active sales. It is important that INC @ Staff can be linked to a staff motivation system without risking demotivating employees. This is due to the following reasons:
- The value of the indicator is calculated by a highly representative sample (all or almost all clients are involved), which ensures high representativeness of INC @ Personnel;
- All answers can be qualified by an independent expert, which allows to ensure the high reliability of INC @ Personnel;
- When calculating the indicator, customer dissatisfaction caused by personnel-independent reasons is not taken into account, which ensures high accuracy of INC @ Personnel.
INC @ Office
This indicator has at least two uses. The first application is one of the KPIs of the front-office internal business processes. The second application is the diagnosis of a bottleneck in the quality of service. In the second case, the values of the INK @ Office indicator must be compared with the values of the INK @ Person indicator. When all is well, the values of both indicators are better than the reference values (average for this type of business) and the value of INC @ Office is higher than the value of INC @ Office [2] . If the values of these indicators will be worse than the reference values and at the same time close, then the “bottleneck” in the quality of service is most likely the personnel. If the values of the INK @ Office indicator are significantly higher than the INK @ Personnel values, then the “bottleneck” in the quality of service is most likely the poor organization of the office (internal business processes).
Emotional Loyalty Index (IEL)

Like INC @ Office, the Emotional Loyalty Index (IEL) has several uses:
- IEL - one of the KPI client component of the BSC, characterizing customer satisfaction;
- IEL is an indispensable element of all control systems of the main loyalty drivers shown in the figure above. Without information about the attitude of customers to the company, it is impossible to effectively manage the factors that determine this relationship (loyalty drivers) [3] .
Exact Conversion, Visitor Coverage Rate
Monitoring the quality of service is not an end in itself, but a tool to increase sales. Therefore, the criterion of good quality of service, in addition to the values of INC @ Personnel, INC @ Office, IEL, is the growth in the number of sales, characterized, in particular, by the value of the Exact Conversion indicator [4] . This indicator has two uses:
- Monitoring the representativeness of the sample when measuring the main indicators of the quality of service (INC @ Personnel, INC @ Office, IEL);
- One of the KPIs of front line direct sales personnel characterizing employee performance [4] .
Another indicator mentioned is Visitor Coverage. Like Exact Conversion, the Visitor Coverage Rate has two uses:
- Monitoring the representativeness of the sample when measuring the main indicators of the quality of service (INC @ Personnel, INC @ Office, IEL);
- One of the KPIs of front line direct sales personnel characterizing employee activity [4] .
Integrated customer service quality management
Measurement of Key Indicators of Quality of Service is a necessary part of the integrated management of the quality of customer service.
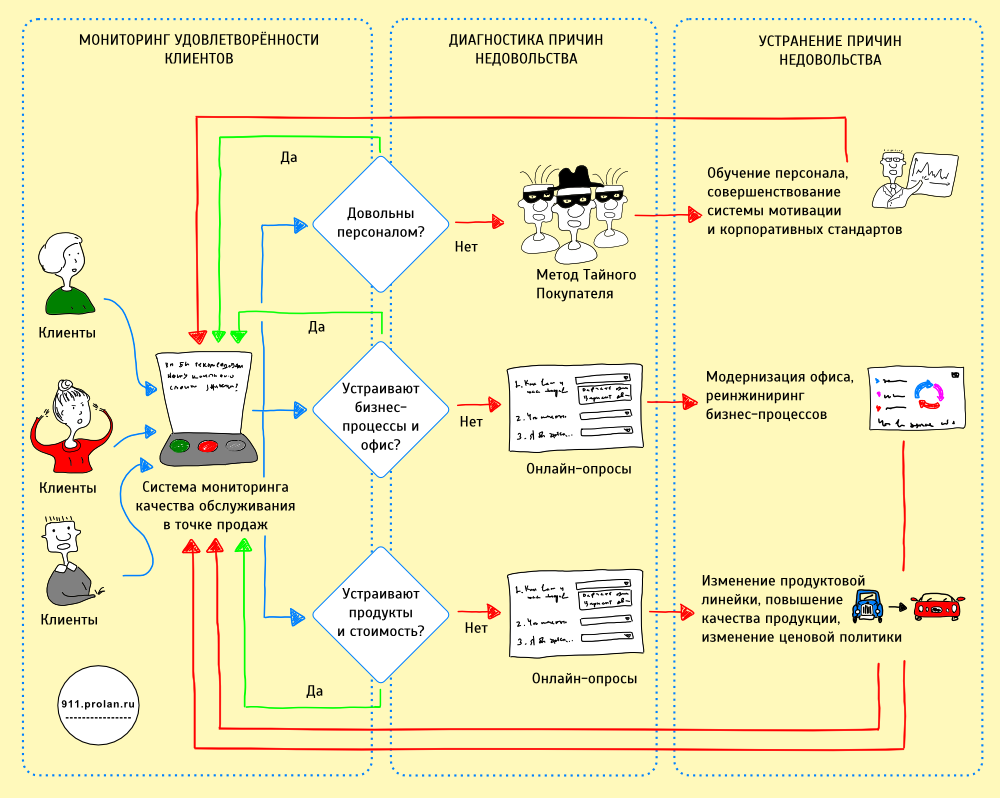
Comprehensive service quality management is monitoring the quality of service, diagnosing the causes of customer dissatisfaction and corrective actions to eliminate the root causes of customer dissatisfaction (see figure).
The first stage is monitoring the quality of service . At this stage, customer dissatisfaction is identified and its primary localization is determined. It could be:
- dissatisfaction with the work of staff;
- dissatisfaction with the quality of the office and the quality of business processes;
- dissatisfaction with the quality of products and their value.
In order to determine which of the three groups of reasons is expressed by customer dissatisfaction, the Loyalty Button service assessment system and the technology described above are used. The Key Indicators of Quality of Service (KPKO), which are used for this - INC. @ Personnel, INC. @ Office, IEL (see above).
The second stage is the identification of the root causes of discontent . It is known, after calculations using the KPKO, that dissatisfaction is associated with one of three groups of reasons. Now you need to find out what exactly does not suit the staff in the work, or what exactly is wrong with the quality and cost of the products.
- If the problem is related to staff work, the Mystery Shopper method is used ;
- If the problem is with the office and business processes or the quality and cost of the products, online surveys are used .
As respondents to online surveys, use clients who are dissatisfied with the quality of service. For this, the Loyalty Button must be integrated with the CRM system or profiles of the loyalty program (in retail).
The third stage is the correction, or the elimination of the causes of discontent . Once the causes of dissatisfaction are identified, they must be addressed. Remedies and methods depend on the nature of the problem. This can be training for staff, changing the product line, reengineering business processes, etc.
After determining the causes of customer dissatisfaction, corrective actions are performed. Their goal is to eliminate the root causes of discontent. The correctness of the diagnosis and the effectiveness of corrective actions are checked at the stage of monitoring the quality of service. Thus, the control loop closes. For more details about the technique, see [2] .