Statistical Process Management (Part 1. Implementation Experience)
Foreword
“We have an acceptable level of marriage!” It is with this phrase that communication begins with almost every quality director at manufacturing plants in Russia. Many of them will even claim that they have achieved world-class quality in the form of 3.4 defective items per 1,000,000 produced. On the whole, in all relevant forums and conferences we hear that Russia has the best quality in the world, and all other countries envy us.
Usually these loud slogans hide huge losses from an internal marriage, a bloated staff of inspectors, concealment of defects, lack of automation and many other problems that ultimately affect consumers and shareholders.
During Soviet times, quality was achieved through the full and unbiased observance of all kinds of GOST. But, unfortunately, in our reality, the observance of state standards is not a priority requirement (with the exception of the enterprises of the military industrial complex), and the main goal of production is to make everything faster and cheaper. Based on this thesis, we are actively introducing optimization methods in the form of Lean tools and reducing staff while increasing production volumes.Quality management is also changing, but in spite of the total application of ISO 9000-9004 standards (mostly only on paper), changes are very slow and often lag behind the changed approaches to production. Usually the process of quality management is reduced to the fact that at the end of the production cycle the controller checks all the parameters of the product to ensure that they are within tolerance fields and that the product is deemed fit or not.
Now this old paradigm is being replaced by a new one, in the form of continuous process control based on numerical data, using the methodology of statistical process control or SPC (Statistical Process Control). Although the SPC was designed by Dr. Walter Schuhart almost 100 years ago, it is only now beginning to gain popularity in our country. The whole essence of statistical methods is reduced to only one rule: "Reducing the variation (variability) of the process." The pattern here is the following: the smaller the variation, the better the process; the better the process, the more stable the quality, the more stable the quality, the lower the cost of scrap and rework.
And to reduce the variation, we just need to understand the nature of this variability. But no matter how simple it may sound, in fact, the task is rather laborious, but the result should justify all the effort. With ideally working tools of statistical process control, controllers will not be needed in principle. Stable processes ensure consistent product quality. In such circumstances, top management will achieve their dreams in the form of zero marriage.
Where to begin?
All the reflections and recommendations are based on the actual experience of SPC and MSA implementation (Measurement System Analysis or measurement systems analysis) in one production company in Russia. Special attention will be paid to errors that were made during implementation.
1. Process selection and key parameters
The first thing to start with is the choice of manufacturing processes for testing MSA and SPC on them. Perhaps the idea will seem obvious to many, but still: there is no point in trying to cover the entire production at once. It is enough to start a pilot project on some simple process, get a meaningful result and then gradually scale the methodology over the whole enterprise.
We (the project team), of course, did the opposite. Began a massive introduction of the methodology for all production and bogged down in a huge number of processes. We didn’t have enough resources to cover all this volume, and as long as we worked closely for a month in one workshop, all the others had already forgotten what this project was about and what we were doing here.
It is also very important to determine in advance for each process the numerical parameters, which will then be used to analyze stability, reproducibility, analysis of measurement systems and constant monitoring. If you use the terminology Lean, then we select CTQ (critical to quality) - critical for quality values. The selected CTQ must have two important properties:
- Be meaningful to the final product quality;
- Be measurable.
The choice of characteristics is best left to technologists and designers. For each process we reviewed, we assembled a small working group where we determined the CTQ list, usually the working group included project participants, technologists, designers and metrologists at the MSA stage. The number of selected characteristics should not be too large and too small; here the main thing is to stick to common sense and proceed from the resources that you can allocate to control these CTQs.
2. The choice of information system for data collection
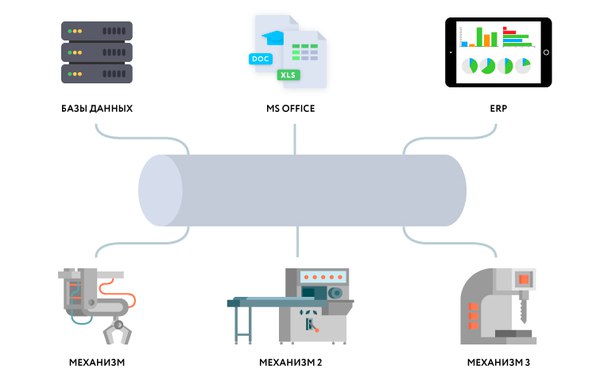
Prior to the mass appearance of computers in production, all control charts were conducted manually on sheets of paper, the reproducibility indices were counted in a bar, and the histograms were built on a ruler. Of course, now it will not occur to anyone to collect and analyze data on paper, therefore the key question that should be answered first of all is the choice of an information system for the implementation of SPC. The zoo of information systems at industrial enterprises can be devoted to many articles and here I will not go into details. It is worth noting that in order to implement SPC, you must configure data collection in a single repository, or you can integrate different databases in case several information systems are involved in data collection.
Our project had to integrate several information systems that collect data from production processes.
It is important to collect data during the production process, and not to pile all the measurements from the barn books at the end of the shift or at the end of the month. Our company has several options for entering data into the information system:
- automatic - when there are measurement tools with a digital output (a caliper with a digital output, a CMM or a test bench test report). The system, using different protocols, receives files in various formats, converts them and puts them into a common base into a dedicated structure.
- semi-automatic — data is entered, for example, into Excel tables, and then these tables are loaded into the system, where they are also converted and fall into the required data tables.
- manual - special data collection forms have been created in the system. Each user at his workplace can enter data into the system using a PC, tablet or even a smartphone if necessary.
3. Personnel and training
After determining the processes and parameters, it will be necessary to explain to the personnel working with these processes, why and why this methodology is being implemented. But, the first thing you come across here is a misunderstanding of the staff. All those who work in consulting know that the introduction of any changes is primarily a struggle with the performers. Changing processes, additional workload, learning something new are three main reasons why staff do not want to work with inspiration on the project. In addition, the methodology is not so easy to understand, although it uses calculations of the level of the 7th grade of mathematics in secondary schools. Even engineers do not always know and understand SPC and MSA.
To cope with this situation will help systematic training of all involved in the process of collecting and analyzing employee data. Unfortunately, the business literature in this area is very small and it is worthwhile to select only a few books:
- Donald Wheeler, David Chambers, Statistical Process Control;
- Edwards Deming “Overcoming the crisis. New paradigm of managing people, systems and processes ”;
- Statistical Process Management SPC, reference guide Daimler Chrysler Corporation / Ford Motor Company / General Motors Corporation.
- “MSA Measurement System Analysis”, reference manual Daimler Chrysler Corporation / Ford Motor Company / General Motors Corporation.
If the first two books are easy enough to buy, then the third and fourth problems will arise. For some reason they are not freely available, but it is possible that you can find such publications in the libraries of technical universities. There are also other reference guides on FMEA (analysis of types and consequences of potential failures), PPAP (part approval process), APQP (advanced product quality planning and management plan). In addition, you can always refer to the State Standards: 22514 (part 1 - Part 8), 7870 (part 1-part 8), 51814.5-2005.
In principle, this literature is enough to understand the methodology and use the examples to understand the tools used. In addition to books, there are full-time and correspondence courses on SPC and MSA, but for the most part they are a brief retelling of all these sources and do not carry anything new.
4. Information system for the implementation of SPC and MSA tools
So, by this moment suppose that you have already implemented the first three points and you have:
- Data from technological processes are collected in a single repository;
- The project team has been defined, its participants are motivated and ready to move mountains in the area of introducing statistical methods;
- All project participants are trained and know what variation, distribution function, sigma process, as well as with closed eyes will be able to distinguish the map of averages and ranges from a map of sliding ranges.
In fact, it is possible to maintain control charts in MS Excel, but with such an approach there is no reason to talk about the mass implementation of SPC. We need a more systematic tool that will work with the analysis of measuring instruments and with statistical methods, that is, to have already built-in quality management tools. Additionally, the system should be relatively inexpensive, be able to connect to different data sources and also be customized for unique production processes.
Systems that allow you to work in this direction is enough. Below is a table comparing certain classes of information systems and key representatives:
| SAP, 1C | Statistica, Minitab | EMI systems | |
|---|---|---|---|
| Cost of implementation |
|
| From 3 million box |
| Integration bus functionality |
| Not | Yes |
| Quality Management Methodology | Additional modules purchased separately | Yes | Not |
| Open code |
| Not | Not |
Since our company already had a system that allowed collecting data and at the same time had open source, as well as a team of good developers, it was decided to create a functionality for themselves from scratch. In the end, this approach had both advantages and disadvantages:
| pros | Minuses |
|---|---|
|
|
Currently, our system already has the following functionality:
- Connecting various data sources to monitor processes in real time and the ability to exchange messages between these sources;
- Monitoring the stability of the process using Shewhart control cards (GOST R-ISO-7870) in real time (XR, XmR, XS);
- Data entry forms for the calculation of repeatability and reproducibility (% GRR);
- Business process management with the help of analytics and data visualization tools (trend, bar graphs, charts, etc.);
- Management of business processes in the event of a malfunction in the equipment or a product defect.
If someone has experience in implementing and developing methods of statistical process management, I will be very grateful for any constructive information. First of all, I wonder what information systems you use to implement SPC and MSA.