Plus one percent automation
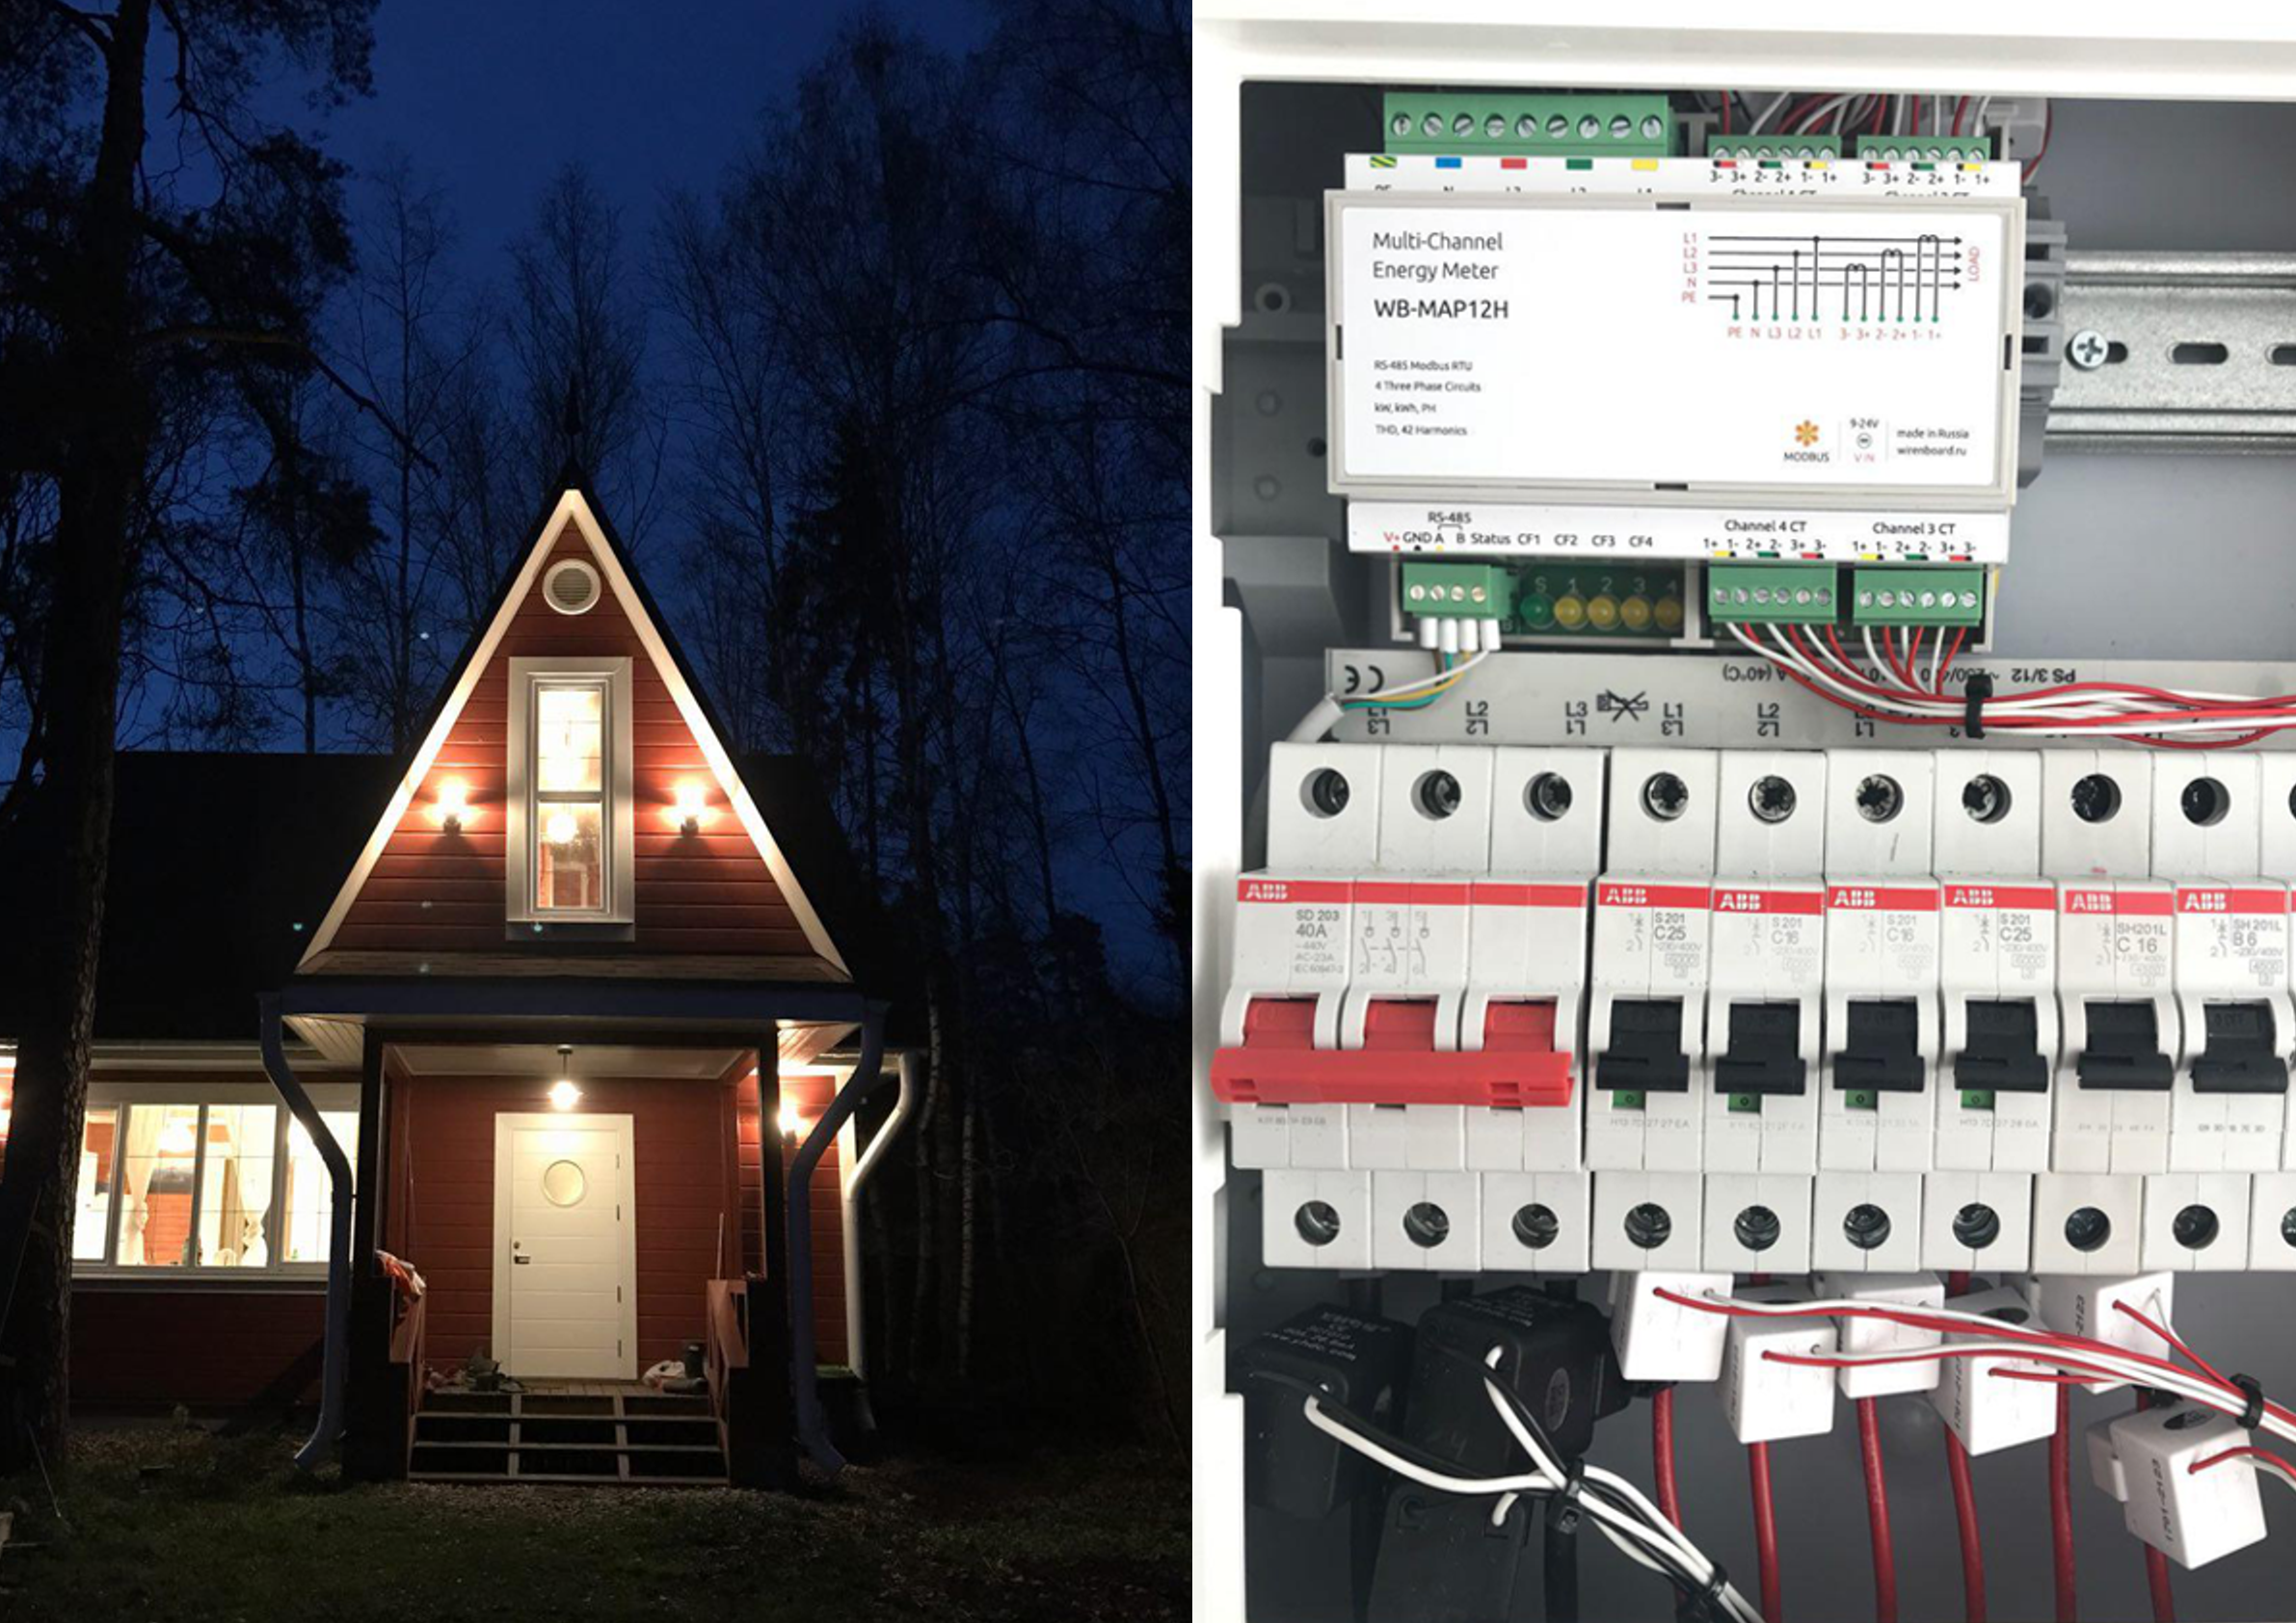
At the end of the last article I stopped at the list of that endless list of technical solutions that I really want to implement in the automation of the whole, well, not the country, but the dacha.
Previously, the total consumption was controlled by a single-phase meter with a Modbus interface. It is useful to follow the current consumption indications in order not to exceed reasonable limits and not to wait for the disconnection of group automatons. He coped with this task with a bang. But it is much more interesting to follow each consumer individually. For what and how to do this, I will try to tell in this article.
First of all, I would like to say thank you very much, colleagues, for your interest in the previous article. Responding to your comments was no less exciting than writing the article itself. One observant reader noticed that the coarse water filter is installed upside down!
Wiren Board produces several models of multichannel modbus electricity meters: the four-channel three-phase monster WB-MAP12H (and its single-channel younger brother WB-MAP3H ), the six-channel single-phase WB-MAP6S and a separate model WB-MAP3E , which is used in special cases when you need to diagnose short and powerful voltage spikes.
WB-MAP series meters measure a huge number of network parameters: instantaneous voltage, current, frequency, power (active, reactive, total), power factors, phase angles; accumulated energy values for each channel. Among other things, MAP meters allow you to measure the harmonic coefficients for voltage and current, which is important for assessing the quality of electricity in networks with “evil” consumers.
The voltage is applied directly to the meter terminals, and the current for each channel is measured by detachable current transformers. This is very convenient when installing the counter in the finished shield.
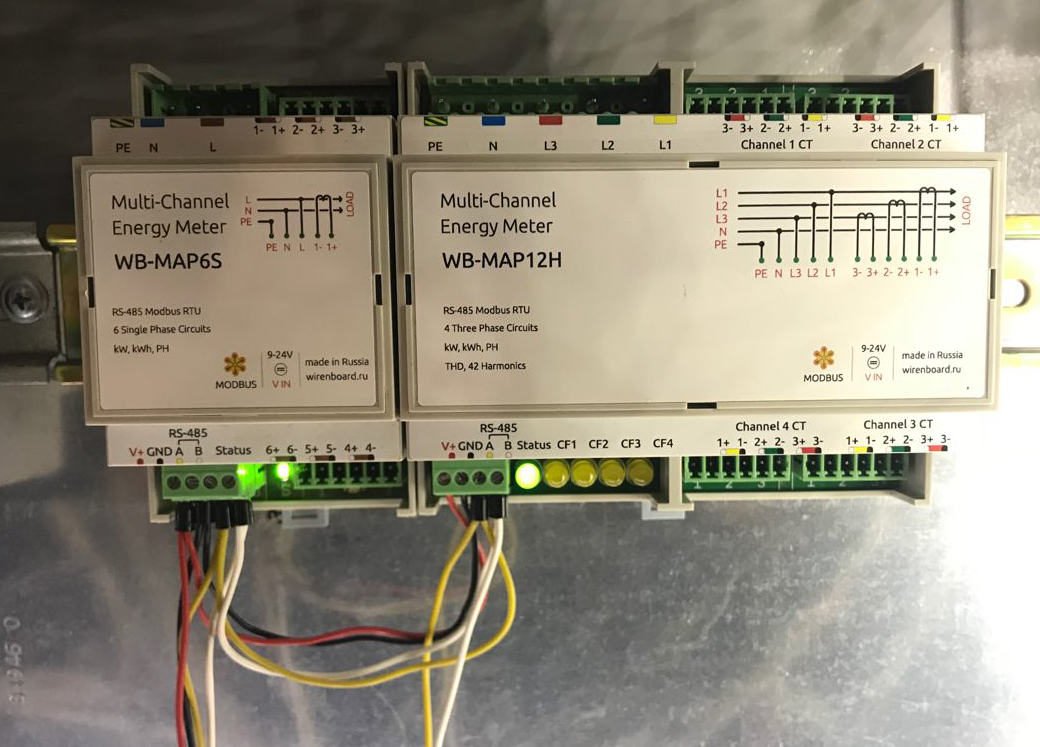
Installation of counters
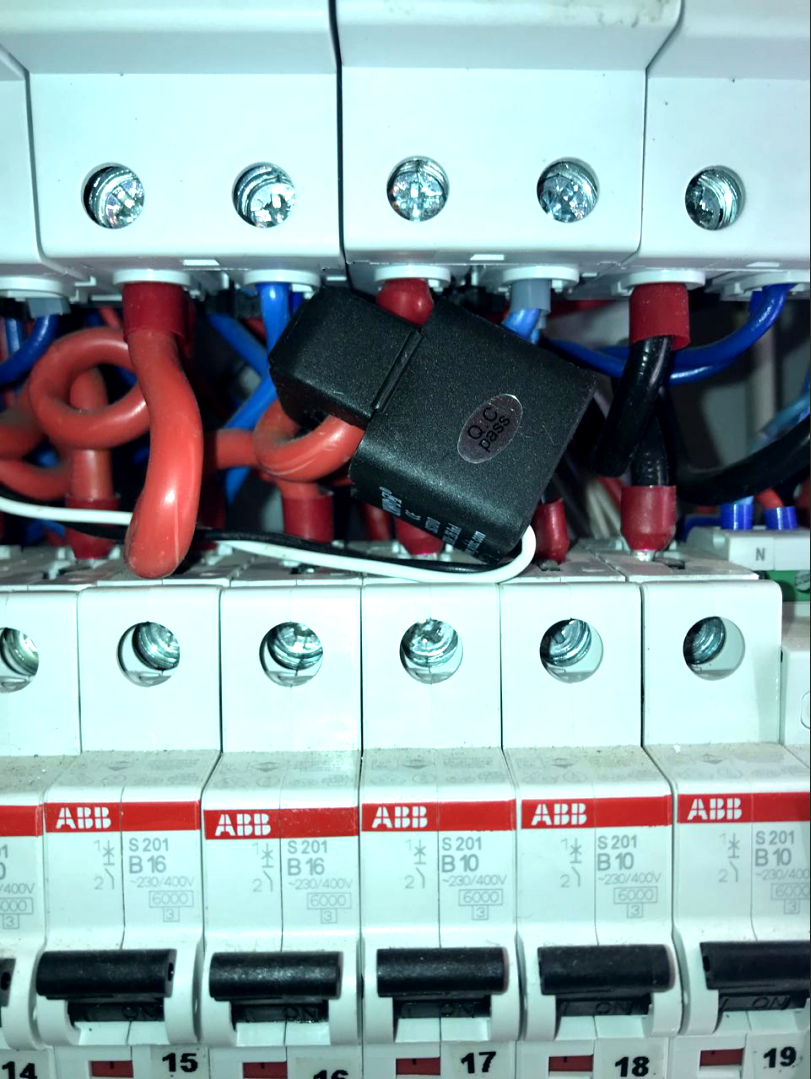 | 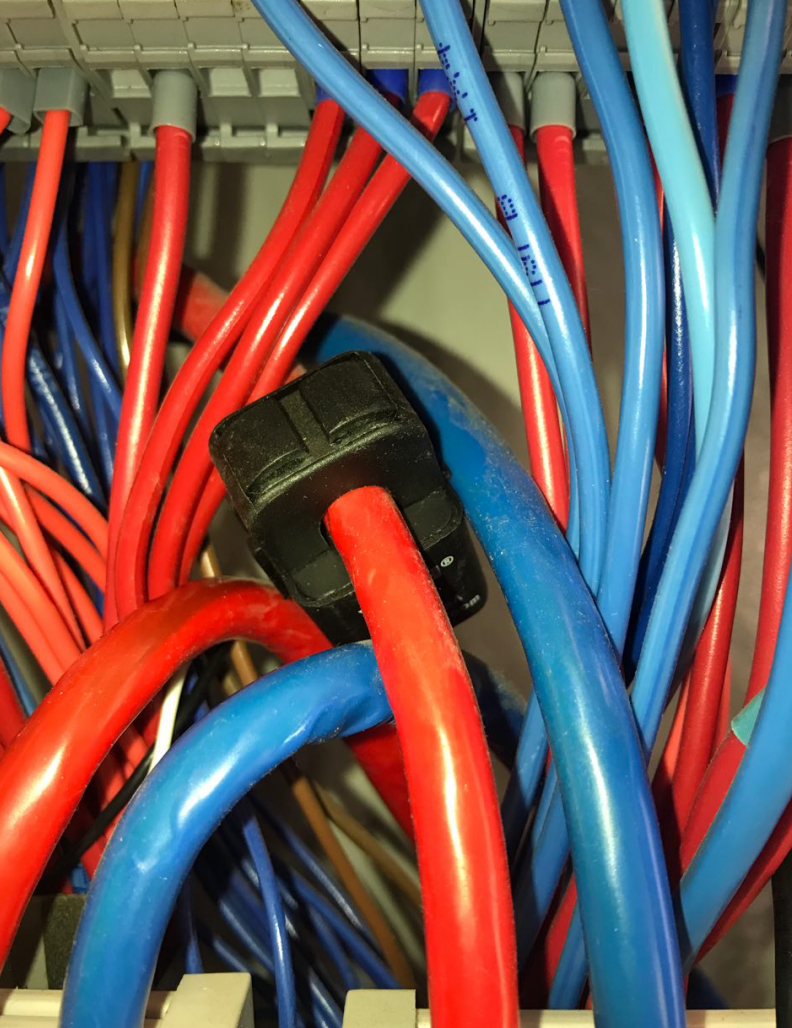 |
In the demonstration boards, the current transformers look beautiful and neat (as in the picture in the post title), in real life you have to place the transformers where it turns out. And yes, shields should be big!
The project of automation of my summer cottage at home, as I described in detail in the previous article, is based on the previous version of our Wiren Board 5 controller, to which various relay modules, actuators and sensors are connected via Modbus interface.
Before the next weekend, I armed myself with two WB-MAP6S counters and one WB-MAP12H and started a business. The initial estimations by the number of measurement channels turned out to be wrong, of course: there were more consumers who wanted to be monitored, so some time had to be spent thinking about which groups to measure consumption.
General input, loads after the stabilizer and inverter, convectors and air conditioners (each separately), two boilers, a telecommunications closet, automatic gates, a refrigerator, a heated floor were selected.
Counters collect a huge number of parameters (WB-MAP12H has more than a thousand registers), but even a constant survey of several dozens of parameters from each counter becomes a significant load on the RS-485 bus if polled too often. I reduced the standard templates that come with the controller to the required minimum of parameters.
I transferred the counters to the second RS-485 bus of the Wiren Board controller, so as not to interfere with the normal operation of the relay modules and sensors, and increased the speed to 115200 kbps. In this configuration, the polling of meters began to be performed quite vigorously and did not interfere with the functioning of the rest of the automation.
Before proceeding to the practical use of the results, they must be analyzed from all sides. The Wiren Board controller has a built-in database and simple visualization tools, but for serious tasks it is worth using more serious tools.
Remembering that, after all, I did Zabbix CP, I decided to deploy monitoring on it, but I was overwhelmed by the craving for a new one, and I decided to try to use the popular bundle Influxdb + Grafana to store and display data. The controller transmits all the data in the form of mqtt-topics to a separate mqtt-broker on the server, where the Python script processes it and stores it in Influx. Grafana is also installed there to display everything.
The first results did not disappoint me. Here are some examples.
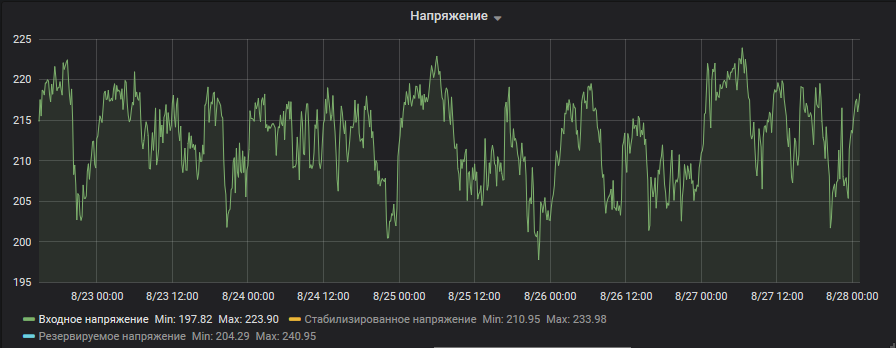
Mains voltage
All the failures, with rare exceptions, occur at around 21:00 - 23:00 and on weekends are especially noticeable. Peaks - early morning.
This is how the work of two stabilizers (yellow and blue lines) looks like:
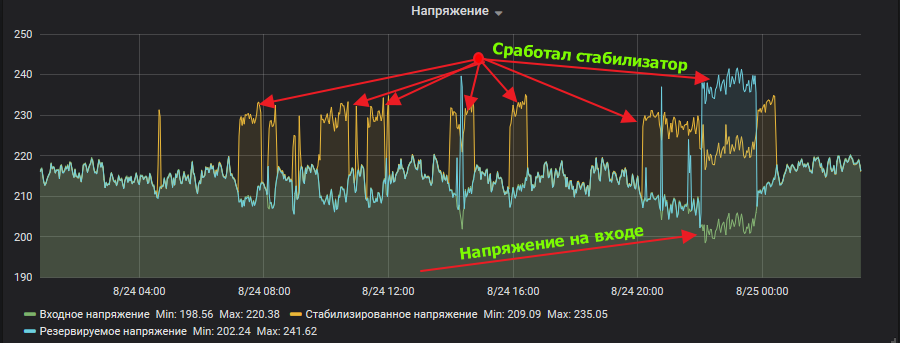
These are ordinary relay stabilizers of a well-known Latvian-Chinese manufacturer in wide circles, changing the output voltage with a rather large step. Nothing special, although it is clear that one of them is prone to switching to the very limit values (which fit, however, in the framework of GOST) voltage values. The first candidate to replace.
Instant values are displayed in the form of such graphan widgets:

Simply and clearly, it is suitable for displaying on an information screen or a tablet on a wall.
The instantaneous power graph for all consumers looks very picturesque (click on the image to open in full scale): Large and green is not a crocodile, but a total power at the entrance. Grafana allows you to select from a chart not only all, but one or more indicators of interest. Power factor (cos φ). In modern home appliances, he is quite well. I researched the work of three consumers: air conditioner, refrigerator and water heater. The water heater has a power factor of 1 - “high” (0.95 ... 1) at the time of active operation, and 0.85 - good (0.8 ... 0.95) in the refrigerator; the power factor of the air conditioner (0.76) is located at the upper limit of the “satisfactory” range (0.65 ... 0.8). Inverter air conditioner:

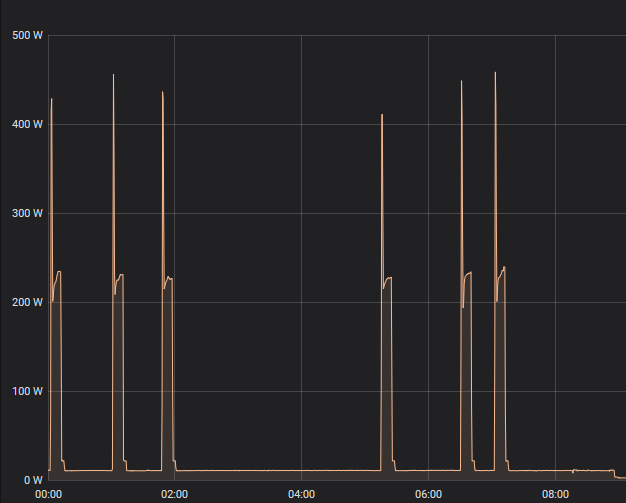 | 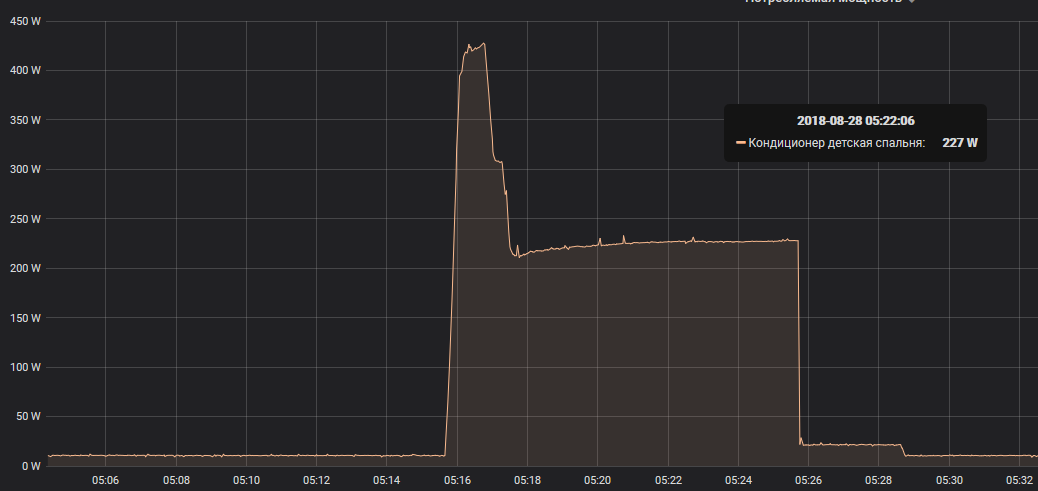 |
Work in the normal cooling mode and the structure of a separate peak of compressor activation (on the right)
Peaks are visible at the initial start-up of the compressor of the external unit, stable operation mode, standby mode.
How does the refrigerator work? “Dr.-dr-dr-dr-dr-dr-dr-dr?” Almost. The compressor starts up periodically, as it gets warmer inside the chambers:
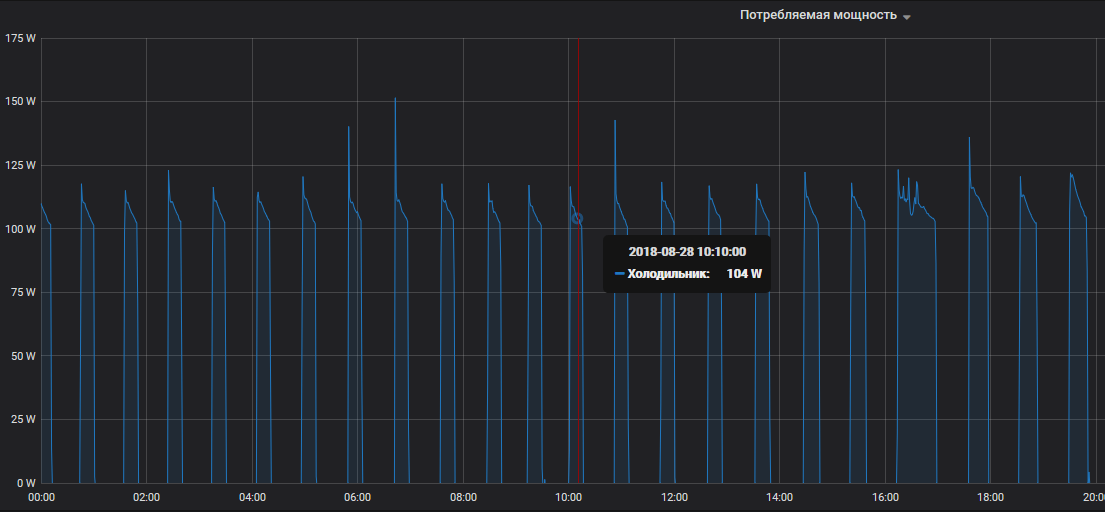
Periodic starts of the refrigerator compressor
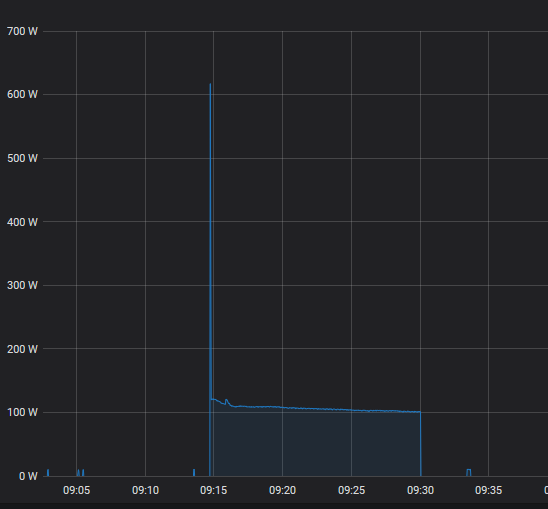
Structure of a separate peak of power consumption
Separate cycle: a surge of power is seen when the compressor of the refrigerator is turned on. WB-MAP counters are quite sensitive: see these small peaks, about a dozen watts? This light bulb ignited inside the refrigerator: someone climbed into it!
The heated towel rail operates in a constant on / off cycle to maintain the set temperature:
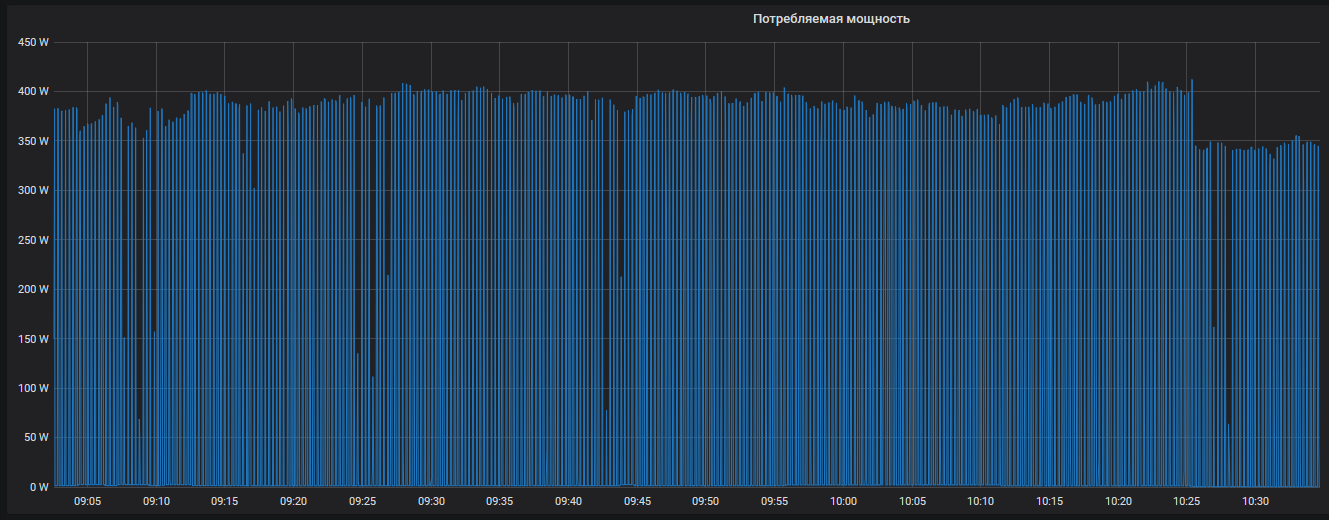 | 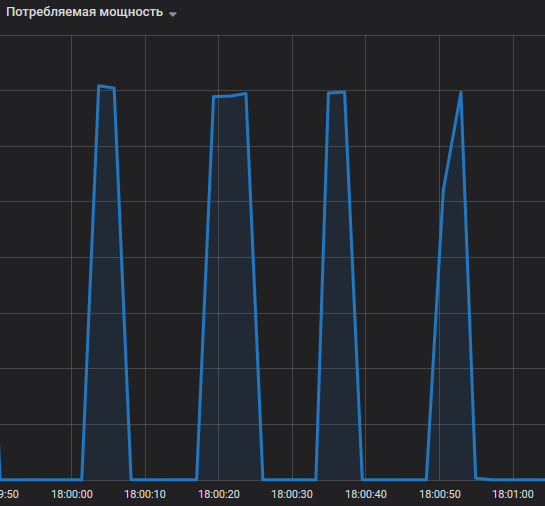 |
On the right is a more detailed picture of the individual consumption peaks
. The cooking surface also works in approximately the same way:
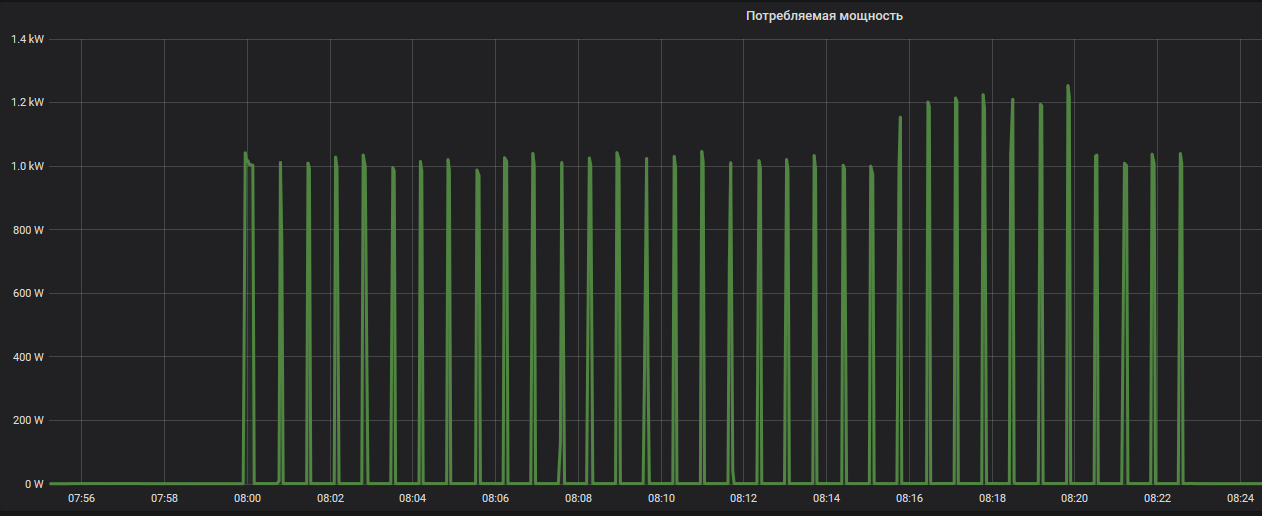
It seems that this was my morning coffee.
Interesting energy consumption profile at automatic gates:
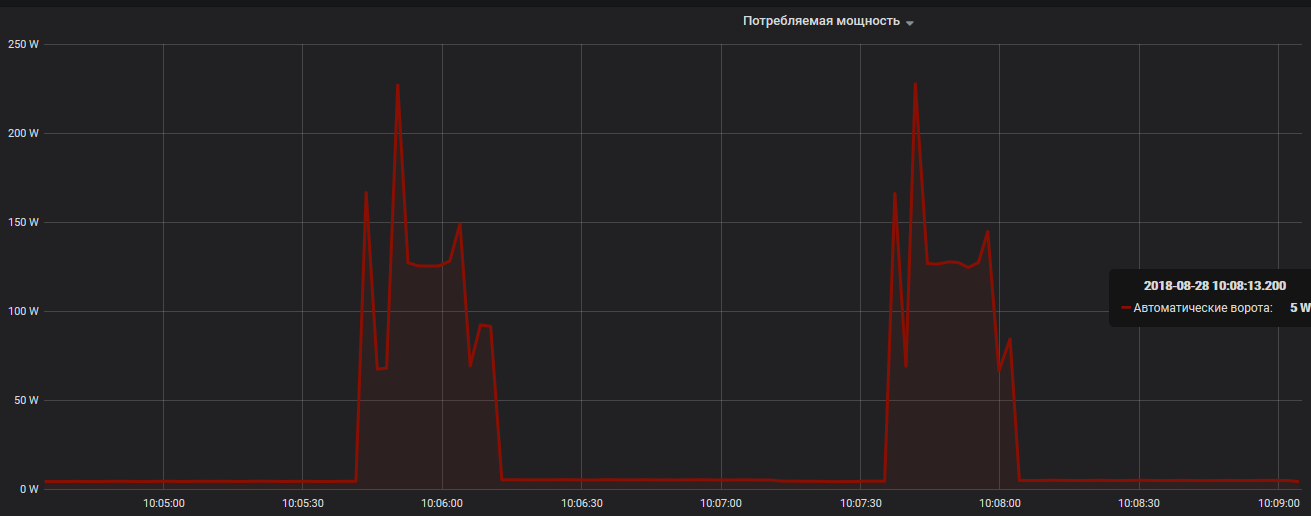
They consume about 5 watts in standby mode, during operation, the energy consumption profile allows you to see the separate phases of the movement of the valves: the first starts to open, then the second starts, then they open together, and then the motors in turn shut off.
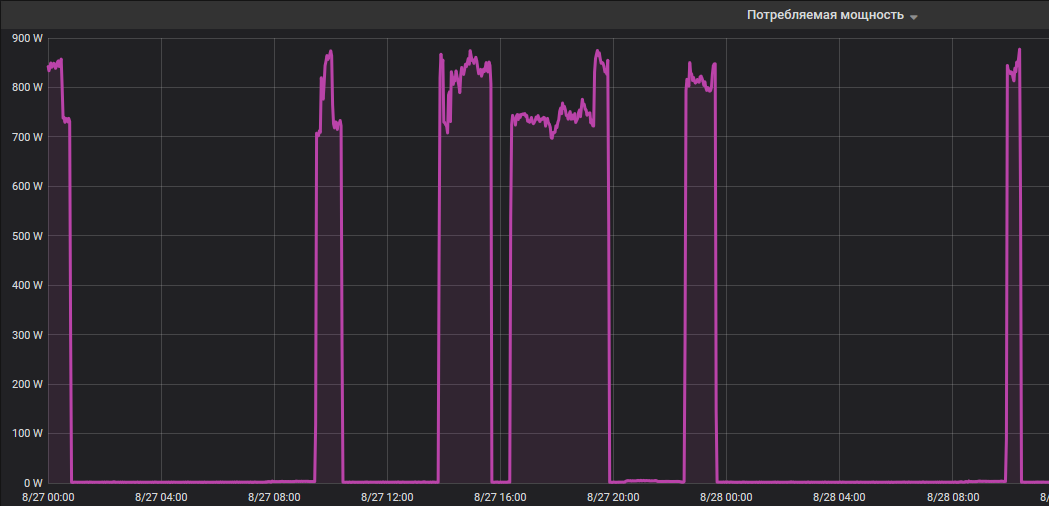
The boiler maintains the temperature of the water, the frequency and time of the inclusions depend on the consumption of hot water:
I will not tire further readers with graphs - I will show a sign! (Grafana can not only build graphs, but also display data in tables and bar charts.)
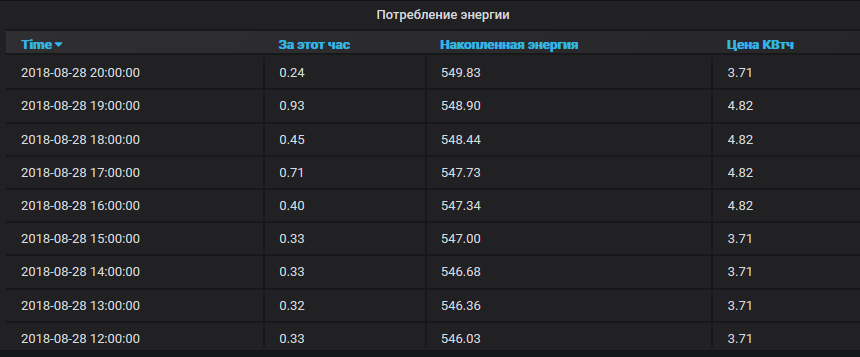
The label is simple and allows you to track the total energy consumption by the hour, as well as to estimate how much it cost every hour in accordance with the current tariff. The old version of Influxdb, which is placed from the repositories of the current version of Ubuntu on the server, does not know how to make the usual samples from the samples, so it was not possible to add a column with the value of each hour.
The consumption diagram looks like this:
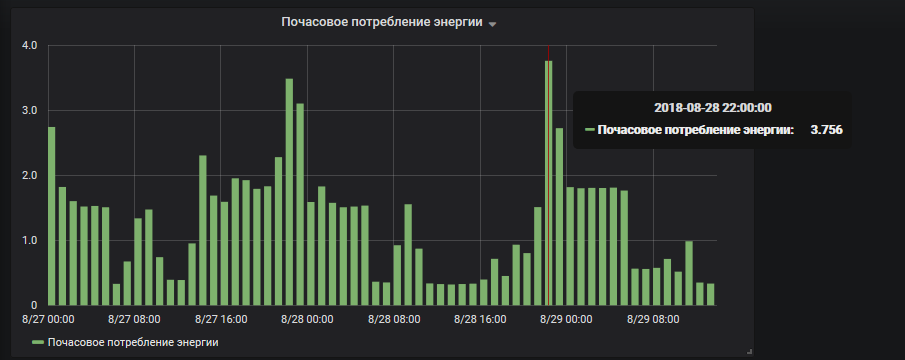
Considering that Gafana can generate alarm messages, the result is quite enough for the light-version of power monitoring.
However, I want to solve more exciting problems.
- Current and voltage harmonics. Do they carry useful information for the home? Often, bad consumers or sparkling contacts generate high order harmonics. How long is the temporary resolution of the counters enough to detect them and make some decisions about disabling the “bad loads”? Or just give out alerts?
- Air conditioners and convectors. If you start from the temperature in the room, you can understand what mode the air conditioner is in: does it try to cool the convector with wild persistence (the convector should be turned off) or do they work together to heat the room faster if the air conditioner is in reverse mode for heating?
- Goal. If the energy consumption profile changes and starts to differ significantly from the regular one, then this may indicate that there is some obstacle, the oil thickens in the drives from low temperature, someone opens and closes the gate too often. Here you can send warnings, turn off the power. Will the controller, Influx and Grafana be enough for this? Perhaps such things should be implemented in a separate script, signed only for messages with the values of the parameters of energy consumption of the gate.
- Pumping station and borehole pump. Together with the assessment of water consumption it is possible to track the performance drop due to some faults, leaks, problems with storage tanks.
- The operation of the septic tank compressor can also be assessed by its power consumption, although air consumption is more informative, in my opinion.
- Water heaters. The well is very hard water, scaling forms quickly enough. Accordingly, the heating elements have to work more and in a more rigid mode, heating the water from under the additional casing of the scale (it also starts to burn, if it is rather thick). It will be interesting to understand if there is enough analysis of power consumption for detecting the formed scale (boilers do not have an interface to report the temperature of water in the tank)?
- General power consumption - if the currents are within the limits, low-priority loads can be switched off.
I would be glad if someone offers an unexpected and interesting use of monitoring the energy consumption of individual devices.
Until we meet again, friends!
