Advanced JavaScript debugging with console.table ()
- Transfer
Yesterday I learned about one nifty debugging feature in Chrome Developer Tools. At the Web Developer Conference Compact , Marcus Ross ( @zahlenhelfer ) talked about various debugging tools implemented in Chrome, one of which I want to talk about.
Imagine that you have an array of programming languages with their corresponding file extensions:
After console.log, you will see the following:
This tree is certainly useful for debugging, but it is rather cumbersome, and it is not particularly convenient to deploy each node manually. With console.table you can do better.
Instead of console.log we will use console.table:
Make sure the console is open before refreshing the page, otherwise you will not see anything. If everything is done correctly, you will see the following:
Pretty neat, right?
Of course table works best with tabular data. If all objects have completely different fields, you will get a table in which most cells are undefined. But, despite this, everything will look neat, giving you a good overview.
It's nice that console.table works the same with objects:
Nothing to add…
If you want to display only certain properties, you can list them in the second console.table parameter:
For a single property, just use the line:
I thought I knew most of the "Chrome Developer Tools" functionality - I was wrong. The “tools” are filled with useful things that are just waiting to be used. Seriously, go to the official documentation page , I’m sure you will definitely find something new for yourself.
From a translator: I hope not only I did not know about this opportunity. In any case, rummaging around in the hub, I found an awesome article on the topic - FireBug * Console API - the console there is just broken down by bones ...
Array logging using console.log
Imagine that you have an array of programming languages with their corresponding file extensions:
var languages = [
{ name: "JavaScript", fileExtension: ".js" },
{ name: "TypeScript", fileExtension: ".ts" },
{ name: "CoffeeScript", fileExtension: ".coffee" }
];
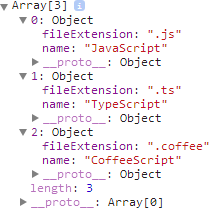
console.log(languages);
After console.log, you will see the following:
This tree is certainly useful for debugging, but it is rather cumbersome, and it is not particularly convenient to deploy each node manually. With console.table you can do better.
Array logging using console.table
Instead of console.log we will use console.table:
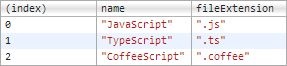
console.table(languages);
Make sure the console is open before refreshing the page, otherwise you will not see anything. If everything is done correctly, you will see the following:
Pretty neat, right?
Of course table works best with tabular data. If all objects have completely different fields, you will get a table in which most cells are undefined. But, despite this, everything will look neat, giving you a good overview.
Logging objects using console.table
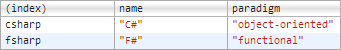
It's nice that console.table works the same with objects:
var languages = {
    csharp: { name: "C#", paradigm: "object-oriented" },
    fsharp: { name: "F#", paradigm: "functional" }
};
console.table(languages);
Nothing to add…
Filter the displayed properties.
If you want to display only certain properties, you can list them in the second console.table parameter:
// Несколько свойств
console.table(languages, ["name", "paradigm"]);
For a single property, just use the line:
// Одно свойство
console.table(languages, "name");
Summarize
I thought I knew most of the "Chrome Developer Tools" functionality - I was wrong. The “tools” are filled with useful things that are just waiting to be used. Seriously, go to the official documentation page , I’m sure you will definitely find something new for yourself.
From a translator: I hope not only I did not know about this opportunity. In any case, rummaging around in the hub, I found an awesome article on the topic - FireBug * Console API - the console there is just broken down by bones ...