Zabbix + Cisco ISR: monitor VPN tunnel load through SNMP + Perl script + LLD
Task: There is a Cisco router with a bunch of configured site-to-site IPsec-VPN tunnels. It is necessary to configure monitoring of loading of tunnels in Zabbix 2.0.x.
It is assumed that SNMP on tsiska and in Zabbix is already configured.
The main problem is that the SNMP OIDs we need for monitoring with traffic counts are generated dynamically. Moreover, lists of these numbers are also generated dynamically.
This is a consequence of the fact that the tunnel construction algorithm itself is rather complicated. First, the ISAKMP service tunnel is formed, then the main IPSEC tunnel for data. You can read more about this here: linkmeup.ru/blog/50.html (by the way, an excellent training cycle for this author’s articles on the basics of configuring Cisco equipment was already in Habré).
The specific algorithm for extracting the treasured traffic samples is so muddy that it is apparently impossible to implement it with purely built-in Zabbix tools. But what’s there, I couldn’t even translate artistically. I allow myself a description from the forum www.networking-forum.com :
Fortunately, the good people from the Cacti forum have written a pearl barley script that does all the dirty work itself.
Download the script and drop it into the ExternalScripts folder (/ usr / local / share / zabbix / externalscripts by default).
Since there are many tunnels and sometimes they change, we apply LLD (low-level discovery rules) in Zabbix so that all the tunnels are detected and registered in our system.
We create a new template, and in it there is a detection rule and prototypes of data elements for incoming and outgoing traffic: Full


key: query_asa_lan2lan.pl ["{$ SNMP_COMMUNITY}", "{HOST.IP}", "ASA", "get", "RX", "{#SNMPVALUE}"]
Link in the OID description: tools.cisco.com/Support/SNMP/do/BrowseOID.do?local=en&translate=Translate&objectInput=1.3.6.1.4.1.9.9.171.1.2.3. 1.35 # oidContent
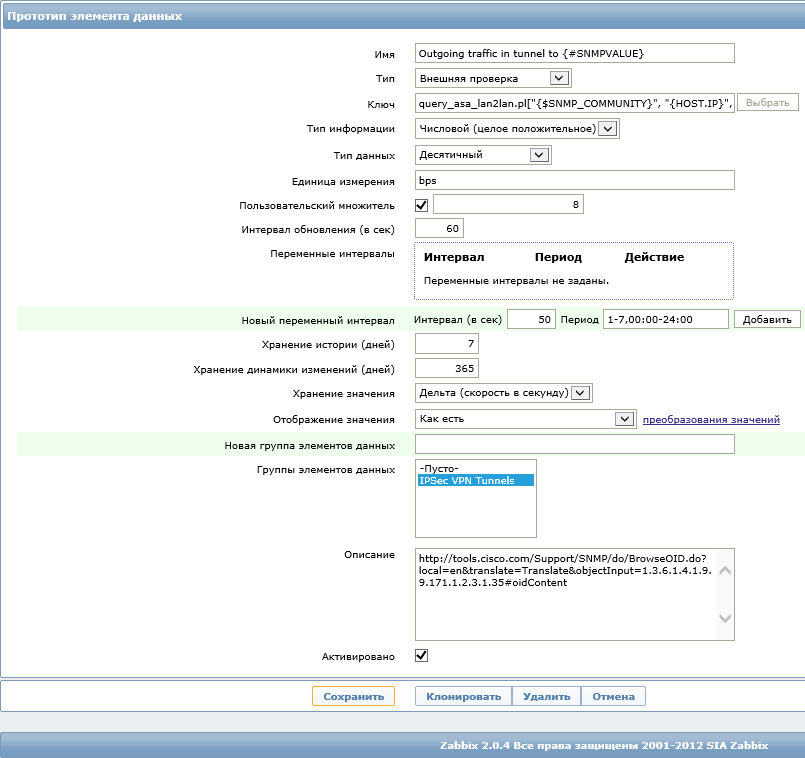
Key completely: query_asa_lan2lan.pl ["{$ SNMP_COMMUNITY}", "{HOST.IP}", "ASA", "get", "TX", "{#SNMPVALUE}"]
Link in the OID description:tools.cisco.com/Support/SNMP/do/BrowseOID.do?local=en&translate=Translate&objectInput=1.3.6.1.4.1.9.9.171.1.2.3.1.35#oidContent
Apply the template to the right hosts, wait for autodiscovery and behold our tunnels.
It remains to make graphs for the tunnels. Unfortunately, LLD does not allow you to automatically create consolidated graphs from several data prototypes; you have to add the detected data elements manually:

Hurray! You can show off live pictures to the boss.
It is assumed that SNMP on tsiska and in Zabbix is already configured.
The main problem is that the SNMP OIDs we need for monitoring with traffic counts are generated dynamically. Moreover, lists of these numbers are also generated dynamically.
This is a consequence of the fact that the tunnel construction algorithm itself is rather complicated. First, the ISAKMP service tunnel is formed, then the main IPSEC tunnel for data. You can read more about this here: linkmeup.ru/blog/50.html (by the way, an excellent training cycle for this author’s articles on the basics of configuring Cisco equipment was already in Habré).
The specific algorithm for extracting the treasured traffic samples is so muddy that it is apparently impossible to implement it with purely built-in Zabbix tools. But what’s there, I couldn’t even translate artistically. I allow myself a description from the forum www.networking-forum.com :
those OIDs refer to bytes used solely over the phase 1 tunnel. In order to get actual user traffic over the phase 2 tunnels you must get the phase 1 index ID using the endpoint address from SNMPv2-SMI :: enterprises.9.9.171.1.2.3.1.7, then map that to the phase 2 index ID ( s) from SNMPv2-SMI :: enterprises.9.9.171.1.3.2.1.2, then you can use SNMPv2SMI :: enterprises.9.9.171.1.3.2.1.26 and SNMPv2-SMI :: enterprises.9.9.171.1.3.2.1.39 with the phase 2 index ID appended for the actual phase 2 traffic.
Inquisitives can pull the necessary OIDs with their hands in order to see firsthand the scale of the disaster:
zabbix-host:~ # snmpwalk -v2c -c  SNMPv2-SMI::enterprises.9.9.171.1.2.3.1.7
SNMPv2-SMI::enterprises.9.9.171.1.2.3.1.7.479 = STRING: "091.092.093.094"
SNMPv2-SMI::enterprises.9.9.171.1.2.3.1.7.483 = STRING: "012.013.014.015"
SNMPv2-SMI::enterprises.9.9.171.1.2.3.1.7.499 = STRING: "162.163.164.165"
SNMPv2-SMI::enterprises.9.9.171.1.2.3.1.7.505 = STRING: "217.218.219.220"
zabbix-host:~ # snmpwalk -v2c -c  SNMPv2-SMI::enterprises.9.9.171.1.3.2.1.2:
SNMPv2-SMI::enterprises.9.9.171.1.3.2.1.2.8830 = INTEGER: 462
SNMPv2-SMI::enterprises.9.9.171.1.3.2.1.2.8831 = INTEGER: 462
SNMPv2-SMI::enterprises.9.9.171.1.3.2.1.2.8832 = INTEGER: 462
SNMPv2-SMI::enterprises.9.9.171.1.3.2.1.2.8833 = INTEGER: 462
SNMPv2-SMI::enterprises.9.9.171.1.3.2.1.2.8834 = INTEGER: 499
SNMPv2-SMI::enterprises.9.9.171.1.3.2.1.2.8835 = INTEGER: 499
SNMPv2-SMI::enterprises.9.9.171.1.3.2.1.2.8836 = INTEGER: 499
SNMPv2-SMI::enterprises.9.9.171.1.3.2.1.2.8837 = INTEGER: 499
SNMPv2-SMI::enterprises.9.9.171.1.3.2.1.2.8838 = INTEGER: 499
SNMPv2-SMI::enterprises.9.9.171.1.3.2.1.2.8839 = INTEGER: 499
SNMPv2-SMI::enterprises.9.9.171.1.3.2.1.2.8840 = INTEGER: 499
SNMPv2-SMI::enterprises.9.9.171.1.3.2.1.2.8841 = INTEGER: 499
SNMPv2-SMI::enterprises.9.9.171.1.3.2.1.2.8842 = INTEGER: 499
Fortunately, the good people from the Cacti forum have written a pearl barley script that does all the dirty work itself.
Download the script and drop it into the ExternalScripts folder (/ usr / local / share / zabbix / externalscripts by default).
Let's play around with this script manually:
Works!
zabbix-host:/usr/local/share/zabbix/externalscripts # perl query_asa_lan2lan.pl  ASA get RX
70546023
Works!
Since there are many tunnels and sometimes they change, we apply LLD (low-level discovery rules) in Zabbix so that all the tunnels are detected and registered in our system.
We create a new template, and in it there is a detection rule and prototypes of data elements for incoming and outgoing traffic: Full
key: query_asa_lan2lan.pl ["{$ SNMP_COMMUNITY}", "{HOST.IP}", "ASA", "get", "RX", "{#SNMPVALUE}"]
Link in the OID description: tools.cisco.com/Support/SNMP/do/BrowseOID.do?local=en&translate=Translate&objectInput=1.3.6.1.4.1.9.9.171.1.2.3. 1.35 # oidContent
Key completely: query_asa_lan2lan.pl ["{$ SNMP_COMMUNITY}", "{HOST.IP}", "ASA", "get", "TX", "{#SNMPVALUE}"]
Link in the OID description:tools.cisco.com/Support/SNMP/do/BrowseOID.do?local=en&translate=Translate&objectInput=1.3.6.1.4.1.9.9.171.1.2.3.1.35#oidContent
Apply the template to the right hosts, wait for autodiscovery and behold our tunnels.
It remains to make graphs for the tunnels. Unfortunately, LLD does not allow you to automatically create consolidated graphs from several data prototypes; you have to add the detected data elements manually:
Hurray! You can show off live pictures to the boss.